SVG not displaying scatter output #8446
Comments
|
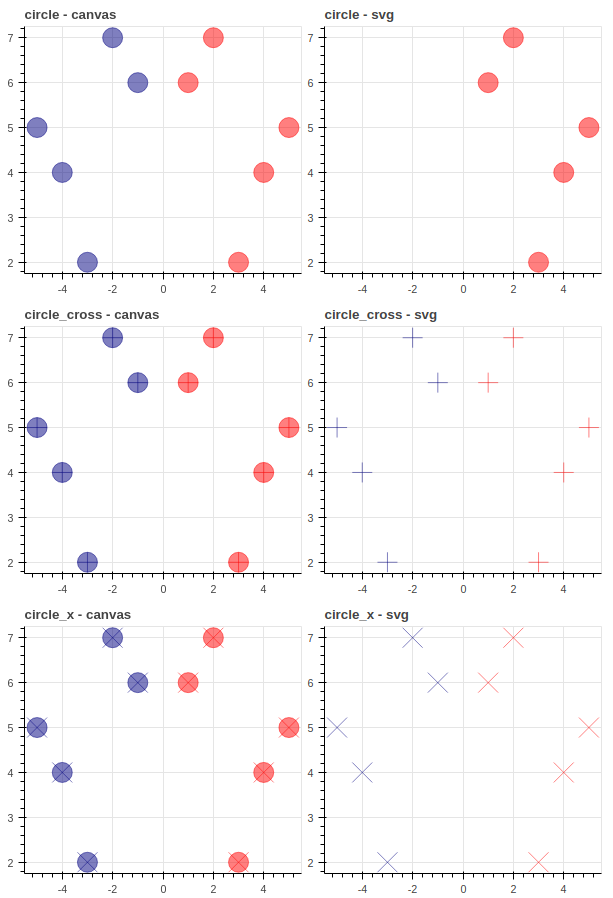
Seems to be a problem with all circle-type markers and
Code to reproduce: from bokeh.plotting import figure
from bokeh.io import save
from bokeh.layouts import row, column
from bokeh.core.enums import MarkerType as markers
def mkplot(marker, backend):
p = figure(plot_width=300, plot_height=300, title="%s - %s" % (marker, backend))
p.output_backend = backend
p.toolbar_location = None
p.scatter([-1, -2, -3, -4, -5], [6, 7, 2, 4, 5], size=20, color="navy", alpha=0.5, marker=marker)
getattr(p, marker)([1, 2, 3, 4, 5], [6, 7, 2, 4, 5], size=20, color="red", alpha=0.5)
return p
def mkplots(marker):
return row(mkplot(marker, "canvas"), mkplot(marker, "svg"))
p = column([ mkplots(marker) for marker in markers ])
save(p) |
|
There are errors in JS console: (hidden when using |
|
Hi, I also ran into this problem, and I was wondering if there is a quick solution to this? Thank you. |
|
@kawairine I am afraid there is not. As mentioned above, Bokeh SVG output capability depends on a third party library and that library is no longer maintained at all. We will have to either re-do all of the SVG functionality, or find and integrate another new library that is maintained, or take ownership of the existing dependency. All of those are fairly heavy-lift tasks. I can't speculate when they might be gotten to with the current core team. We could really use help from new contributors to improve this situation faster. |
ALL software version info (bokeh, python, notebook, OS, browser, any other relevant packages)
Bokeh: 1.0.1
IPython: 6.5.0
Description of expected behavior and the observed behavior
I expect the chart below to contain both navy and red circles. The red circles are displayed, but the navy circles created by the .scatter method do not appear.
Complete, minimal, self-contained example code that reproduces the issue
Screenshots or screencasts of the bug in action
The text was updated successfully, but these errors were encountered: