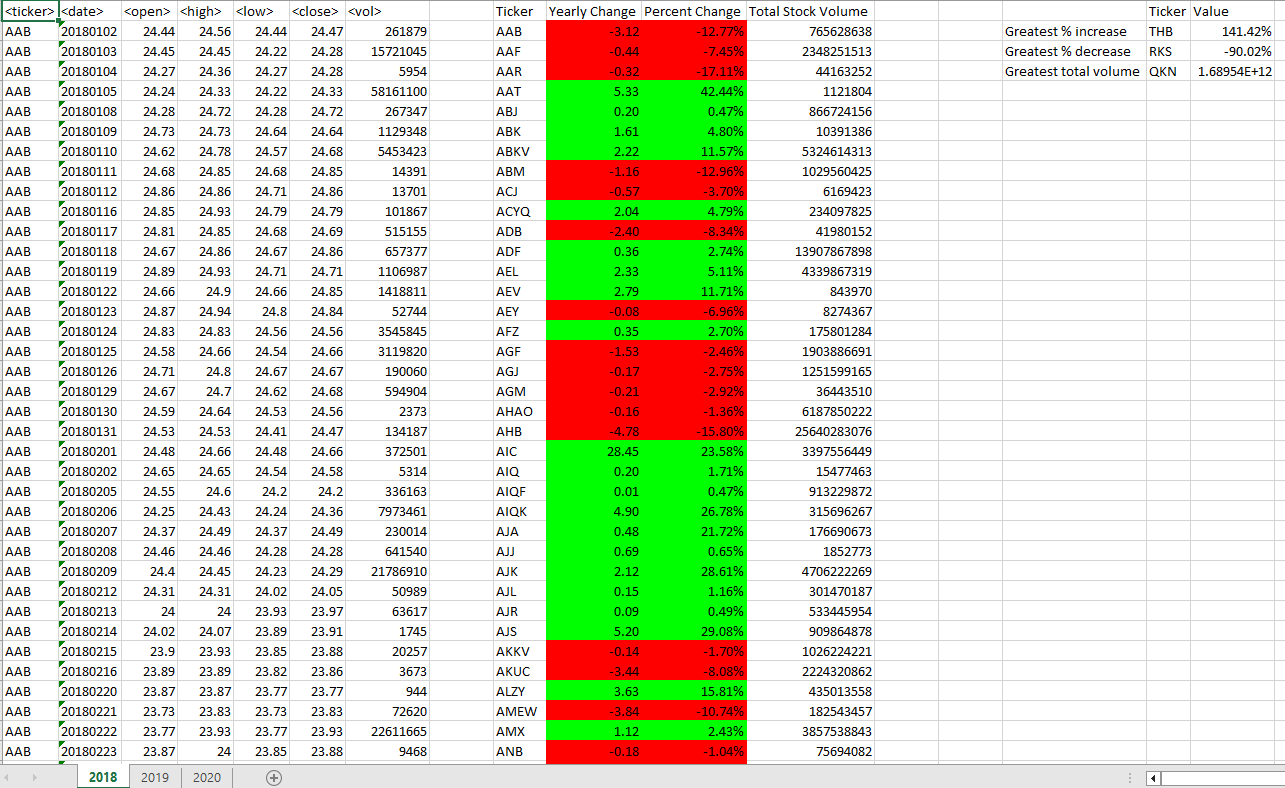
In this activity, it was requested to create a script that loops through all the spreadsheet tabs and outputs the following information:
-
The ticker symbol.
-
The yearly change from the opening price at the beginning of a given year to the closing price at the end of that year.
-
The percentage change from the opening price at the beginning of a given year to the closing price at the end of that year.
-
The total stock volume.
-
The Greatest % increase, the Greatest % decrease, and the Greatest total volume.
-
Conditional formatting, highlighting positive change in green and negative change in red for the Yearly Change and the Percent Change columns.


—