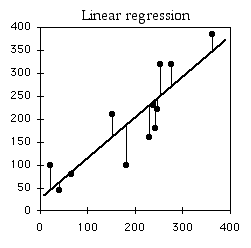
This technique is used to predict the real valued output or near-real valued output, on a given data set. In this technique the trend is analysed in prior data set and predict the values accordingly.
The line represents the predicted values, and dots( above and below) represents the actual values.
The General Equation of a line is: Y=mx+c
Our objective is to minimize the distance between two; for this calculate
This gives the mean square distance of the data-sets values( Dots on above graph) and predicted values(line). This is given by:

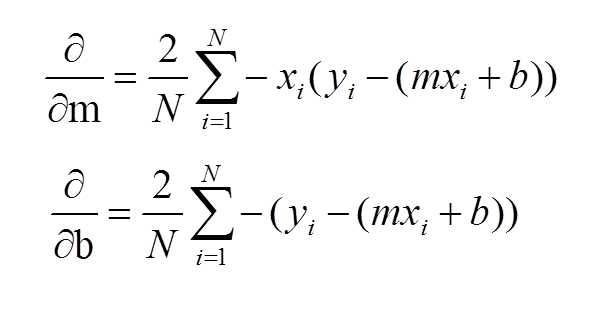
We have to calculate values m,b; So that our Error function can be minimum:
Gradient Descent at a point gives the tangent to curve we are traversing. It gives us the direction whether to traverse up or down.
Learning Rate is used to determine how fast to learn. The Learning Rate cannot be too high and can not be too low, we have to choose according to the given data set.
This Classification is based on Bayes Theorm (reference: ML for hackers). The text is extracted from all the e-mails and occurances, probability is calculated in each type of Corpuse (easy ham , Hard ham, Spam).
All emails are in text format easyham - The messages which can be easily classified as ham(not spam). hardham - The messages which can not be easily classified as ham(not spam). spam - The messages which can be easily classified as spam. The probability of each keyword is calculated and tested against spam classifier.
Extract each message texts and compare against the obtained values.
This model got the following accuracy: Spam : 73% hardham : 93% ham : 98%
Siraj Raval and Andrew Ng for awesome teaching. -XOXO

