Performance drop when using HTTPS together with compression in Kubernetes #1908
Comments
|
Could you provide more information about CPU, RAM consumption? |
|
I have been running the pod on a machine with 4 core cpus and 8 Gbs of RAM . the cpu usage is not high most of the time but has surges from time to time. ram is 6 GB used and 2GB remaining most of the time. I have no resource limits on the traefik pod |
|
@miadabrin thanks for reporting. Could you provide metrics on Traefik, especially CPU and memory consumption over time? Are you possibly able to send the same kind of requests directly towards the proxy? If so, do you see any difference in performance behavior? What happens if you swap out Traefik with Nginx or HAProxy? |
|
Unfortunately the metrics are gone after restarts but I will see if I can provide one .I haven't tried nginx or haproxy on this workload. I might try it and put the results here. I can't serve the same workload from proxy since all traffic is ingress based so it would not be an accurate metric. |
|
I've also seen similar behaviour since updating to 1.3.X. Traefik behaves as expected for several hours/days handling around 30k requests per minute but during a load test that pushed it to 120k all the traefik pods became unresponsive and the requests all timed out - ill dig out the metrics when I get back into work. |
|
I might also be facing something similar on a single-machine test cluster (KVM 2CPUs/2GB RAM). Traefik works fine, but constantly enters some odd state when I load one specific static page through it. There is nothing special about the page itself, just an html with a few images served by nginx (about 2MB total). Serving that page via a port (without ingress) does not demonstrate any anomalies, however, doing that via traefik makes the netdata CPU charts look crazy. Here is the CPU load after the page has been hit (the load is normally around 10% since no one except me is visiting the server):
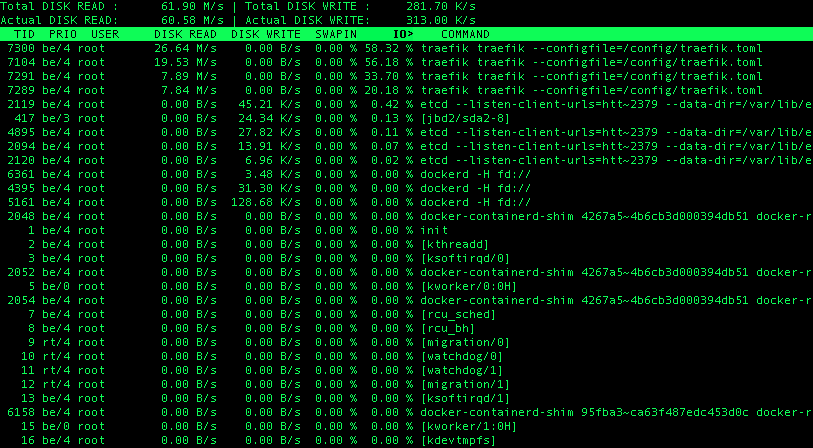
The peak sometimes lasts over one minute and only killing traefik pod brings things back to normal. The CPU seems to be so busy because of some excessive io operations (
RAM and swap don't look scarce and don't change much during the peaks:
Saw this both with 1.3 and 1.4-rc2. Ingress controller flavour: official helm chart. |


|
@kachkaev thanks a lot for the detailed analysis, very much appreciated. 👏 You mention that "only killing traefik pod brings things back to normal". Does that also hold when you stop letting Traefik serve any traffic at all? Or would the CPU utlization level off as soon as Traefik is given time to recover? Do you possibly have a chance to send a SIGQUIT to one locked up Traefik pod and paste the output? It should give an overview of all running goroutines. I'm kind of speculating we might end up in a situation where goroutines pile up like crazy and never terminate (i.e., goroutine leaking). Thanks again -- I'm super keen in figuring out what's going wrong here. |
|
Hi @timoreimann, really glad you're keen to investigate this! I'm running traefik on a single-VM cluster for personal projects, so any experiments are easy to run. Regarding "killing traefik pod". It seems that once traefik has started producing a lot of iowait, stopping serving things via it does not help, at least immediately. The CPU chart in netdata was still pink 3 minutes after closing the browser tab (i.e. cancelling all requests). Although I was not contacting traefik myself, there was a small chance of usual hits from healthcheckers and bots, but these were supposed to be very rare and to different uris, which never triggered that much load. Going to k8s dashboard and clicking on "delete traefik pod" button restarted traefik and reduced the CPU load to 5-10 percent immediately:
Interestingly, RAM and swap charts look like there's been nothing happening at all:
Doing things like killing processes with signals is too advanced for me, but looks like I've managed how to do this :–) Typing One other thing I tried earlier today was manually adding a docker backend to toml and linking a container via this backend (i.e. by using the same traefik instance, but bypassing k8s). I did this when I was not sure if the load is to do with traefik or k8s logging, docker layers etc. Unfortunately, the same odd state kept being triggered when I was opening my static page via the docker backend, just the same as in k8s. So the bug might not be just ingress-specific. Bypassing traefik either by externalising docker port or k8s service to NodePort does not produce any peaks in the netdata charts. The most recent tests were done with traefik 1.4.0-rc2. What other data would you be interested to dig out? |


|
Thanks for the stack traces; I'll try to find some time next week to analyze the dump. One more thing: I suppose that web page of yours is non-public. Do you think it's possible to generalize/simplify/anonymize it so that it can be used by others (i.e., me) while still being able to reproduce the bug? That'd make things tremendously easier. |
|
@kachkaev also, have you possibly set the |
|
Great! The page is somewhat private, yes. I'm not sure how much time it will take me to anonymise it and at what point it will stop producing the bug, but if you want, I can share the image with you via a private channel. Feel free to email me or DM on twitter and ask for the details. Re |
|
@kachkaev if you use the TOML file for configuring Traefik and you have customized the parameter, then you should find it in your configuration file with something like this: MaxIdleConnsPerHost = 150If you can't find the option (or you can only find it commented out), then you're running off of the default setting (which would be good to know too). I'll reach out to you via email. |
|
Thanks for the email! |
|
The dump seems to confirm the iowait problem: goroutines sitting at I'm wondering if the very exact number of 150 is just coincidence or happens to indicate at some artificial limit. @kachkaev, could you SIGQUIT another Traefik pod being stuck and check the number of goroutines? (If it's easier for you, a |
|
Goroutine count run-down per |
|
I just killed traefik container two more times with
Each new test was a bit faster than the previous (I'm getting skilled in this 😃) and the number of Will be happy to run more tests if needed! |
|
@kachkaev ouch, that's unfortunate :/ Another way to debug goroutines and memory in traefik: enable debug mode with You can also use https://github.com/divan/expvarmon to follow these stats in time
|

|
Thanks @emilevauge! I added Originally the reported number of
Not sure this is related to Here are the numbers of |

|
I just commented out these lines in toml and restarted the pod: # [entryPoints.http.redirect]
# entryPoint = "https"The results are interesting: hitting the page via the http traefik endpoint for the first time does not produce any iowait artefacts. Then hitting the same url with https creates a peak (not too long in this specific pod reboot, but something like this happened before too). Then using http immediately afterwards does create a peak, but a smaller one:
After a short while http requests stop causing much io, but once an https request hits that page again, http ones become impactful again. |

|
One more insight: removing Can the issue be related to gzipping jpegs? The demo page I privately shared with @timoreimann was a static html with a photo gallery. The container's nginx is configured to gzip a few filetypes, jpegs excluded. Perhaps traefik decides not to double-gzip the text files, but tries gzipping jpegs and finds it hard, especially when combined with tls? FYI |
|
@kachkaev interesting finding! I'm still struggling to repro the problem locally even with compression enabled and running over TLS. My Traefik configuration file looks like this: logLevel = "DEBUG"
checknewversion = false
graceTimeOut = 0
defaultEntryPoints = ["http", "https"]
[entryPoints]
[entryPoints.http]
address = ":8000"
compress = true
[entryPoints.https]
address = ":8443"
compress = true
[entryPoints.https.tls]
[[entryPoints.https.tls.certificates]]
CertFile = "server.crt"
KeyFile = "server.key"
[web]
address = ":8080"
readonly = true
[file]
filename = "rules.toml"Not sure if either the file provider or the fact that I'm using a self-signed certificate makes a difference. |
|
/cc @ldez who has worked on the compression middleware some time ago. |
|
@kachkaev Well done 👏 ! Could you test with compression enabled and |
|
@emilevauge FWIW, the problem is also on 1.4 (see #1908 (comment)). |
|
Good point @emilevauge! I originally discovered this issue both in 1.3.8 and 1.4.0-rc.2, but was only testing 1.4.0-rc.2 afterwards. The peaks in 1.3.8 are confirmed. I manually changed the deployment image to Shame that I don't know go and so can't look through the code, but I hope my findings can still help! |
|
I think the main problem is the compression of the jpeg files. Do you have tested without https? |
|
@ldez HTTP seems to work fine; it's only the HTTPS + compression combo that is problematic. |
|
I believe I have a solution! After looking at my traefik Deployment yaml once again, I noticed that the it had CPU and memory limits automatically configured by the helm chart. These were 200mCPU cores and 30MB of RAM. My previous shallow knowledge of Docker suggested me that if traefik would exceed 30 MB, it would be simply killed, but I still replaced 30MB with 100MB just to check. And TLS finally worked despite This memory limit & swap theory seems to explain everything I've been observing so far, including why the iowait periods were very long after two-three successive page load attempts and why @timoreimann could not reproduce the bug. @miadabrin and @ConorNevin might be also facing the same memory limit problem, just at a higher load level. Although it turned out to be not a bug in traefik's code itself, the situation is probably still worth writing about somewhere in the docs. I'll also speak to the official k8s chart community to make sure helm users do not end up with not very optimal defaults. They should be able to smoothly load photo galleries via TLS with gzip :–) Wish you guys all the best in preparing 1.4.0, about which I'm very excited! |
|
@kachkaev great job !!! 👏 👏 👏 |
|
@kachkaev thanks for the details -- your explanation makes perfect sense. I even discovered the same problem (limits too strict) with another user a few weeks ago but totally forgot about it again. :( I'll make sure we leave a remark in our Kubernetes guide. Keeping the issue open until the PR is ready. To complete the analysis: Docker does kill containers exceeding their memory limits (or, rather, the OOM killer does). However, by default both memory and swapping are taken into account. There's an open issue somewhere on the Kubernetes repository asking to take swapping into account in terms of resource specification. However, the official advice (especially from Google) is to disable swapping completely: Once you get to the point where your applications swap, all bets are off performance-wise. Hence, it's usually better to know when an application runs out of (pure) memory than to let it go into the limbo state that swapping means. Thanks once more! 🎉 |
|
PR is out. ^ |
|
I guess this issue can be closed now 🎉 |
|
Hmm strange, the PR should have closed the issue but didn't. Oh well, closing myself then. |
Do you want to request a feature or report a bug?
Report a bug
What did you do?
I have been using the version 1.3.4 with kubernetes as an ingress controller and compression enabled.
The performance becomes very bad after 3 or 4 hours
What did you expect to see?
I expected the performance to remain the same .
What did you see instead?
requests take too long to respond. especially static resources like js files. The issue is gone when I restart the pod
Output of
traefik version: (What version of Traefik are you using?)1.3.4
What is your environment & configuration (arguments, toml, provider, platform, ...)?
The text was updated successfully, but these errors were encountered: