Create a Chart.js using TablePress as data source for WordPress

This plugin code base and idea is a modification of TablePress Extension: Chartist.
Prerequisite: The TablePress plugin
- Download and extract the ZIP file.
- Upload the folder "tablepress_chartjs" to the "wp-content/plugins/" directory of your WordPress installation, e.g. via FTP.
- Activate the plugin "TablePress Extension: Chart.js" on the "Plugins" screen of your WordPress Dashboard.
Use the Shortcode [tp-chartjs id=N /]
Example:
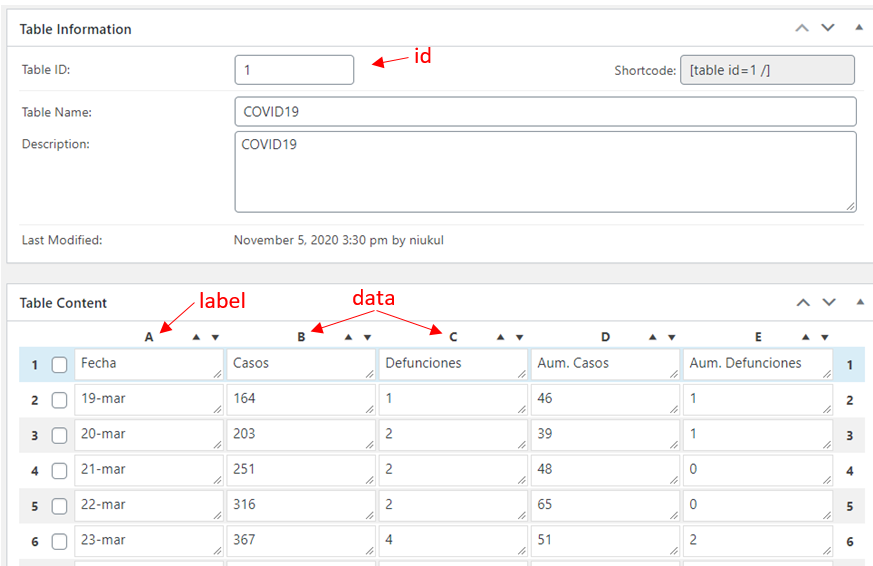
[tp-chartjs id=1 label=A data=B,C/]
To create a chart from the TablePress ID 1 where label are column A, and dataset points are columns B and C.
Result:

TablePress ID reference
- Example:
[tp-chartjs id=1/] - Value: Integer
id - Required
Chart type used
- Example:
[tp-chartjs id=1 label=A data=B,C chart=line/] - Values: Select one of this
line: Verticalbar: Vertical Barsbar: Stacked Vertical Barhbar: Horizontal Barhsbar: Horizontal Stacked Bar
- Default:
line
Column Axis label
- Example:
[tp-chartjs id=1 label=A data=B,C/] - Value: One character from TablePress columns [A-Z]
- Default:
A
Column(s) datasets used to populate chart
- Example:
[tp-chartjs id=1 label=A data=B,C,D,E/] - Values: One or more comma separated columns character [A-Z]
- Default:
B
The colors you can use in populated lines or bars.
- Example:
[tp-chartjs id=1 label=A data=B,C color=blue,red/] - Values: One or more comma separated colors
blueredorangeyellowgreenpurplegreyblack
- Default:
blue,red,orange,yellow,green,purple,grey,black
On example column B draws blue and column C draws red
Declare height of canvas HTML object
- Example:
[tp-chartjs id=1 label=A data=B,C height=300/] - Values: Integer value transformed into pixels
- Default: Automatic
Declare that only use the first {n} rows of data
- Example:
[tp-chartjs id=1 label=A data=B,C first=10/] - Value: Integer value offset
- Default: All data
Declare that only use the last {n} rows of data
- Example:
[tp-chartjs id=1 label=A data=B,C last=10/] - Values: Integer value offset
- Default: All data
If you like my work, please donate.

- Chart Title
- Vertical Bar chart support
- Pie chart support
- Stacked chart support
- Order data
- Detect Mobile devices
- Title of Chart show or not
- Modern Dark Theme
- Muriz Serifovic for creating TablePress Extension: Chartist.
- Tobias Bäthge for creating TablePress
- Alejandro García DevelopArts