Skip to content
New issue

Have a question about this project? Sign up for a free GitHub account to open an issue and contact its maintainers and the community.

By clicking “Sign up for GitHub”, you agree to our terms of service and privacy statement. We’ll occasionally send you account related emails.

Already on GitHub? Sign in to your account

Use ranged filtered markers in marker chart #865

Closed

Conversation

gregtatum
Copy link
Member

This profile has a large amount of markers and is slow on rendering the marker chart. I switched it to use the getRangeSelectionFilteredTracingMarkers and things got fast again. The tests need fixing for this, so it's still WIP.

STR: Mouse over the markers in the marker chart.

Before:

[timing]    "markerChartCanvas render" took 3068ms to execute.
[timing]    "markerChartCanvas render" took 958ms to execute.
[timing]    "markerChartCanvas render" took 588ms to execute.
[timing]    "markerChartCanvas render" took 222ms to execute.
[timing]    "markerChartCanvas render" took 220ms to execute.
[timing]    "markerChartCanvas render" took 104ms to execute.
[timing]    "markerChartCanvas render" took 188ms to execute.
[timing]    "markerChartCanvas render" took 346ms to execute.

After:

[timing]    "markerChartCanvas render" took 12ms to execute.
[timing]    "markerChartCanvas render" took 10ms to execute.
[timing]    "markerChartCanvas render" took 8ms to execute.
[timing]    "markerChartCanvas render" took 4ms to execute.
[timing]    "markerChartCanvas render" took 6ms to execute.
[timing]    "markerChartCanvas render" took 10ms to execute.
[timing]    "markerChartCanvas render" took 6ms to execute.
[timing]    "markerChartCanvas render" took 8ms to execute.
[timing]    "markerChartCanvas render" took 6ms to execute.
[timing]    "markerChartCanvas render" took 8ms to execute.
[timing]    "markerChartCanvas render" took 6ms to execute.
[timing]    "markerChartCanvas render" took 8ms to execute.```

const getMarkerTiming = createSelector(
getRangeSelectionFilteredTracingMarkers,
MarkerTiming.getMarkerTiming
);
Copy link
Contributor

Choose a reason for hiding this comment

The reason will be displayed to describe this comment to others. Learn more.

I believe this is the important change: we loop over marker timings in the chart. Even if we don't draw all of them, if we have a lot of markers merely looping through them can be costly.

The obvious drawback is that we'll have to regenerate the marker timings at each range change. I'd like that you measure the effect of changing the range on this. Maybe it's less costly to filter the marker timings using the range, rather than rebuild the marker timings from the markers filtered with the range (if you follow me). But I really don't know so we need to measure.

Copy link
Contributor

Choose a reason for hiding this comment

The reason will be displayed to describe this comment to others. Learn more.

But for sure this is better to do this filtering here, in memoized selectors, rather than do it again and again in the react component.

@codecov
Copy link

codecov bot commented May 29, 2018

Codecov Report

Merging #865 into master will increase coverage by 0.04%.
The diff coverage is 100%.

Impacted file tree graph

@@            Coverage Diff             @@
##           master     #865      +/-   ##
==========================================
+ Coverage   70.89%   70.94%   +0.04%     
==========================================
  Files         141      141              
  Lines        8325     8325              
  Branches     1895     1895              
==========================================
+ Hits         5902     5906       +4     
+ Misses       2140     2137       -3     
+ Partials      283      282       -1
Impacted Files Coverage Δ
src/reducers/profile-view.js 94.04% <100%> (ø) ⬆️
src/components/marker-chart/index.js 88.23% <100%> (ø) ⬆️
src/test/fixtures/profiles/make-profile.js 98.56% <100%> (ø) ⬆️
src/profile-logic/profile-data.js 76.47% <0%> (-0.19%) ⬇️
src/components/marker-table/index.js 76.56% <0%> (+7.81%) ⬆️

Continue to review full report at Codecov.

Legend - Click here to learn more
Δ = absolute <relative> (impact), ø = not affected, ? = missing data
Powered by Codecov. Last update 568aa80...054bf0d. Read the comment docs.

@gregtatum gregtatum force-pushed the ranged-tracing-markers branch 2 times, most recently from 79cde94 to 48e3d2d Compare May 30, 2018 13:56
@gregtatum gregtatum changed the title [WIP] Use ranged filtered markers in marker chart Use ranged filtered markers in marker chart May 30, 2018
@gregtatum
Copy link
Member Author

@julienw This is ready for review. I added a test for it. I also don't think the perf of running the selectors is critical as it's not on a hot path, and doesn't feel slow when I use the tool. I didn't include a profile of that as you commented.

@gregtatum
Copy link
Member Author

@julienw looks like the ball is in your court on this one. I still need to rebase it.

@julienw
Copy link
Contributor

julienw commented Jul 13, 2018

Ah nice ! I don't remember why I missed it. I even feel like I looked at it already... anyway this is in my TODO now.

@julienw
Copy link
Contributor

julienw commented Jul 13, 2018

I'd like to look again at how this looks like after #1134 lands.

I think this is nice for the UI (less empty lines when we don't need them) but that it doesn't change much the performance as our performance in this chart is mainly driven by how much we draw to the canvas (which is what #1134 fixes in some situations, and what your patch was incidentally fixing).

@julienw
Copy link
Contributor

julienw commented Jul 16, 2018

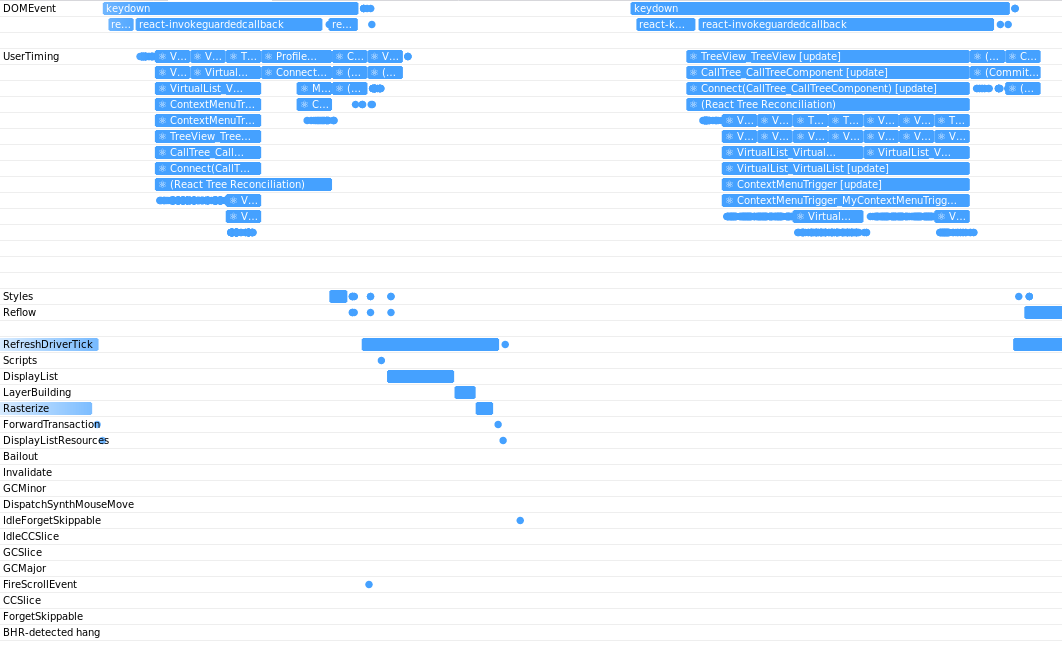
I took some measurements with #1134:

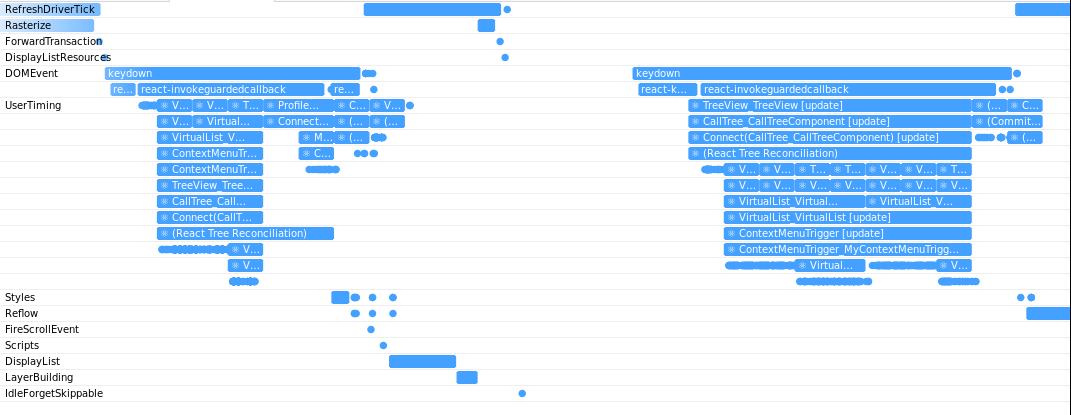
The main benefit without this patch is that the MarkerTimings need to be computed only once at load time. The downside is that we need to compute them for all markers even if we display a part of it.

And now with both #1134 and this patch:

  • Loading the profile: https://perfht.ml/2LlyxoO
    getMarkerTiming is now nearly absent, which was expected.
  • Hovering some markers to display their tooltips: https://perfht.ml/2LhF6Mo
    We definitely see that drawMarkers is a lot less visible
  • Selecting a range: https://perfht.ml/2LpSVFl
    Same here.
  • Moving back from 6ms to 2.7sec: https://perfht.ml/2Lk4PRm
    I'm very surprised that drawOneMarker is much more visible. I retried this scenario several times, with and without the patch, but this is pretty consistent. This is as if we're drawing twice as much, but I don't see how this is possible... (unless I screwed up my rebase in some way ?)
  • Moving back from 6ms to full range: https://perfht.ml/2LjbhYD
    We see the same thing happening. Also obviously getMarkerTiming needs to be recomputed, which takes time in this case. But if we can fix the issue with drawOneMarker I think this is acceptable.
  • Moving from full range to 6ms: https://perfht.ml/2uE8vGn
    This one looks worse too, but I think this isn't significant.

When using it for real there doesn't seem to be very different performance characteristics with this PR. Although I'd like to understand why drawOneMarker is called more (?) for some scenarios, maybe there is something (else) fishy happening here.

UX difference

In terms of UX I prefer the behavior with this patch. Compare without the patch:
Lots of empty lines

with the patch:
no empty lines !

So I find the second behavior much cleaner.

This was referenced Aug 20, 2018
@gregtatum
Copy link
Member Author

Closing in favor of #1216.

Sign up for free to join this conversation on GitHub. Already have an account? Sign in to comment
Labels
None yet
Projects
None yet
Development

Successfully merging this pull request may close these issues.

None yet

2 participants