Panel Measure
The panel under the icon shows options for ROIs measurements and volume extraction:

At the center, this panel contains a list of ROIs (it is synchronized/the same as the list at the Panel Tracing).
All measurements will be performed using the intensity taken only from the channel selected at the Measure box.
If there is a clipping applied to the dataset, intensity outside of visible volume will be equal to zero.
Button "Measure" measures only selected ROI, while "Measure All" works with all ROIs in the list.
The measured parameters are specified in the settings (see below).
This subpanel provides extra methods for measurements and volume extraction.
The button calculates intensity profile along a curve-like ROI (Polyline3D and LineTrace3D). The curve is sampled with a step equal to the minimum voxel dimension, so it depends on ROI Shape interpolation. At each step the average intensity of a circle in a normal plane is calculated. The circle's radius is equal to 0.5*floor(Line thickness). See below for multiple ROI measurements at once.
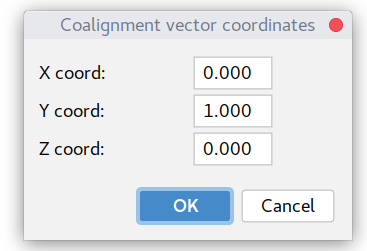
The calculates the "coalignment" of the curve's tangent vectors with a provided reference "orientation" vector. Upon clicking the button in the following dialog one can specify the reference 3D vector:
The vector does not have to be normalized, the plugin will do it.
Again, the curve is sampled with a step equal to the minimum voxel dimension, so it depends on ROI Shape interpolation.
The tangent vector at each step is calculated using piece-wise linear interpolation for Voxel and Smooth modes and using spline derivative for Spline (so is more precise).
The "coalignment" value is basically a cosine between reference and tangent vectors (dot product with normalized vectors). I.e. it is equal to 1 when vectors coalign, 0 if they are perpendicular, and -1 if they are opposite. So the absolute value of this measurement often makes more sense, because it does not depend on the curve direction.
This toggle button specifies the output of two previous methods:
- In the
"Make plot, press for file export" a single ROI's intensity profile/coalignment plot will be shown.
- In the
"Export to file, press for plot" mode all ROIs would be measured and saved in the csv file. In this case, in addition to intensity/coalignment values, the plugin will output XYZ coordinated of measured position.
This button extracts a bounding box around the ROI. I.e. it outputs the minimal volume of the dataset that includes the whole ROI. The settings dialog allows to expand or shrink this box by a defined number of pixels.
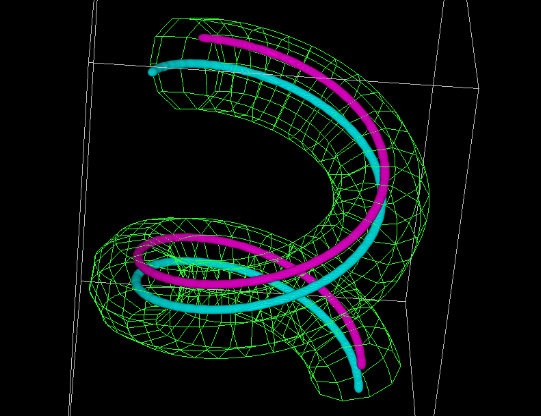
This button works only with curve-like ROIs (Polyline3D and LineTrace3D).
It allows to "straighten" the volume intensity data along the curve by using rotation minimizing frame (RMF).
For the general RMF intro, check this link, for the academic review, see this one, and for details of the specific plugin implementation, the end of Settings chapter below.
The curve is sampled with a step equal to the minimum voxel dimension and the output volume has the same isotropic voxel size.
This method depends on ROI Shape Interpolation (Spline mode recommended) and on the mode of Intensity Interpolation (see below in Settings section).
In the method's dialog window, it is possible to specify axes order or output preferences.
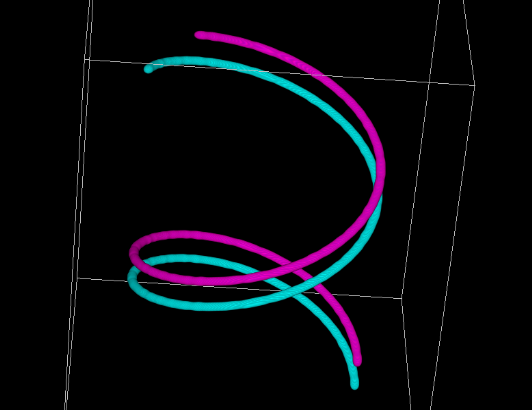
Here is a toy dataset example of two spirals with a shift along the main axis:
The cyan curve was traced using Semi auto tracing:
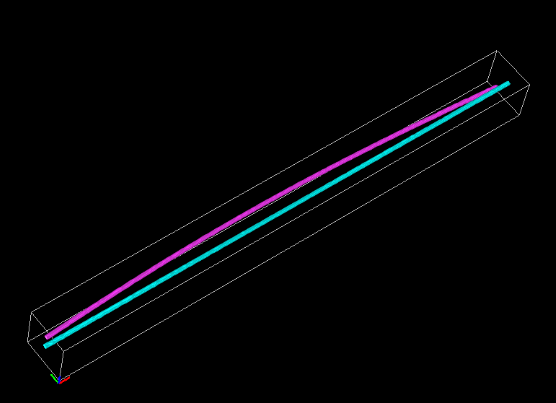
The result of "straighten" operation:
This button works only with a cross-section ROI.
It produces two new datasets obtained by splitting the original along the selected cross-section ROI. In a dialog one can choose if the size of these two new will be "As original" (and missing part padded with zeros) or "Tight crop" (shrink the size to include sliced part).
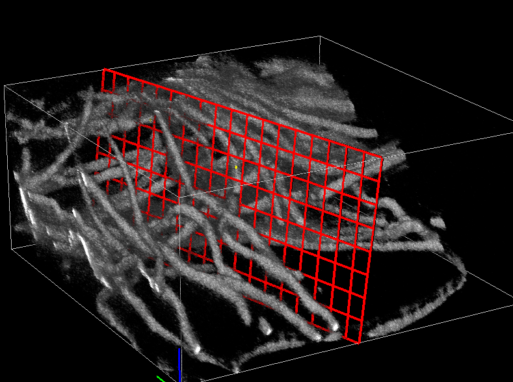
Here is an example volume with a cross-section plane ROI before splitting:
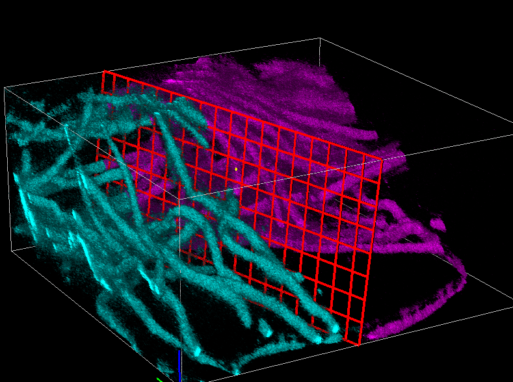
And here it is after, two obtained dataset merged together and colorcoded:
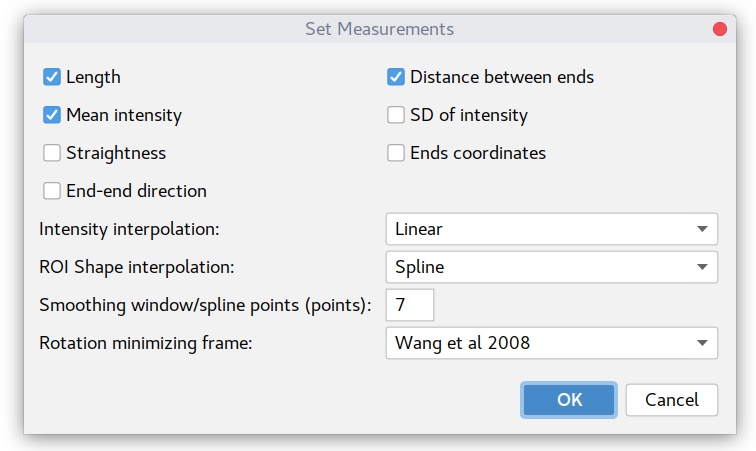
This dialog under the 
All current intensity measurements (including plot profiles) take into account curve ROIs "Line thickness" specified in the ROI properties.
Measurements results depend on selected ROI Shape Interpolation.
NB: 32-bit images are rescaled to 16-bit using their min and max values.
Curve-like ROIs are sampled along their length using a step equal to the minimum voxel dimension.
Again intensity measurements will be performed using the intensity taken only from the channel selected at the Measure box.
All coordinates/distances/lengths are measured in provided space units.
- Length - ROI length (depends on ROI Shape interpolation);
- Distance between ends - the distance between endpoints of a curve;
-
Mean intensity - average intensity along ROI (for curves depends on both Shape and Intensity interpolation).
- For Point3D ROI calculated among voxels inside the sphere of Point size diameter.
- For curve-like ROIs first an average intensity of a circle in the normal plane is calculated at each sampling step (see more here). The circle's radius is equal to 0.5*floor(Line thickness). Then the mean of these values is reported.
- SD intensity - standard deviation of the intensity along a ROI. For point ROI it is an SD of voxels inside the sphere. For the curve-like ROIs it is SD of average values in normal planes;
- Straightness - the ratio of the distance between endpoints to total curve length (depends on ROI Shape interpolation);
- Ends coordinates - XYZ coordinates of curve's endpoints in space units;
- End-end direction - normalized vector (length equals one) of vector difference between endpoints;
Intensity interpolation parameter specifies the interpolation scheme for points outside of voxels' centers. There are three options, listed below by increasing the precision and decreasing speed:
This setting will affect intensity measurements and "straighten" results.
Roi Shape Interpolation parameter provides a choice between Voxel coarse-grained, Smooth or Spline ROI shape models (last two are controlled by the smoothing window parameter below). These settings control both the appearance and measurements of ROIs and are synchronized with the same values in the Tracing tab/ROI Render settings. For implementation details, refer to the ROI shape interpolation page.
Smoothing window/spline points (points) is the same synchronized parameter as in ROI render. It defines a window for smoothing of line traces (LineTrace3D) in Smooth mode and positioning of nodes for the spline fitting (in a Spline mode). In short, the larger the value, the more smooth the trace will be. See link above for more details on the procedure.
Rotation minimizing frame this parameter specifies how the 3D pipe backbone is built along a curve-like ROI. The curve itself defines only a tangent vector at each point, but to build a consistent set of pipe contours around each point, one needs to define a perpendicular plane with normal and binormal vectors. The rotation of normal vectors in adjacent planes expected be minimal. In the current implementation this requirement is achieved by either using the method described in this Wang et al 2008 paper or using approach suggested at StackExchange discussion.
Curve-like ROIs render depends on this parameter and it is auto-updated to illustrate differences (usually pretty small between the two methods). It is used in the straighten method to sample intensity values at the normal planes along the curve.