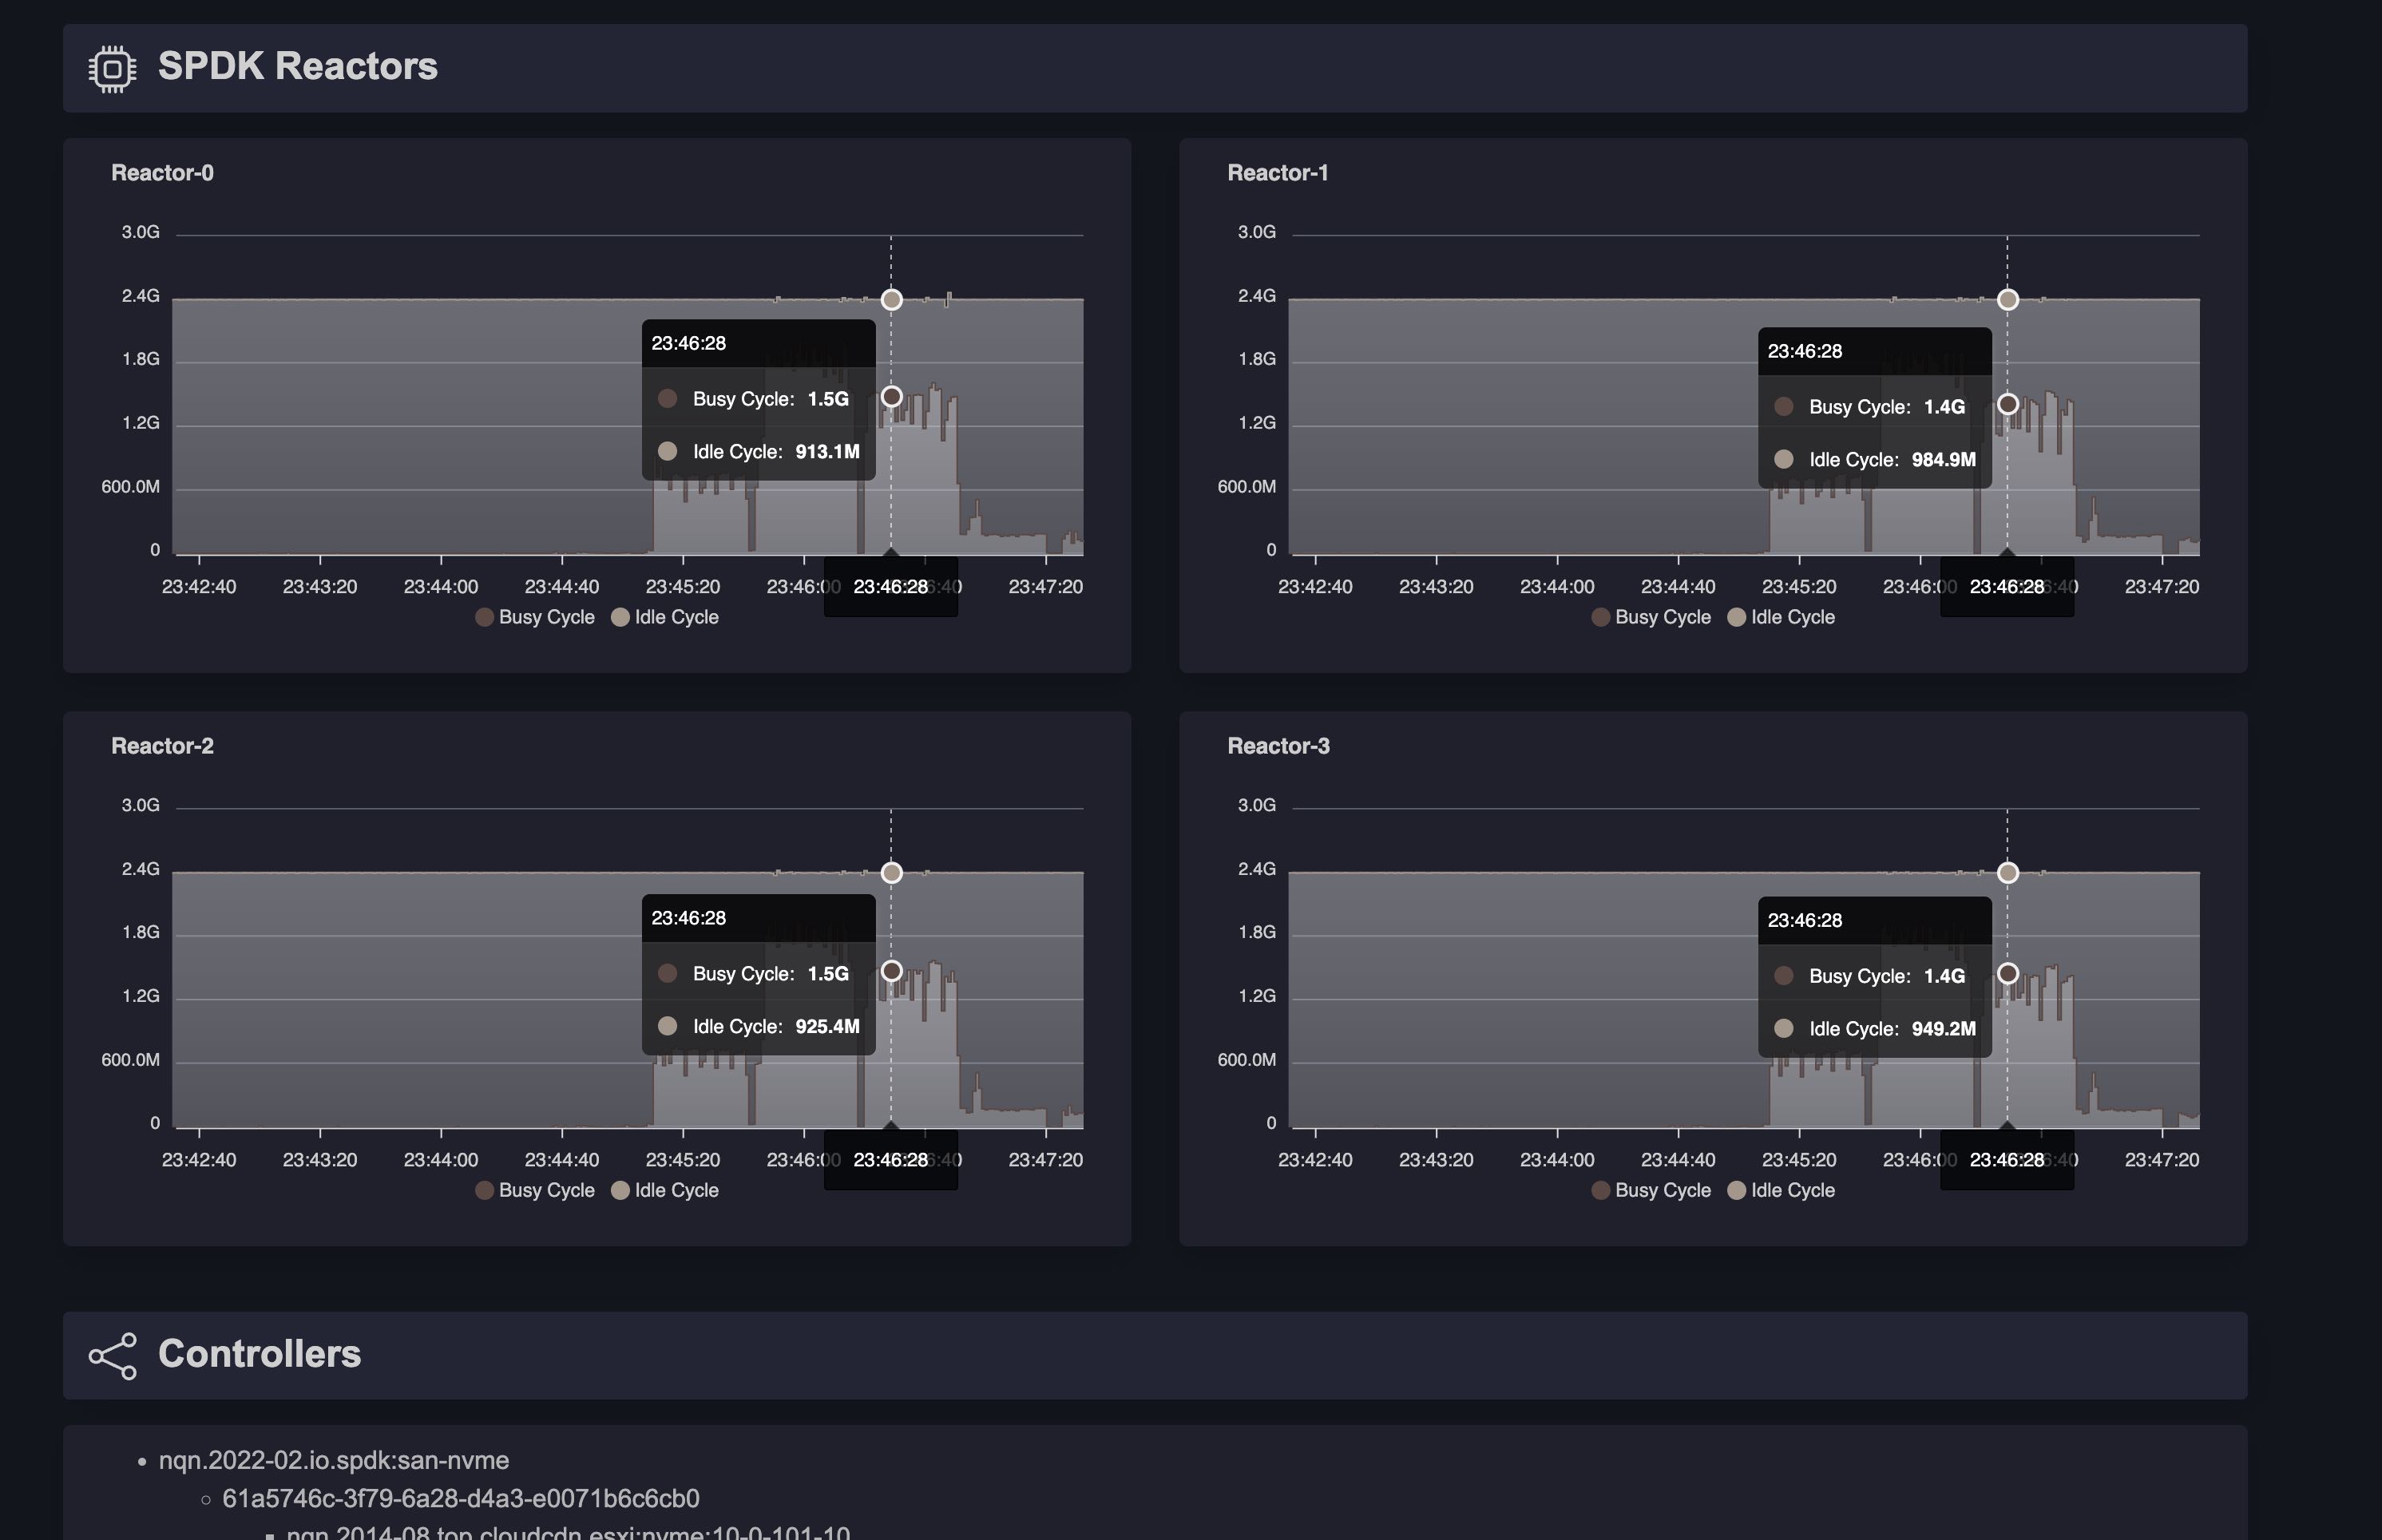
A fancy realtime dashboard for SPDK (Storage Performance Development Kit) storage metrics.
The charts in dashboard updates every second, giving you realtime monitoring experience.
- Include a fancy dark-mode web interface
- Realtime update
- Nearly ZERO impact on SPDK performance. Actually, we don't pull any metrics from SPDK if no one is watching the dashboard, and there's only one instance of fetcher will be executed even if there're 1000 browser window opened.
- Easy-peasy deployment. It just works out-of-the-box.
Please donate the project by simply clicking the ♡ button on the top-right of the page. I like stars, it makes the project meaningful.

The following metrics/statistics are included:
- Read bytes per second
- Write bytes per second
- IO per second
- Latency ticks
- Busy ticks per second
- Idle ticks per second
- All controllers that connected to the SPDK instance
There's a build.sh in the repo root. It's a simple bash script, please check it out for details.
ONLY A SINGLE binary is required to deploy this SPDK dashboard. Please either:
- Build the binary yourself
- Or download the pre-built binary from release page
And put the binary to wherever your SPDK storage server is running. All good to go.
Execute the spdk_dashboard, the application will (by default):
- Listen 0.0.0.0:8000, so you should be able to open the WebUI dashboard on port 8000
- Fetch metrics from backend SPDK RPC
/var/tmp/spdk.sock. This should be the default unix socket that SPDK listen to
If the web dashboard gets stuck at loading page, you should be able to see some error logs from output of spdk_dashboard.
root@spdk-server:/tmp# ./spdk_dashboard -h
=====================
SPDK Dashboard Server
* Check out https://github.com/fangli/spdk-dashboard for details.
* MIT Licensed
=====================
Usage of ./spdk_dashboard:
  -http-listen string
        Which address and port should we listen to? This must be [address:port] (default "0.0.0.0:8000")
  -spdk-rpc string
        The SPDK RPC server. For example: /var/tmp/spdk.sock for unix socket, 127.0.0.1:1234 for TCP. (default "/var/tmp/spdk.sock")
- This is not a serious project for all purposes. I created it for my homelab.
- Unfortunately, I won't be able to work on ANY new features-_-, Please don't submit issues about requesting new features.
- If you have any CRs for new features or fixes, very welcome!
- If you find any issues or malfunction, also feel free to create issues. I'll troubleshoot and fix if possible.
This dashboard is under MIT license. this dashboard is based on many other fancy projects like:
- Charting: https://github.com/apexcharts/apexcharts.js
- Basic UI: Bootstrap 4
- etc