[Impeller] CPU overhead of many small canvas operations is surprisingly high. #138004
Comments
|
Interestingly, of the polyline generation code, 95% of this is due to the allocation of the Quadradic path segments that are generated from a Circle. It may be faster to make Polyline generation two pass: 1. to compute how much space to allocate and 2. to actually perform the allocation. |
The algorithm we're using is amenable to quickly calculating how much storage we'd need. |
|
From some quick investigation: even if we create the Path on the UI thread when recording the display list, the current dispatch mechanics require us to copy it, to keep both the display list + entities code valid. This copy ends up taking almost as much time as creating the path in the first place. |
Why is the copy on dispatch needed? Is the Path modified after it is delivered from the dispatcher? |
|
I have a patch that I'm cleaning up right now which reduces the allocations around polyline generation and shows some nice improvements for that. @flar - The problem is not strictly about copying but from conversion of an SkFoo to an impeller::Foo and the copying/allocation involved in that. Allocation on Android costs more than on iOS AFAICT and we're paying a larger penalty. |
I'm familiar with that issue, but I thought he was talking about creating an Impeller Path on the UI thread which would be delivered during dispatch and which would not require the Sk conversion...? |
|
This LineGeometry object reduces the raster cost of 10,000 drawLine calls by 1/3: flutter/engine#47846 |
This will simplify the Path internals cleanup that I'd like to land as a part of flutter/flutter#138004
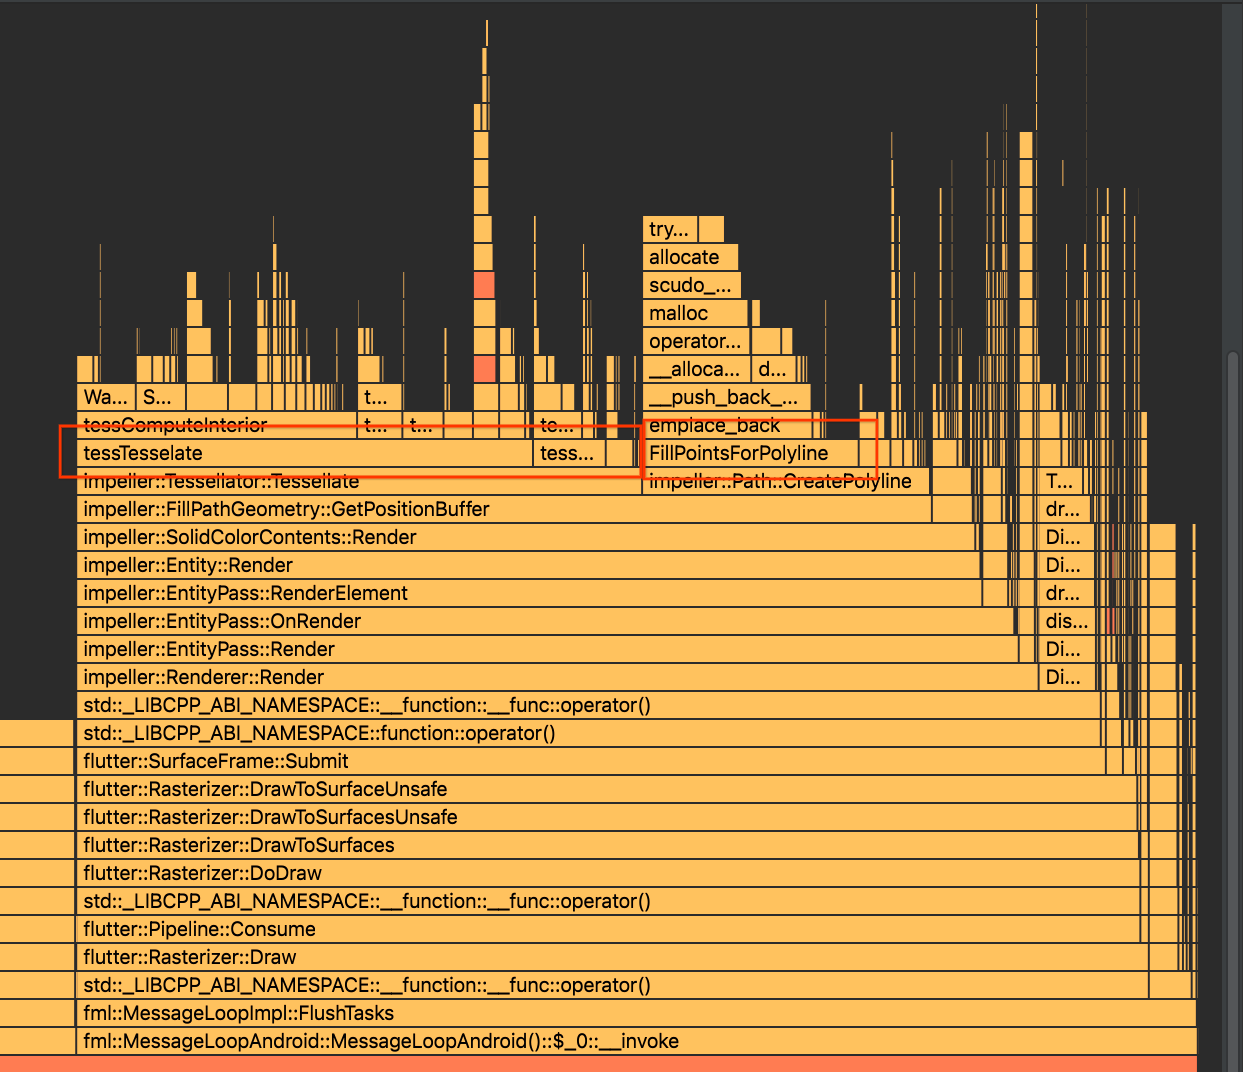
Before this patch, polyline generation did lots of small allocations over and over again.

Now, `Path::CreatePolyline` takes a `std::vector<Point>` that the caller can reserve such that it won't likely need to be resized. The tessellator has been updated to hold a thread_local point buffer that gets reused and avoids lots of intra-frame allocation. This improves the profiles seen in flutter/flutter#138004, specifically around the [`FillPointsForPolyline` time](https://user-images.githubusercontent.com/8975114/281116688-2d519d24-7838-405c-9e99-df5ceacf0917.png)

This very significantly improves the benchmarking data in geometry_benchmarks.

The first commit in this patch _slightly_ improves the benchmarks by reducing some allocations, but not enough of them.
…7846)

Impeller implements the DrawLine primitive as DrawPath on a path containing a single line. Benchmarks show that this can cost 30% overhead on apps that use a lot of DrawLine primitives. This PR creates a more direct Entity that can tesselate the geometry of a line directly.

The reduced overhead should help with flutter/flutter#138004

The current code will back off to Path rendering for round caps. When the circle geometry work is finished (#47845) we can come back and implement round caps using the code refactored in that PR.
Removes usage of index buffer and adds zig-zagging triangle strip. Could also be adapted emplace directly into host
buffer.

Benchmark is https://flutter-engine-perf.skia.org/e/?queries=test%3DBM_Convex_rrect_convex

Umbrella issue: flutter/flutter#138004
Path objects are expensive to allocate, create, move, et cetera because of the large number of internal heap allocations performed. This change combines the linear, quad, and cubic buffers into a single point buffer that stores all points/control points inline.

The existing component buffer stores the index to the first point in the buffer, and the type field determines how many points are read.

Benchmarked in https://flutter-engine-perf.skia.org/e/?queries=test%3DBM_Polyline_cubic_polyline%26test%3DBM_Polyline_quad_polyline&selected=commit%3D38035%26name%3D%252Cconfig%253Ddefault%252Ccpu_scaling_enabled%253Dfalse%252Cexecutable%253D_b_s_w_ir_cache_builder_src_out_host_release_geometry_benchmarks%252Clibrary_build_type%253Drelease%252Cmhz_per_cpu%253D2200%252Cnum_cpus%253D8%252Csub_result%253DTotalPointCount%252Ctest%253DBM_Polyline_quad_polyline%252Cunit%253Dns%252C

flutter/flutter#138004
|
I did a little audit on our memory allocation. Here are my notes about potential places that could benefit from using the stack or an arena allocator. I got these from just scrolling around in the flutter gallery app and seeing what was being allocated on iOS. |
|
Commands and Elements are the really big allocations, since its 1 per drawing command. if you look at a CPU profile from Android studio, those allocations (and deallocations) end up as huge chunks. Given that both are per-frame transient, some sort of arena/pooling allocator makes sense. |
|
Right now most rendering gets turned into a Path inside a FillGeometryPath. I'm working to put those into more efficient allocations with my work in direct tessellation of common primitives as in flutter/engine#48103 and flutter/engine#47846. At that point the Path-related allocations here might drop down the list a bit. |
|
Sounds good. At some point that will still benefit from an Arena. I think I'll focus on |
|
Where does DlRegion come from? It is used during platform views to consolidate and refine the list of overlaps with the platform view, but shouldn't be used otherwise. The DlTree search could probably be switched to an iterator concept when it is used for culling to avoid the allocation overhead. |
|
This is where I'm seeing it: |

Ah, yes, that code was added to transfer the fine-grained coverages of a DisplayList into any other DisplayList that renders it so that one of the embedders (Fuchsia? I don't remember where the need came from) could have more accurate coverage information. DrawDisplayList used to just accumulate the bounds of the child DL. This won't happen for Skia because regular Flutter rendering rarely has DLs embedded in other DLs and when we render the layer tree we are handing off everything directly to an SkCanvas via the SkCanvasAdapter. Impeller flattening the layer tree into a giant DL does cause this to happen because each DLLayer will call DrawDisplayList on the "frame DL" being built. If we do slicing of the layer tree for the case of a PlatformLayer detected by the preroll pass, then the embedders cause us to use DLBuilder objects to render the pieces rather than a DlCanvas(SkCanvas) adapter. But, Impeller always uses a DlBuilder object to render the tree (thus sort of "simulating" the PlatformLayer flow) and then dispatches it into an Impeller Canvas once it is complete. As a result it will see this overhead cost of drawing a DL into another DL on every frame even if the frame does not have a PlatformLayer in it. There are 2 ways to attack this:
|
|
This is likely one culprit. I'm not sure about all of the places that create a SurfaceFrame, but in Impeller's case this instance of DisplayListBuilder does not need to build an rtree and so this line should not be setting that argument to |
|
This was added here: flutter/engine#41606 |
Correct, but I think it was a (my) mistake. The important part of that PR is that Impeller's Dispatcher takes advantage of culling when it encounters a DrawDisplayList in the stream. However, that line is asking the Frame's DLBuilder to build an rtree, but the culling will never happen there because the layer tree already culls the tree when it renders it, so nothing will appear in that particular DL that will be trivially culled by the DL Dispatch culling. I don't think that request for producing an RTree on that particular line contributed to performance benefits of the original fix and it looks like it may actually be causing a performance drain. |
|
I'll double check the results of that PR against whether or not it needed that particular flag to be sure, but if the results stay the same (or get better?) then we can look at flipping it on ToT and see if it benefits any Impeller app benchmarks. |
|
I backed off my repos to the commits where the framework repo was just prior to the introduction of flutter/engine#41606 and the engine repo had that fix in it. I ran A/B comparisons of the platform view non-intersecting Impeller benchmark like that and then also when I edited The benefits of turning off this flag may be more pronounced with a smaller frame load that does not contain a lot of platform views, but the main point here is that turning off this flag will not hurt the original performance fix in which it appeared. A/B results without(A) and with(B) the Impeller culling fixA/B results without(A) and with(B) the Impeller culling fix + turning off RTrees on the SurfaceFrame |
|
Patching ToT to set the RTree flag to false and then running the (In doing this I discovered a noisy warning in the DL dispatch method that complains if a caller ever supplies a culling rect when the DL has no RTree. I silenced it for a quick test, but I think we should eliminate it. Callers who feel that an RTree is critical to their use case can do a DCHECK on It doesn't seem to hurt anything and I'm pretty sure the RTree is wasted for the |
|
I want to make sure I understand the situation here correctly:
So at a minimum we're attempting to cull each element twice? If the display list quick reject is roughly equivalent to the entity_pass quick reject we should remove the latter as its much slower. https://github.com/theyakka/qr.flutter/tree/master/example is a good example of an app with a lot of canvas operations. Though you should add something like an intederminate linear progress indicator ( |
I don't. My hope was that all of those things I listed could be moved over to an Arena which in aggregate would show a meaningful difference. I don't know how much tackling just one of them will help. I don't have any evidence to suggest that's worthwhile. It may be in some cases. I gave myself one day to try to get the Arena setup and I couldn't do it. If I did it again I'd use a thread-local allocator that clients would grab a references to in their constructors if they wanted it; to avoid all the messy plumbing. I also got stuck because the datatypes have to be trivially destructible. But for things like our glyphs, which are trivially destructible, they are stored in nested STL containers, like |
|
@gaaclarke the reason I mentioned you should hold off on the arena approach is because of the container/shared_ptr issue. In short, I wrote up go/impeller-confused-ownership which needs to be fixed first. Its worth pointing out that on the QR code app I linked the biggest Rtree block is from sorting not allocating, so arena allocation will not help |
|
@jonahwilliams thanks, checking it out. Estimating the performance difference with using an Arena is hard to estimate. There are knock on effects like making memory less fragmented, avoiding syscalls and avoiding destructors. So, I wouldn't just judge it based on what the profiler is attributing to allocation time. |
|
Getting rid of RTree in SurfaceFrame: flutter/engine#48422 |
|
The remaining work will be addressed in #142054 . Closing since we've identified most/all of the remaining work |
Consider the example app in: #127356. All of this overhead is raster CPU time, the GPU workloads are in the ~2ms range.
Below is an extraction of the main.dart
With ~200 something calls to canvas.drawLine and canvas.drawCircle, we reach the raster budget on a Pixel 6 Pro. Of this time, there are 3 main segments:
IF we look at a CPU profile, we can see a more detailed break down for this scene
Fun facts:
Problems
Visually this does not look to be a complex app. In fact, these are all essentially simple primitives that should be fast to draw. So what is the issue?
Solutions
Batching in theory should be possible at the dart:ui layer, so lets try rerunning this app with all drawLine calls combined into one path, and all circle calls combined into another. This will only draw two paths.
This is slightly faster, but not as much as you'd think. Notice that DL conversions and dtors get much faster, but geometry processing slows way down:
This can be seen more clearly in the CPU profile. With all circles combined into one path, we no longer recognize it as a convex shape and so we've fallen back to generic tessellation.
Lessons?
*Our current aiks/entity architecture doesn't work great when there are more than hundreds of drawing commands. We should consider adjust the Entity/Geometry structure to require less allocation, use arena allocators, batch, et cetera.
The text was updated successfully, but these errors were encountered: