Changes in Force.com IDE Beta Version 34.0.0.20150511
The 34.0.0.20150511 beta version of the Force.com IDE includes these new features.
- Select a specific test class or test method in the test run to be executed in the background
- Invoke auto-completion of system namespaces, types, and members
We’ve made changes to the way you enqueue and view the results of Apex tests. You can now select a specific test class or test method in the test run to be executed in the background. This prevents the user interface from being blocked due to a long test run.
Previously, you could right click a source and select Force.com > Run Tests. This option is no longer available.
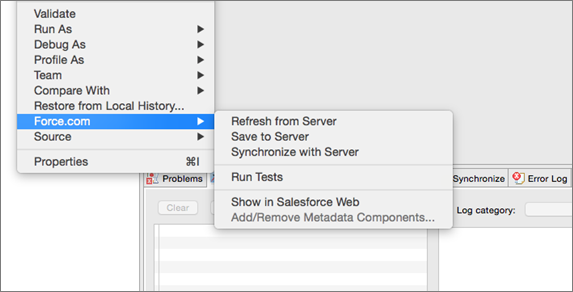
The entry point has been changed to Run Configurations. To access this entry point, expand Run ( ) and select Run Configurations.
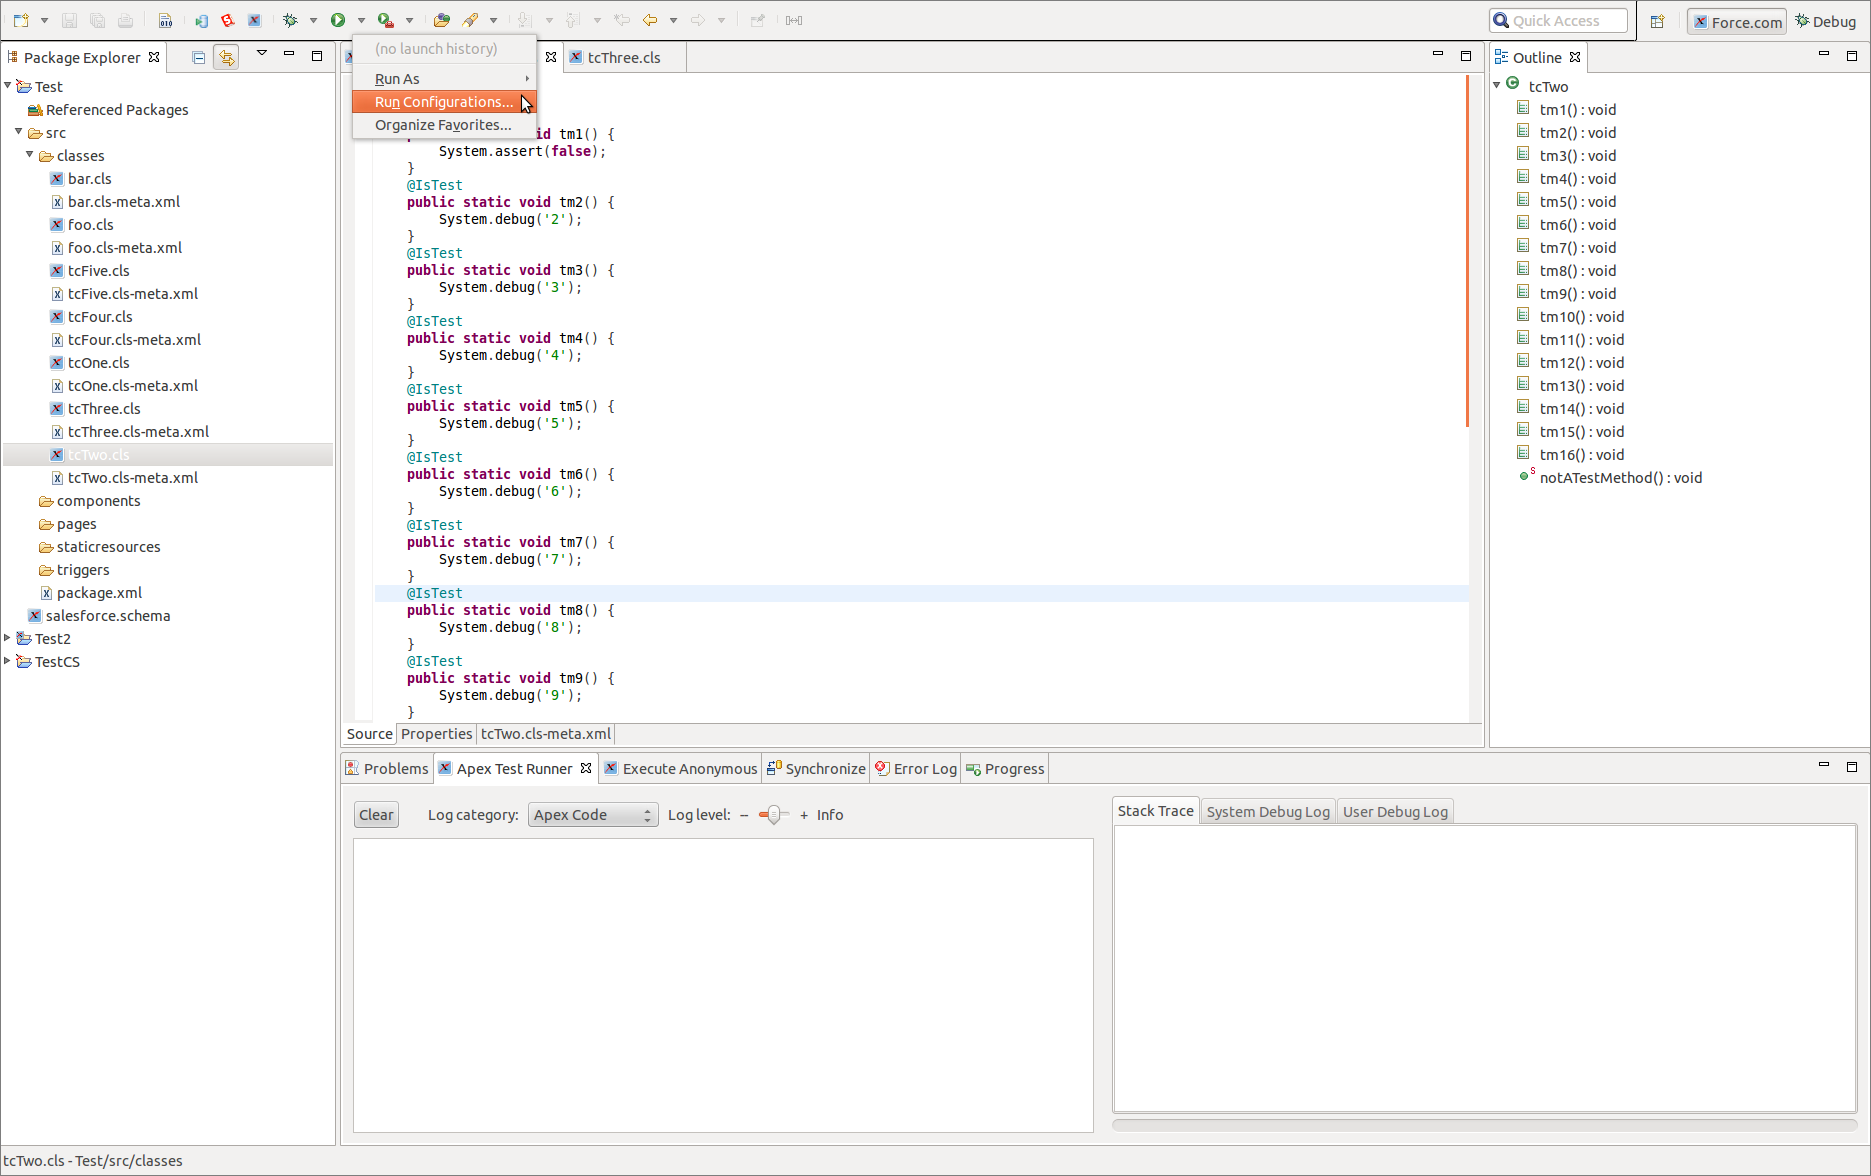
After navigating to Run Configurations, click Apex Test and then click New launch configuration ( ).
).
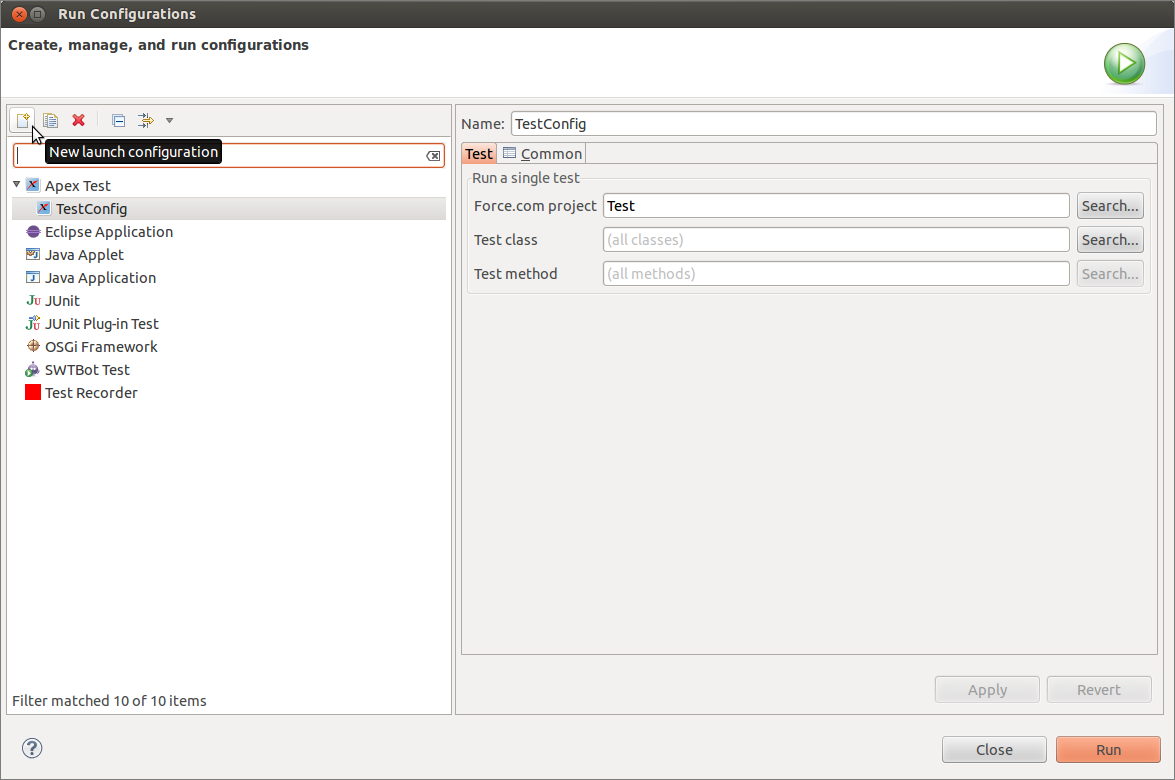
In this new launch configuration:
- Set the name of the configuration.
- Select a Force.com project.
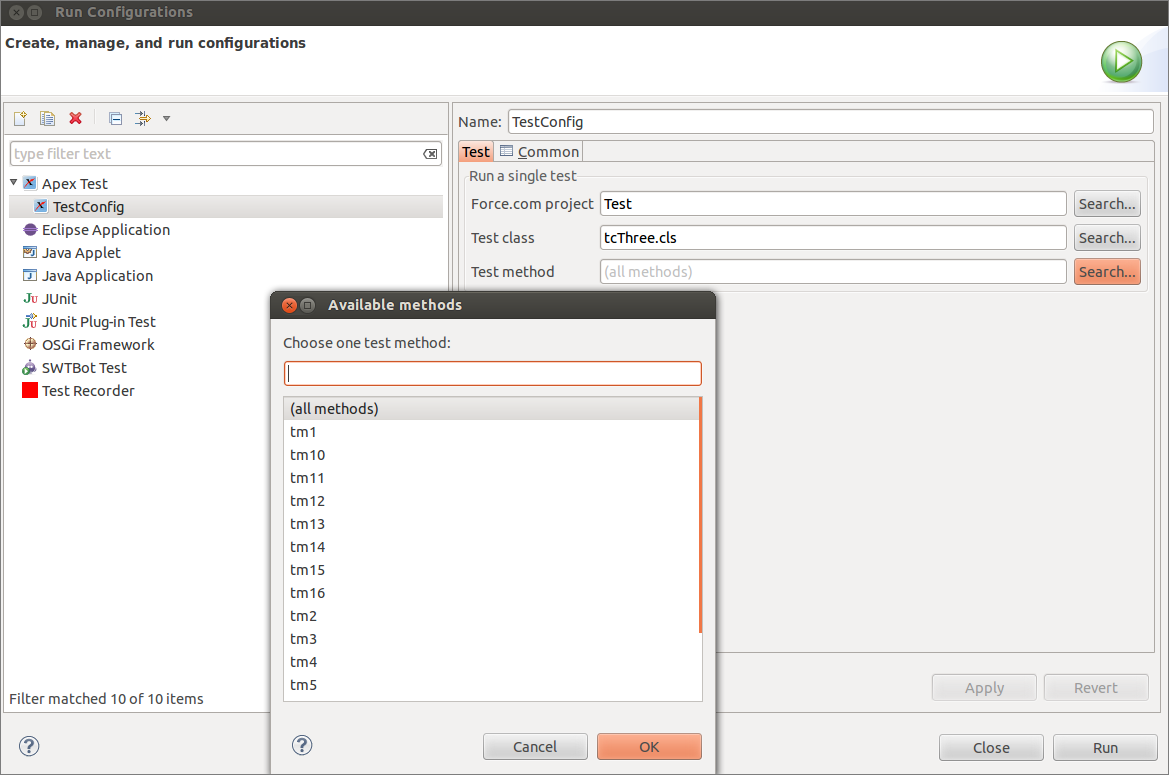
- Leave the test class as all classes or select a specific test class in the previously selected Force.com project.
- Leave the test method as all methods or select a specific test method in the previously selected test class.
These configurations allow one of these test run scenarios:
- Run all Apex test methods in all Apex test classes in a Force.com project.
- Run all Apex test methods in one Apex test class in a Force.com project.
- Run one Apex test method in one Apex test class in a Force.com project.
To save the launch configuration, click Apply. If you want to revert your launch configuration to the last saved state, click Revert. To execute the test run, click Run.
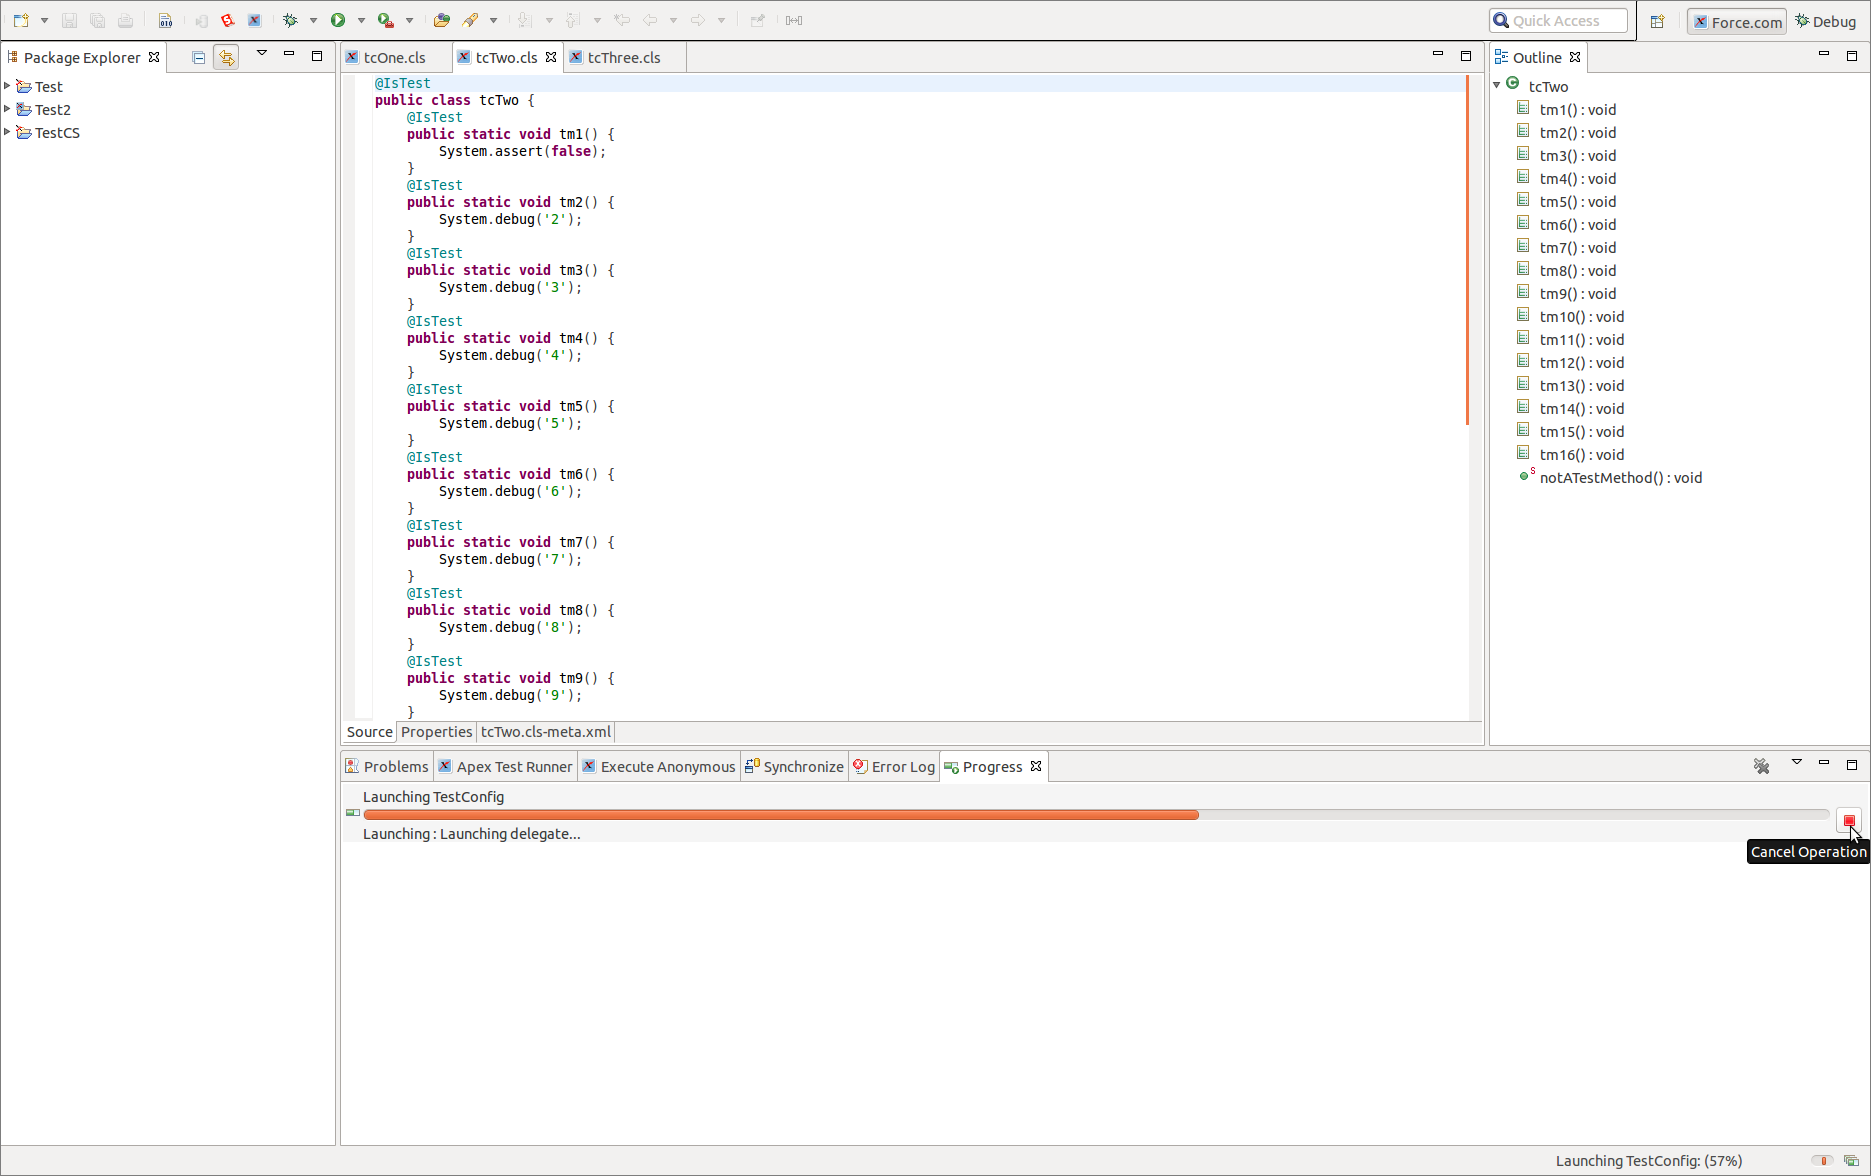
You can abort the test run by clicking the Cancel Operation button in the Progress view.
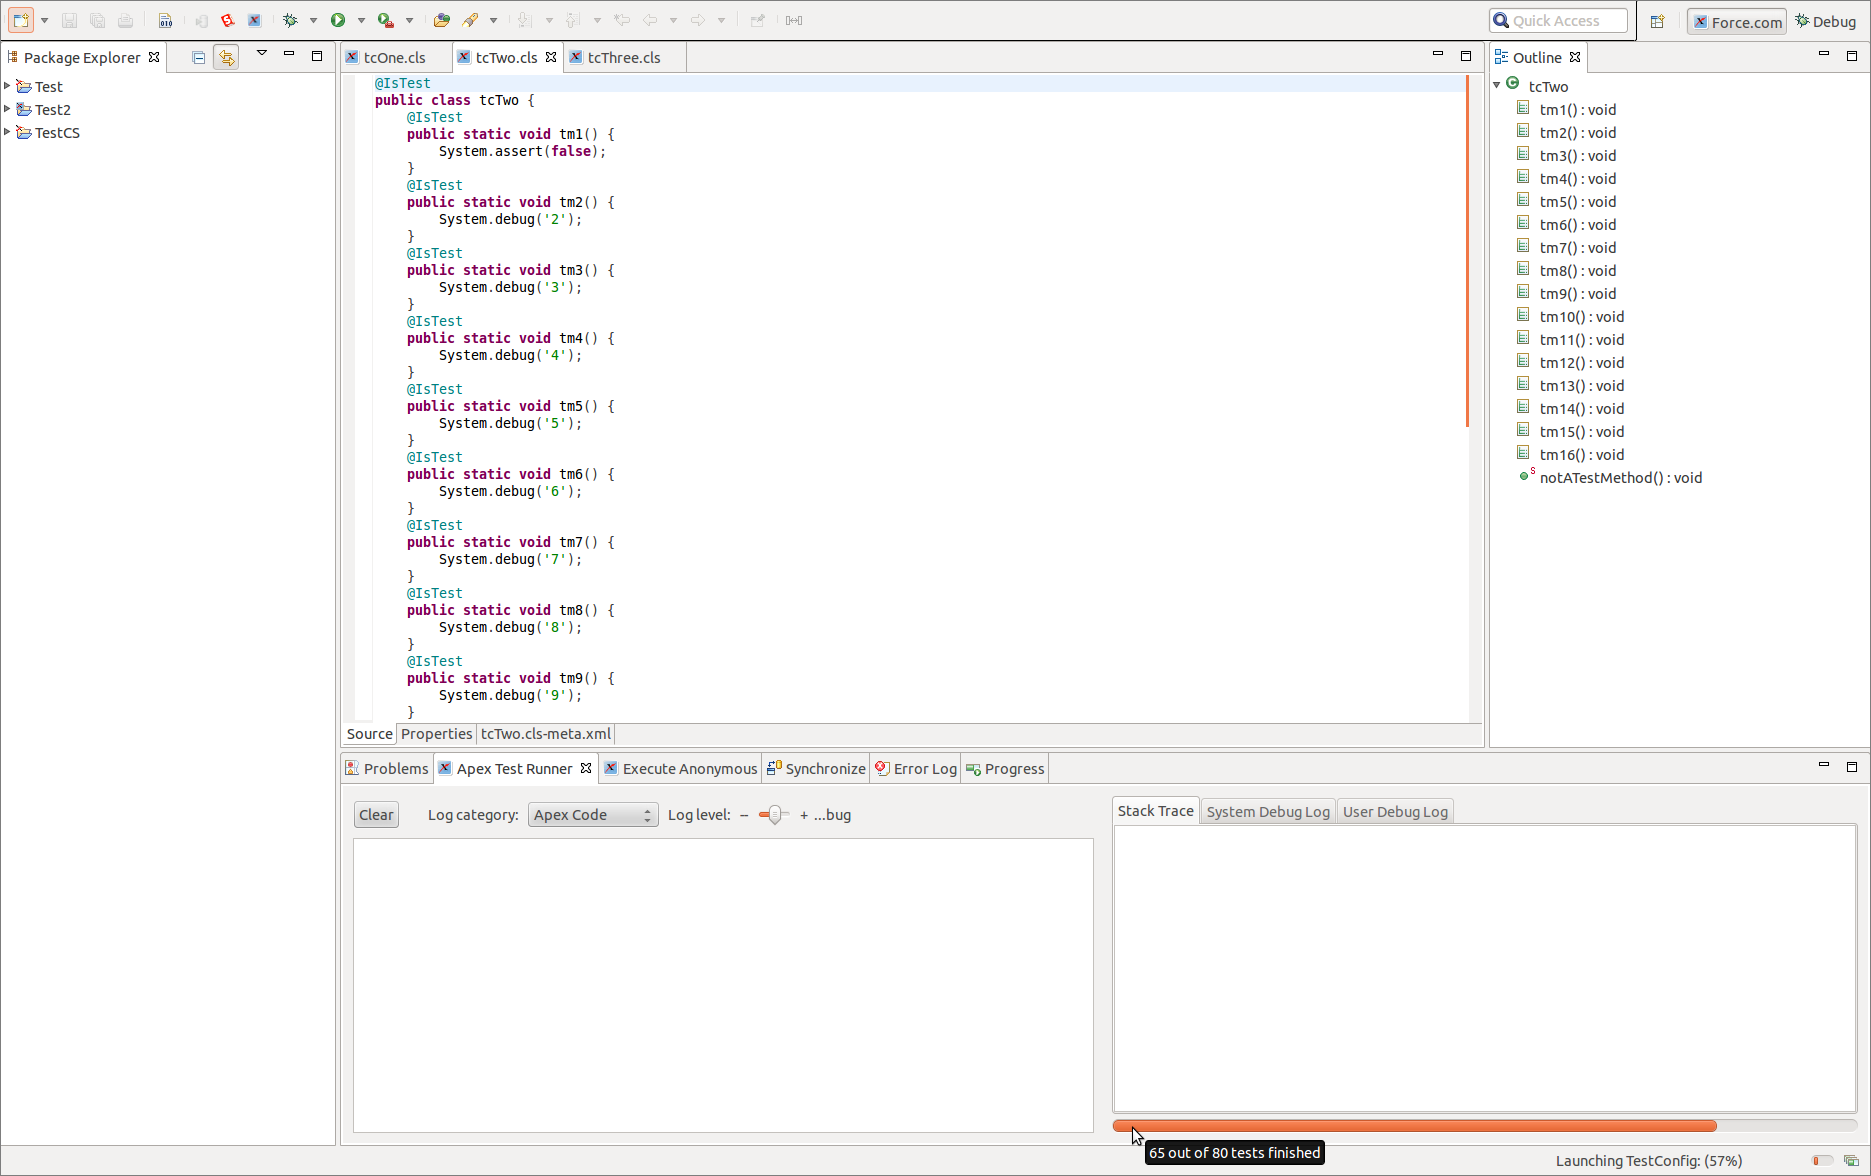
You can view the status of the test run at the bottom of the Apex Test Runner view. Hover your mouse over the status bar to view the numbers of finished and total tests.
When the test run has finished, you can view the test results in the Apex Test Runner view. This view is available in both the Force.com and Debug perspectives. On the left hand side of the Apex Test Runner view, you can clear the test results, analyze the test results tree, or set the logging category and level of a test run. The first level of the test results tree is the test classes. Within each test class are the test methods. Green indicates that all test methods passed. Red indicates that the test method, or at least one test method in that test class, failed. Yellow indicates that the test method, or at least one test method in that test class, was skipped or had a compilation failure. Test outcome is based on ApexTestResult object of Tooling API (see the Force.com Tooling API Developer's Guide). Selecting a test class or test method in the tree will open the source code of that Apex test and show the Stack Trace, System Debug Log, or User Debug Log.
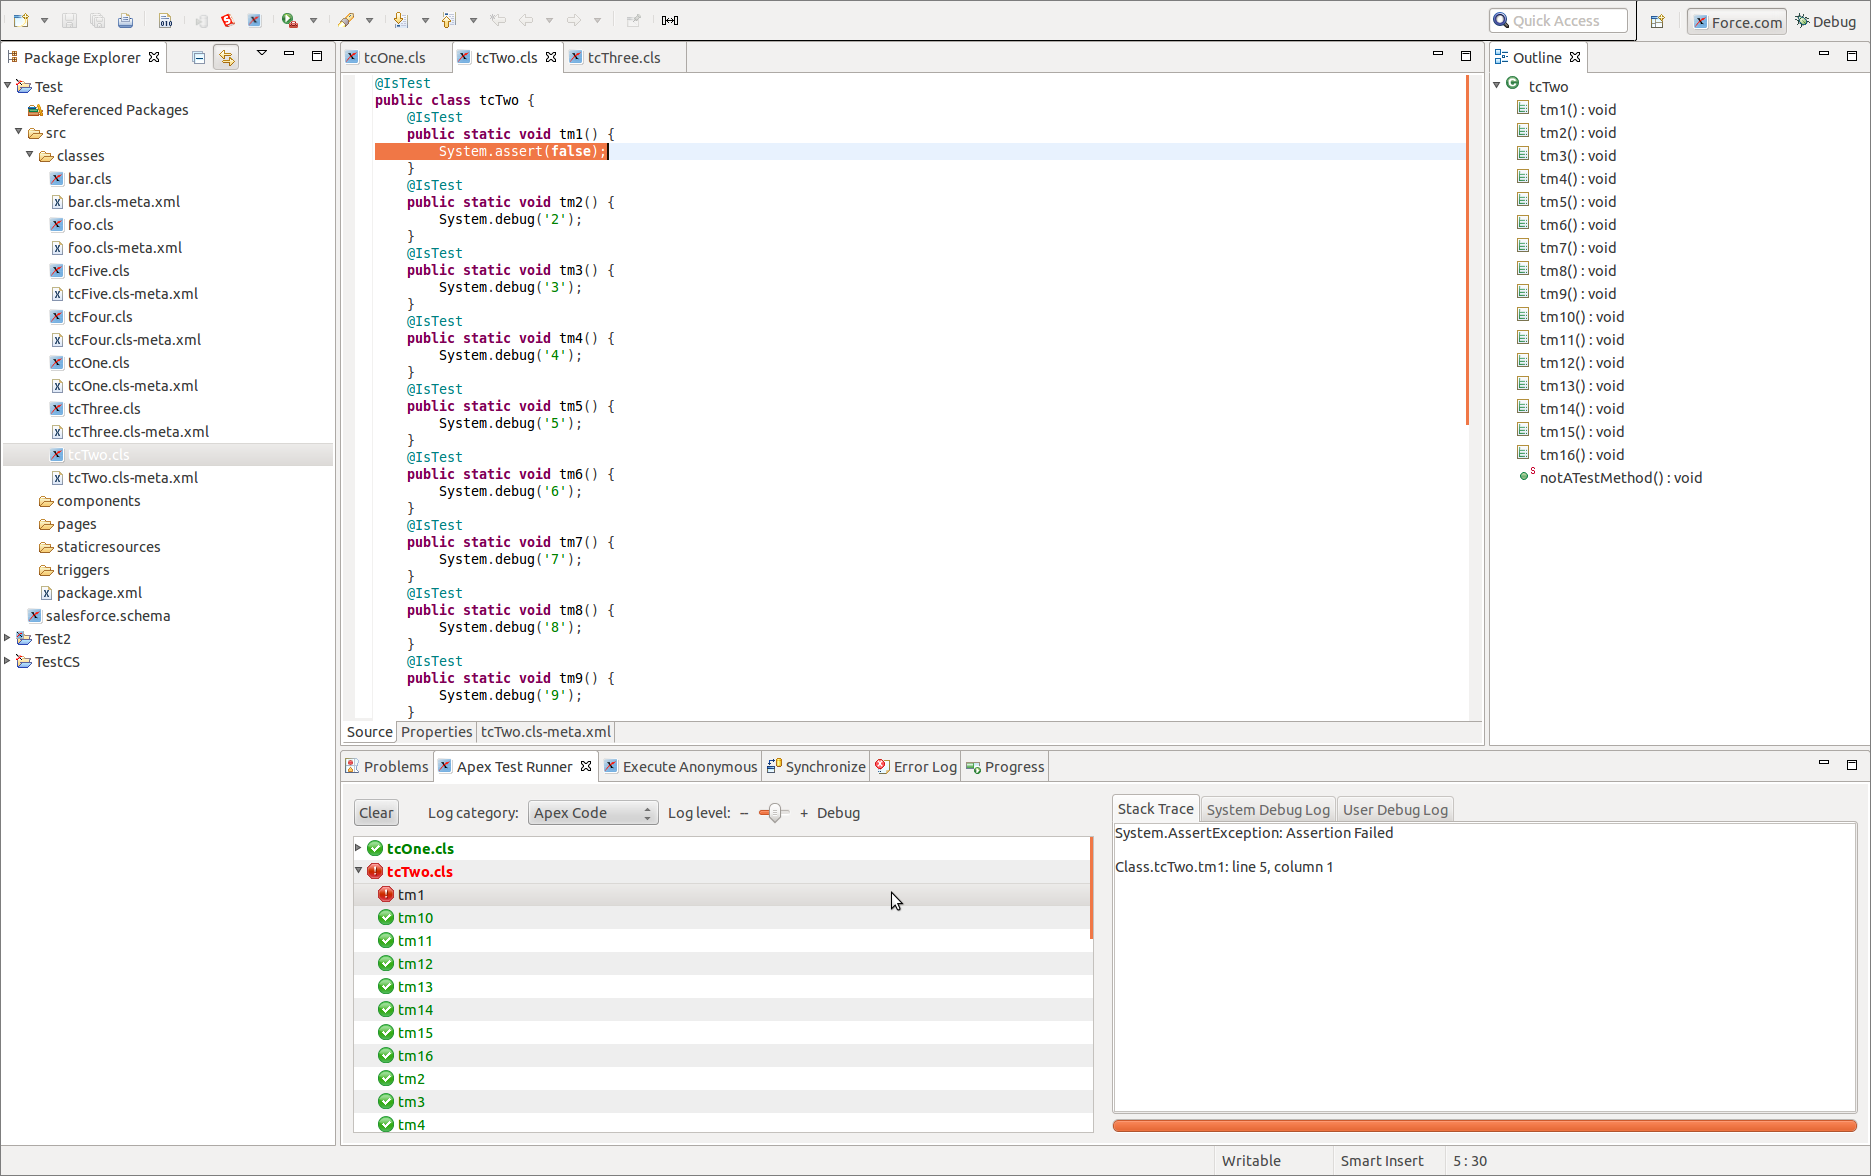
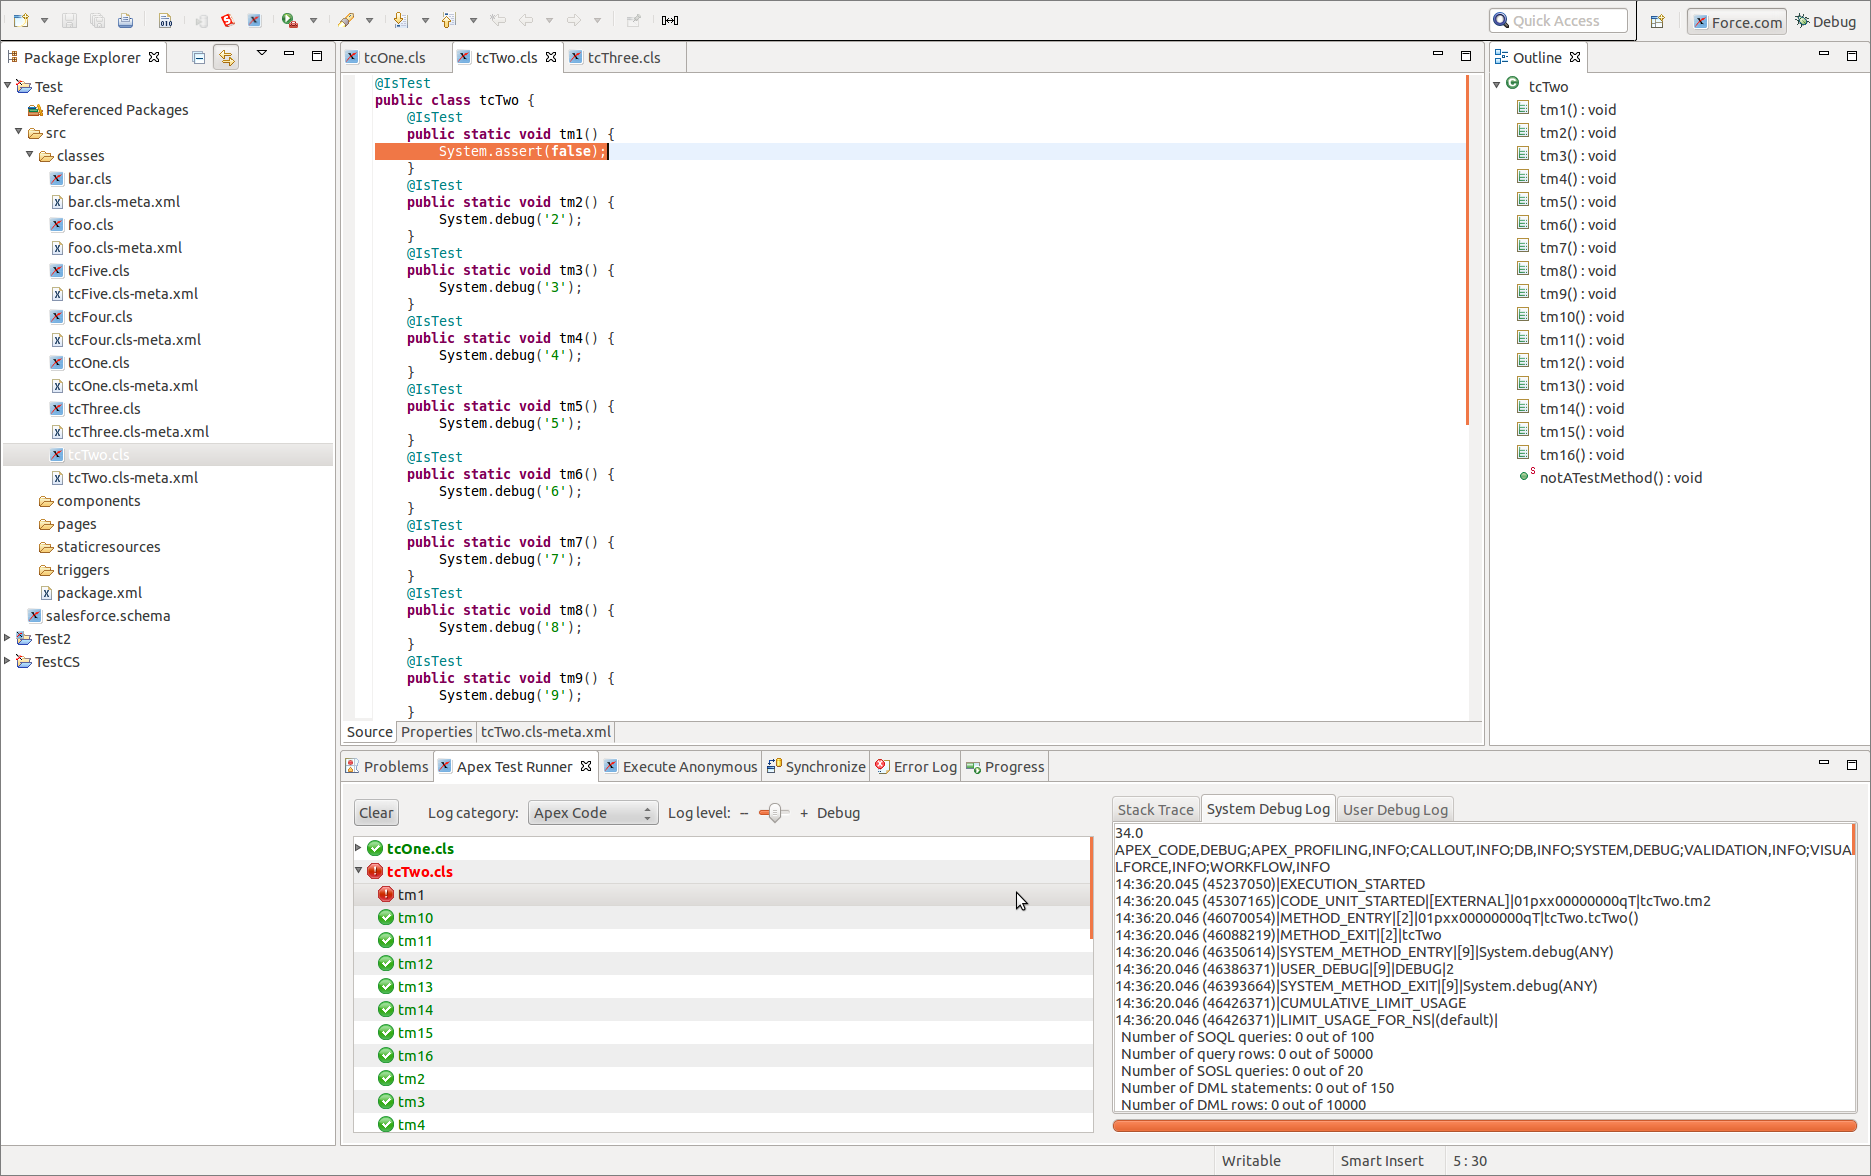
On the right hand side of Apex Test Runner view, you can select one of three tabs: Stack Trace, System Debug Log, or User Debug Log. If a test method had an issue during execution and a stack trace was produced, it will be shown in the Stack Trace tab. If Apex Log was enabled for that test run, the log will be shown in the System Debug Log tab. Additionally, if there were System.debug statements in the log, they will be shown in the User Debug Log tab. There must be a test method selected in the test results tree for any of those three tabs to display values.
To re-run the tests with the same configuration, expand Run and select the shortcut to the last configuration that was launched. To modify the configuration, go back to Run Configurations window.
Q. Why don’t I see my test class when I click search for test classes?
A. Make sure the class is annotated with @IsTest or ‘testmethod’. The dialog will not show test classes that do not have static methods with one of these two annotations.
Q. What if I add/edit/delete a test class/method?
A. After you add, edit, or delete, a test class or method, update the Run Configurations. Otherwise, the change may not be reflected appropriately in the test results. If you would like this to magically happen, and it would increase your productivity by exactly 133.7%, submit an Issue on GitHub.
Q. Why do the System Debug Log and User Debug Log seem inconsistent? Sometimes, I see logs for another test class.
A. The mechanism under the hood is simply setting a trace flag before the test run and deleting the trace flag after the test run finishes. This enables Apex Log with the categories and levels you specified. We retrieve the ApexLog object after receiving the ApexTestResult object. If there are any inconsistencies with logging, the problem is most likely with trace flags. We have a trace flag improvement project in progress.
Q. What if I want to select some test classes in a project? Or some test methods in a test class? Or test methods in different test classes?
A. Our Force.com Eclipse plug-in is open source. You are welcome to contribute.
Q. Where is my code coverage info?
A. A teleportation mishap occurred in our laboratory and our highly trained monkeys are working hard to locate the other end of the portal. Meanwhile, submit an Issue on GitHub to let us know where and how in the Apex Test Runner view you would like to see the code coverage info.
Q. Why doesn’t right click do anything different to the test results tree?
A. Left click paid more money to achieve benevolent dictatorship.
Q. Why isn’t there anything in the Not-So-Frequently Asked Questions about cats? I insist on a cat tax!
A. If you find our NSFAQ inadequate, we invite you to watch this video.
We are adding auto-completion support for the Apex language in v34 of the Force.com IDE. Currently, it supports completion of system namespaces, types, and members (static methods, instance methods, constructors, and properties). It derives its source of data from a Tooling API endpoint, completions?type=apex, which is also being used by the Developer Console and other external tools. We are still improving the feature to be more context aware, but we wanted to give you, the developers, a chance to try the features out while we continue working on it.
In an Apex Editor, you can invoke Ctrl + Space and the list of completions will show up. The auto-completion is also automatically invoked when you type in a ‘.’ after a name.
The screenshots below give an idea of what you can auto-complete on.

You can invoke it for system methods.

You can invoke it for local variables in the current method scope.
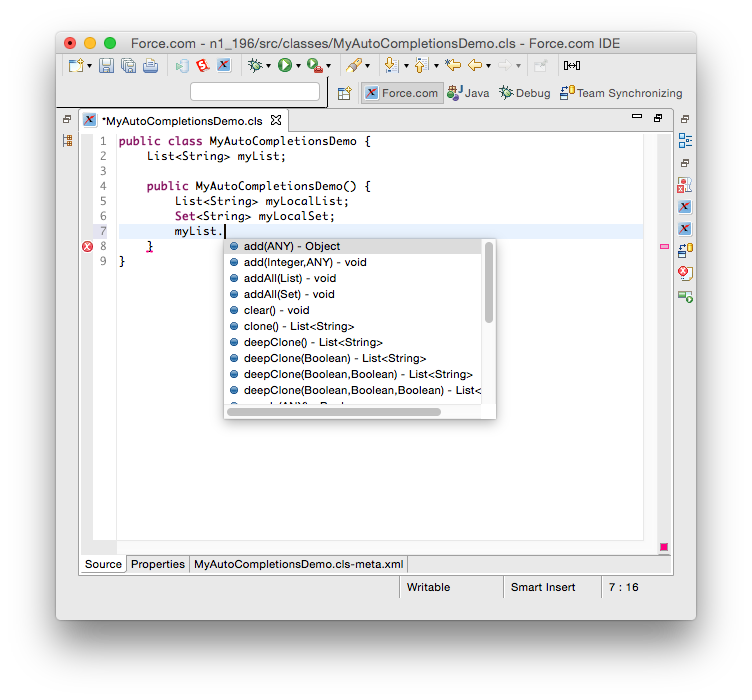
You can invoke it for fields in the current editor.
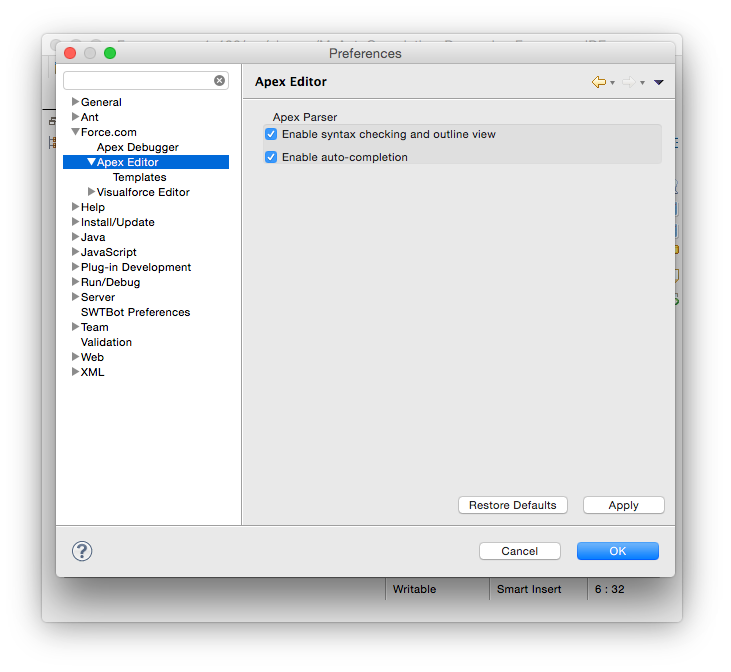
If you do not like the current behavior of the auto-completion and would rather turn it off, you can do so by going to Eclipse Preferences > Force.com > Apex Editor.
The current implementation provides completions for all methods and types exposed from the Tooling API endpoint, completions?type=apex. User-defined types are not currently shown in the completion pop-up.
Chaining of expressions is not currently supported. If you enter mySet.get(0).<cursor>, the system does not yet understand what to complete there based on the type of the get(...) method.
The current implementation handles fields and local variables from the currently open Apex Editor. It does not consider information available in different files. For instance, if your currently open class has a parent class with field parentFieldA a, the auto-completion does not present that as a choice.
The project is open source, and we welcome contributions and bug fixes from the open source community who have suggestions on improving any of the features.