This project was completed as part of my cursus at Ironhack (a 9-week intensive coding bootcamp).
The objective of this project was to build visualizations in Python to understand the impact of the increasing number of Airbnb rentals in the city of Paris, on the 2015-2019 time period.
Since its arrival on the French market in 2010, the number of Airbnb rentals has continuously grown to reach 65,000 listings in Paris only by the end of 2019. The US home-sharing giant currently raises two concerns in the capital: it creates a fierce competition for hotels with aggressive price ranges, and also fosters the Parisian housing shortage by monopolizing available accommodations.
To counter these issues, the City of Paris and the French government have taken several measures:
- Since October 2017, every Parisian seasonal rental must be registered online.
- Since January 2019, the Elan law limits the rental period of a main residence to 120 nights max. per year. This measure is applied at the national level, to 18 French cities.
- In February 2019, the City of Paris fines Airbnb €12.5M for 1000 listings not displaying the required registration number.
The municipal elections of March 2020 have reactivated the debate, and additional measures are now contemplated by candidates, such as:
- Reducing the maximum number of nights per year from 120 to 30
- Limiting rentals to private rooms, as it is already the case in Berlin
- Forbidding Airbnb rentals in specific arrondissements (especially the most central ones)
To perform the below study, we relied on InsideAirbnb.com data. Our data provider has been scraping the Airbnb websites of various big cities every month for several years, and makes collected data publicly available on its platform. For the city of Paris, available scraping outputs range from May 2015 to November 2019.
Our pipeline was composed of 2 main steps:
-
STEP #1 - Data acquisition and preparation
- Scrape InsideAirbnb.com to get all
listings.csvfiles (1 scraping per month, i.e. 48 files in total). - InsideAirbnb.com also provided us with a
neighbourhoods.geojsonfile, so that we could map available data using the geographic coordinates of Paris arrondissements. - Create 2 Pandas DataFrames:
hist_df(overall period) andlastm_df(last month period only). The code has been made in a way that if you re-scrape the data today, the program will be able to automatically select the last month from the scraping output.
- Scrape InsideAirbnb.com to get all
-
STEP #2 - Reporting
- Create maps
- Create graphs
- Save generated
.pngfiles
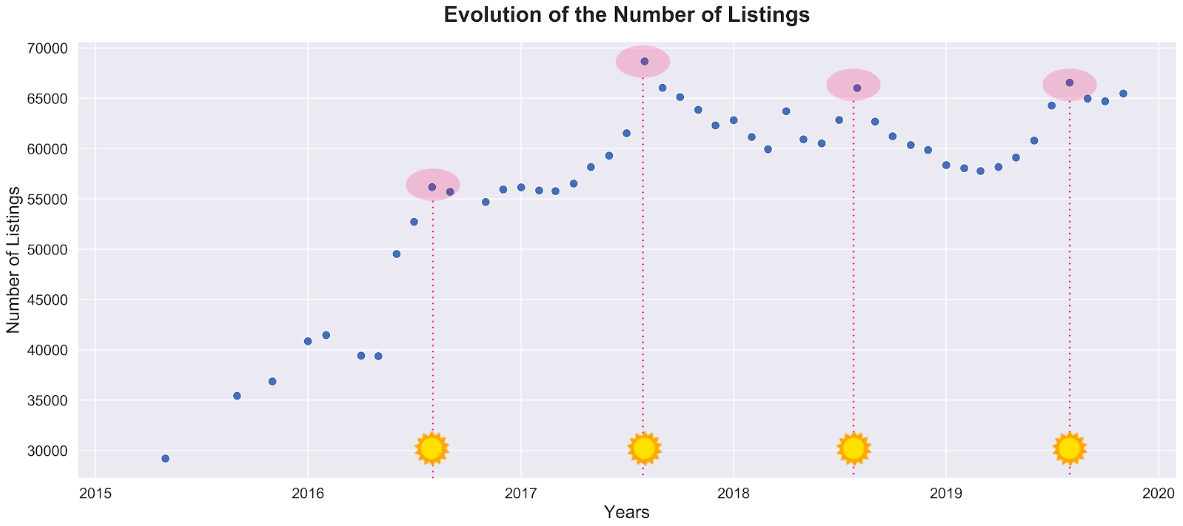
The number of available listings follows a seasonal pattern, materialized by significant peaks in summer holiday periods (time period: 2015.05 to 2019.11).
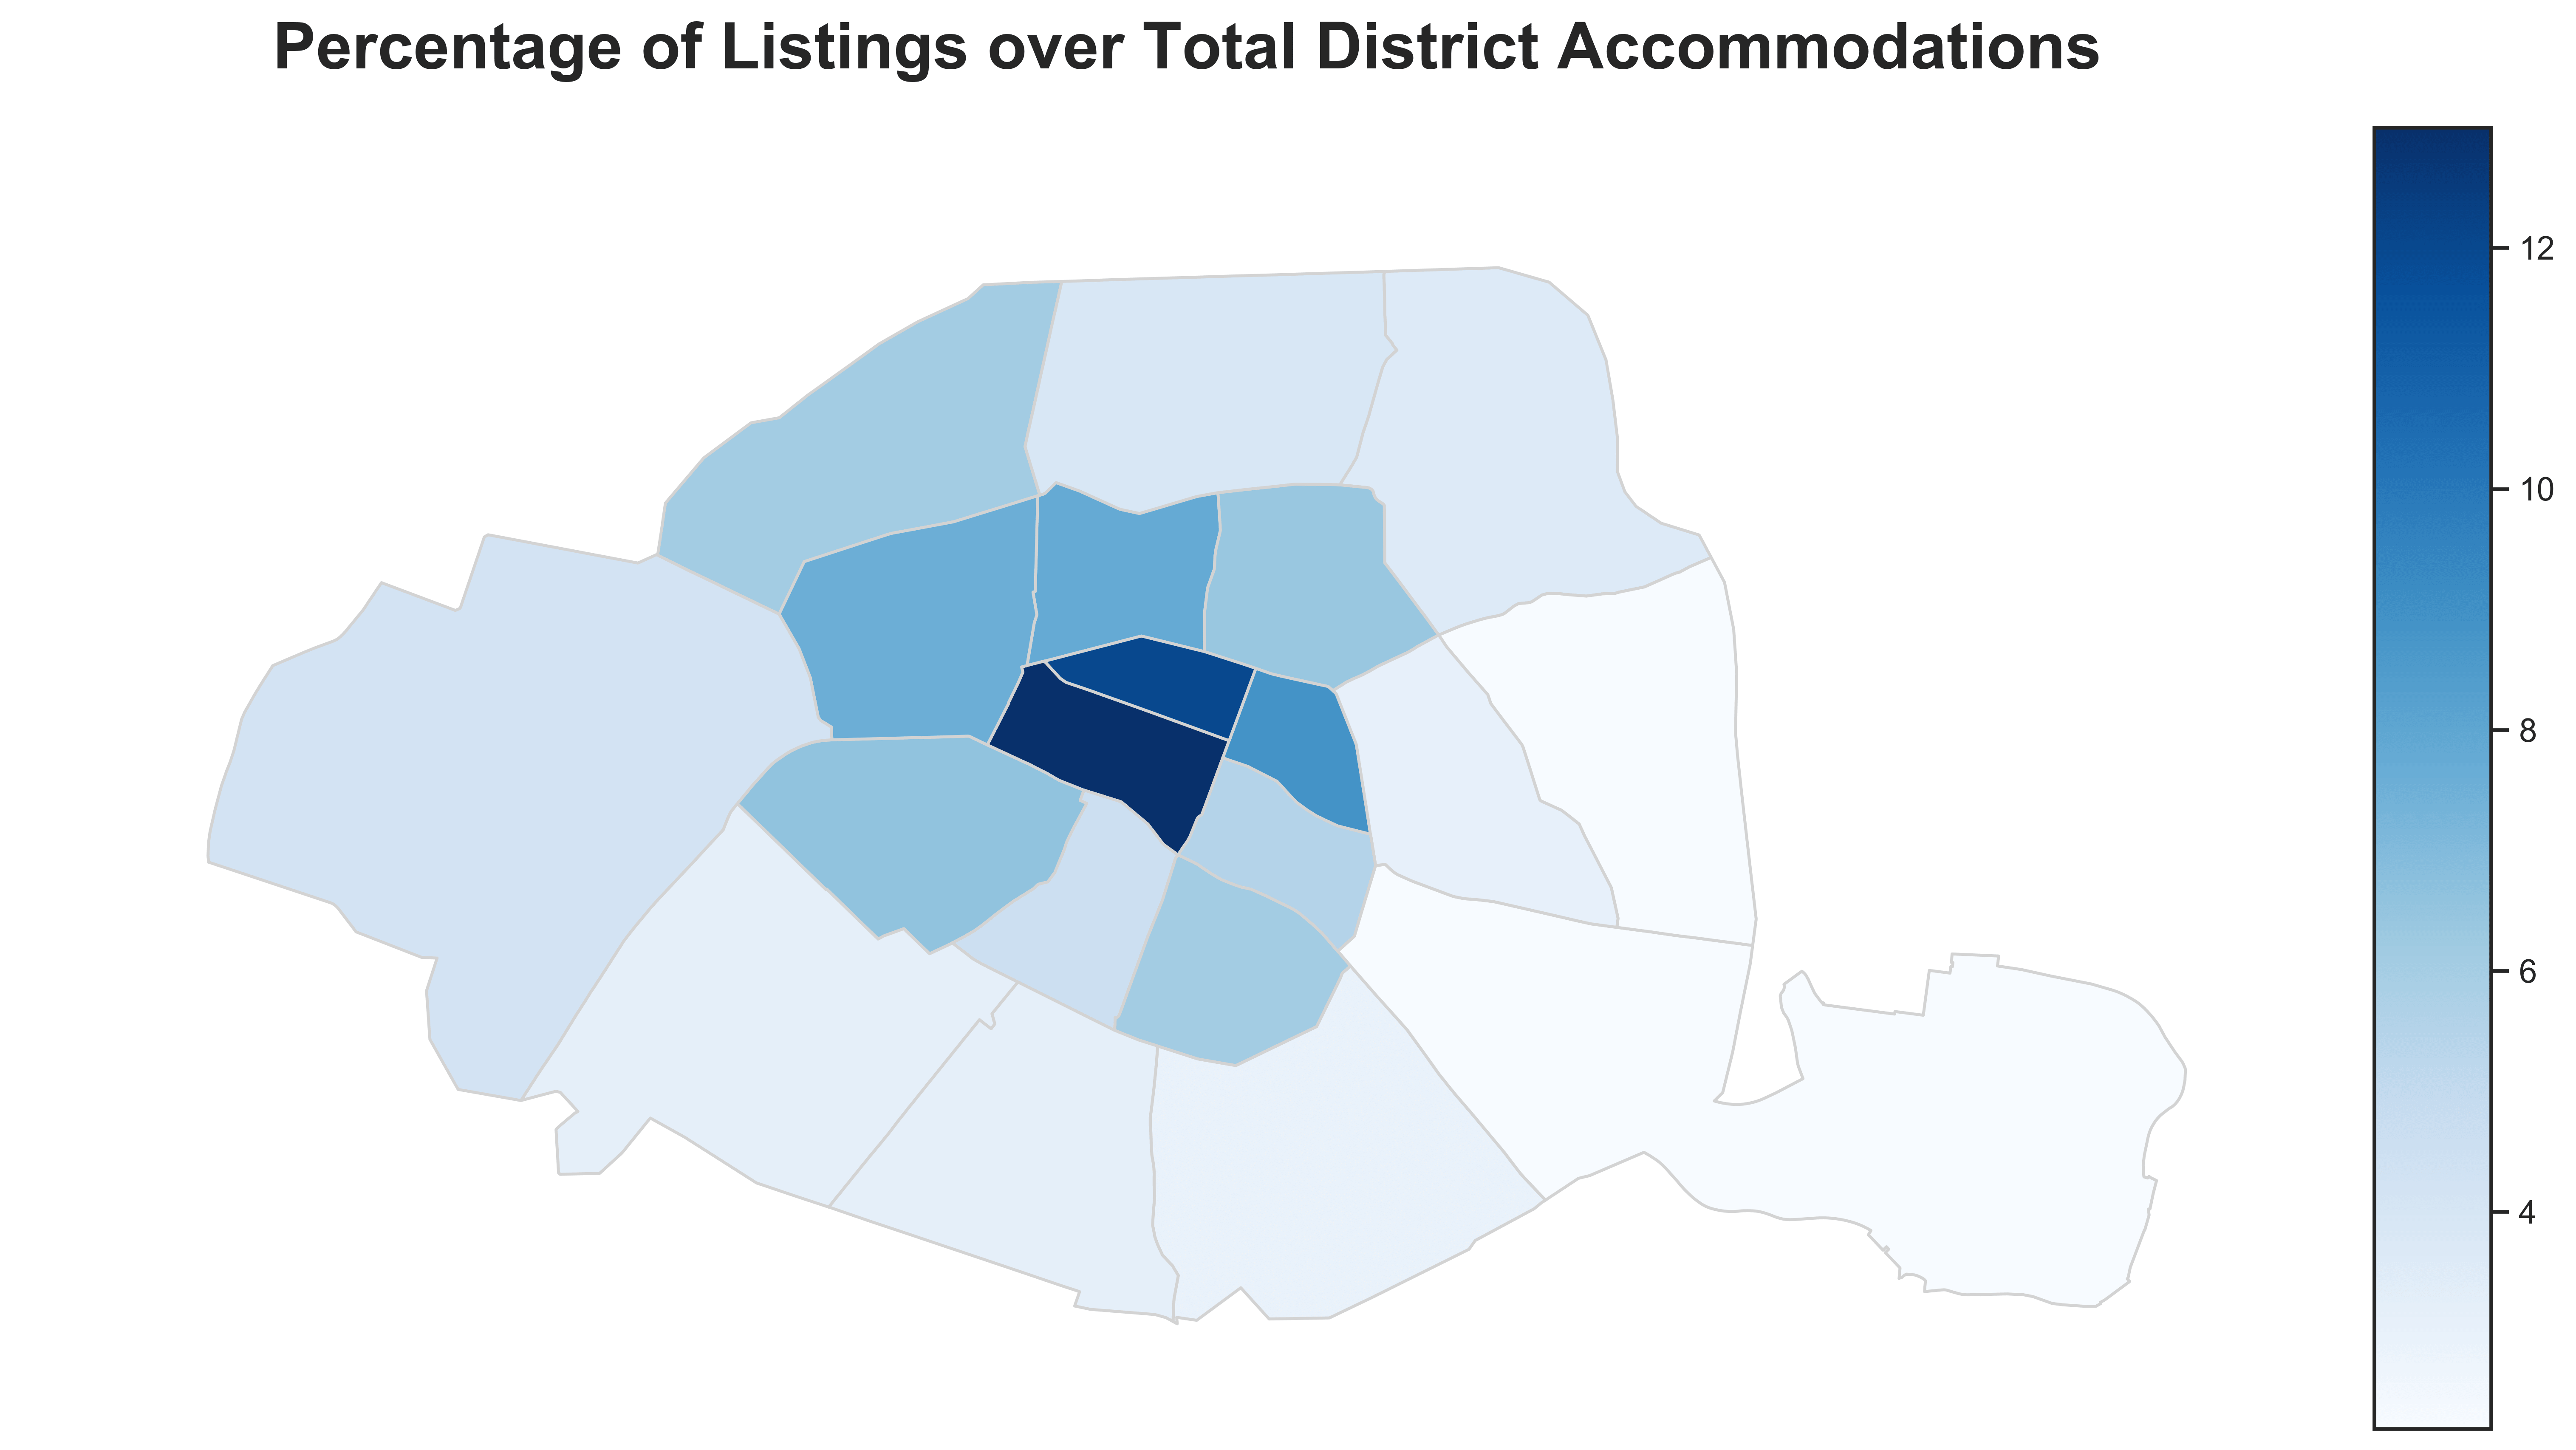
In the 1st and 2nd districts, over 10% of total accommodations are rented on Airbnb (time period: 2019.11).
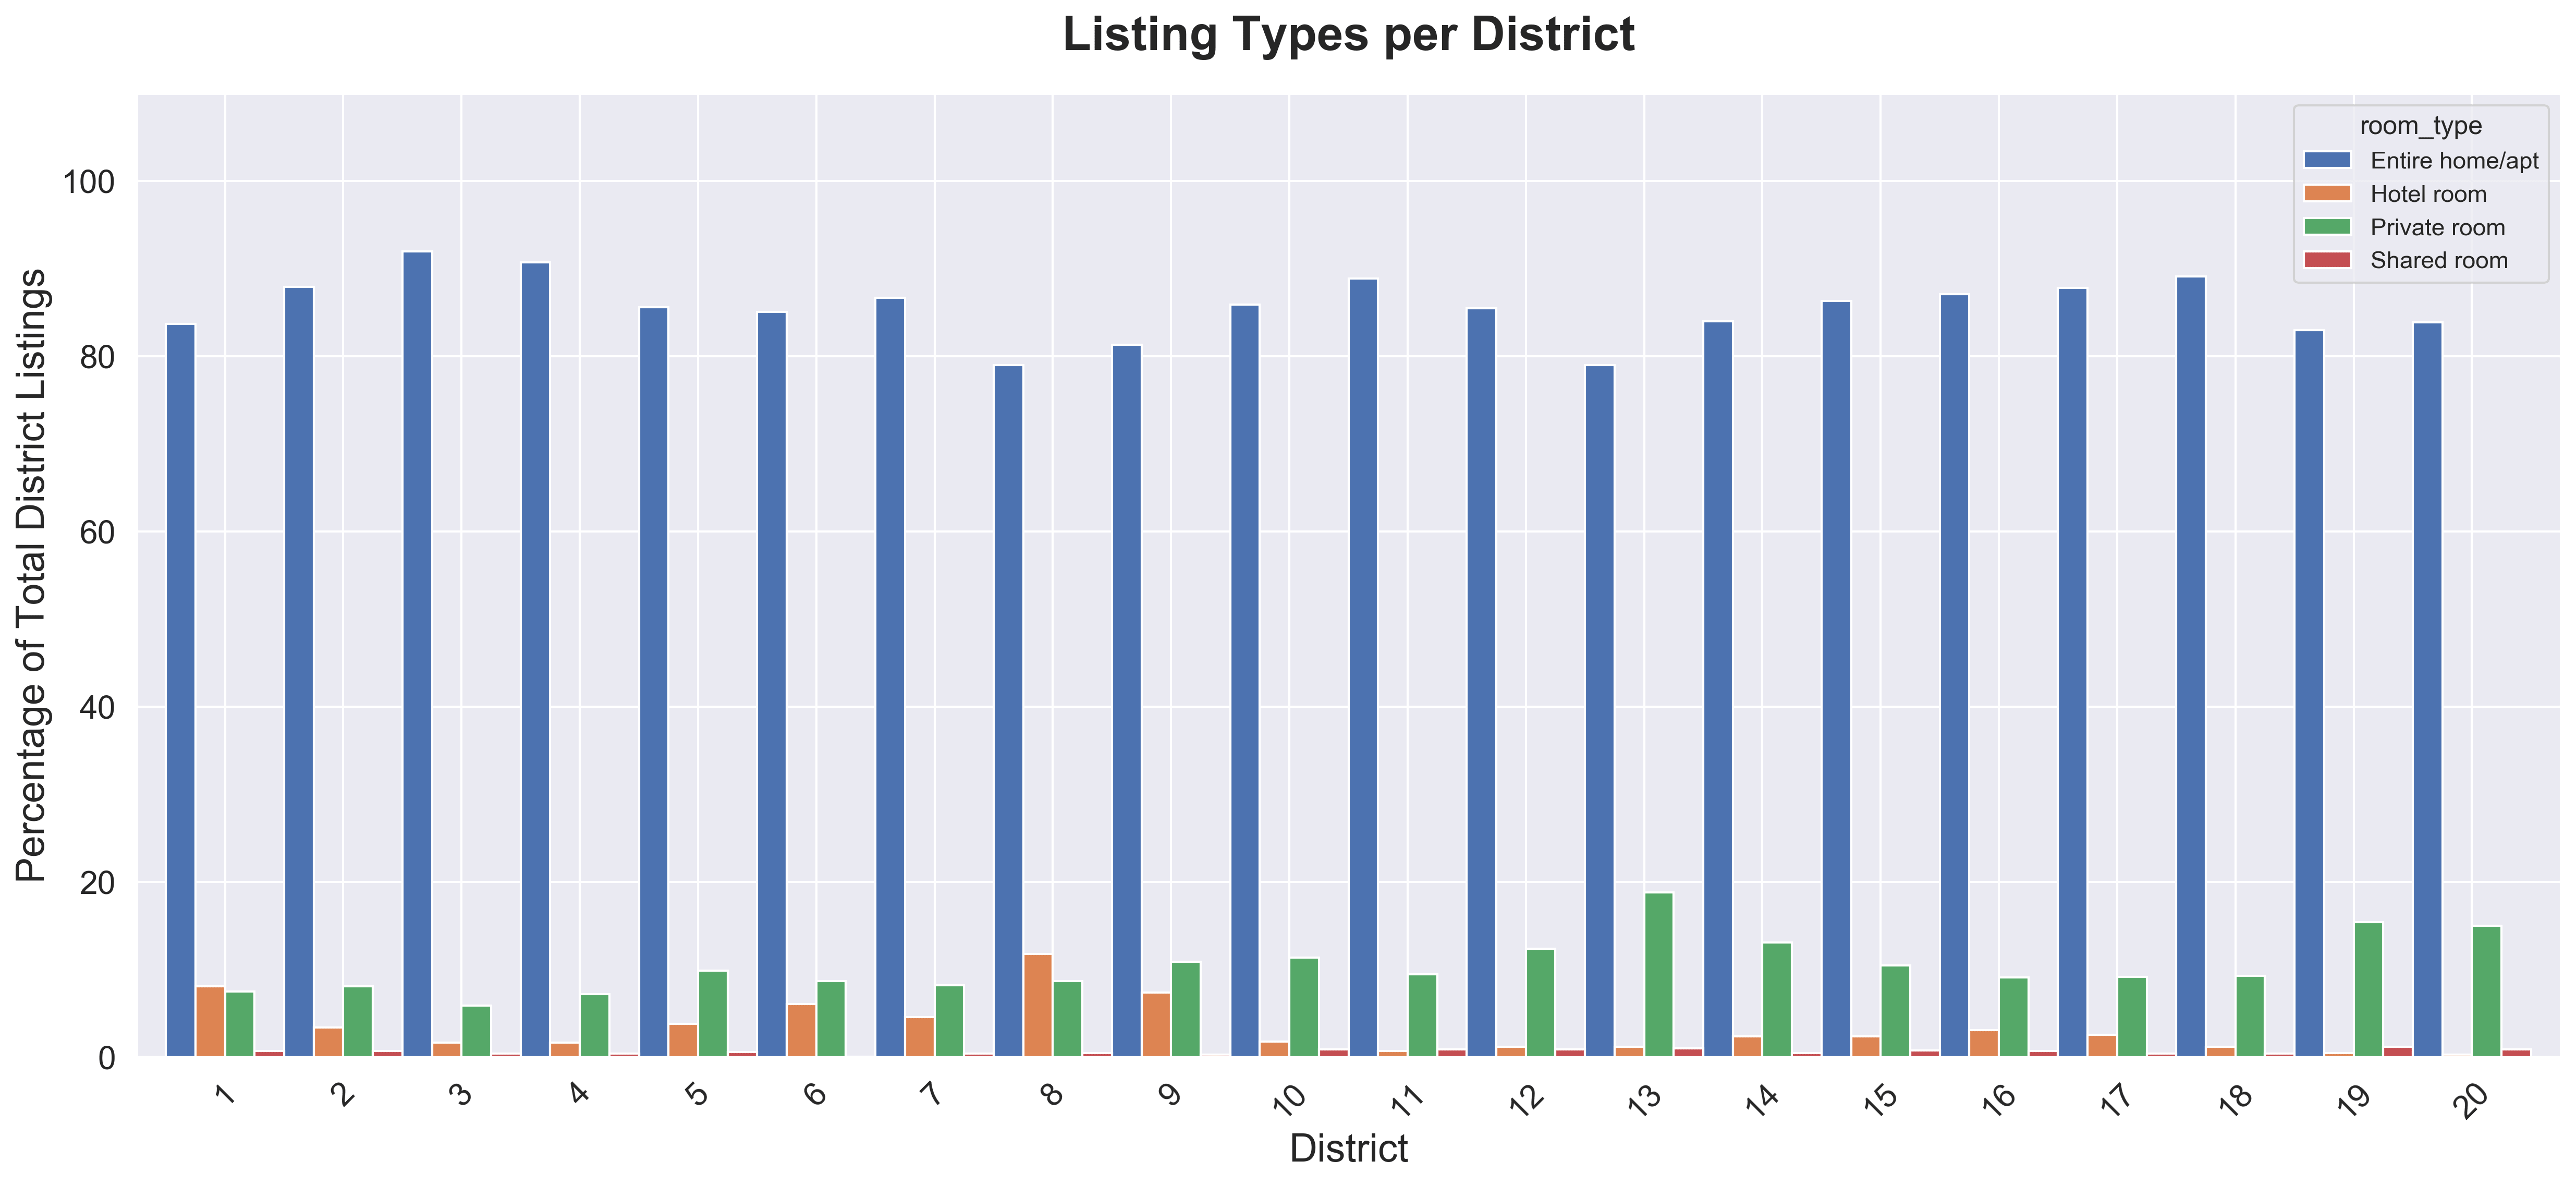
Over 80% of Airbnb rentals are entire homes. The greatest proportion of hotel rooms available on the website can be found in the 8th arrondissement (time period: 2019.11).
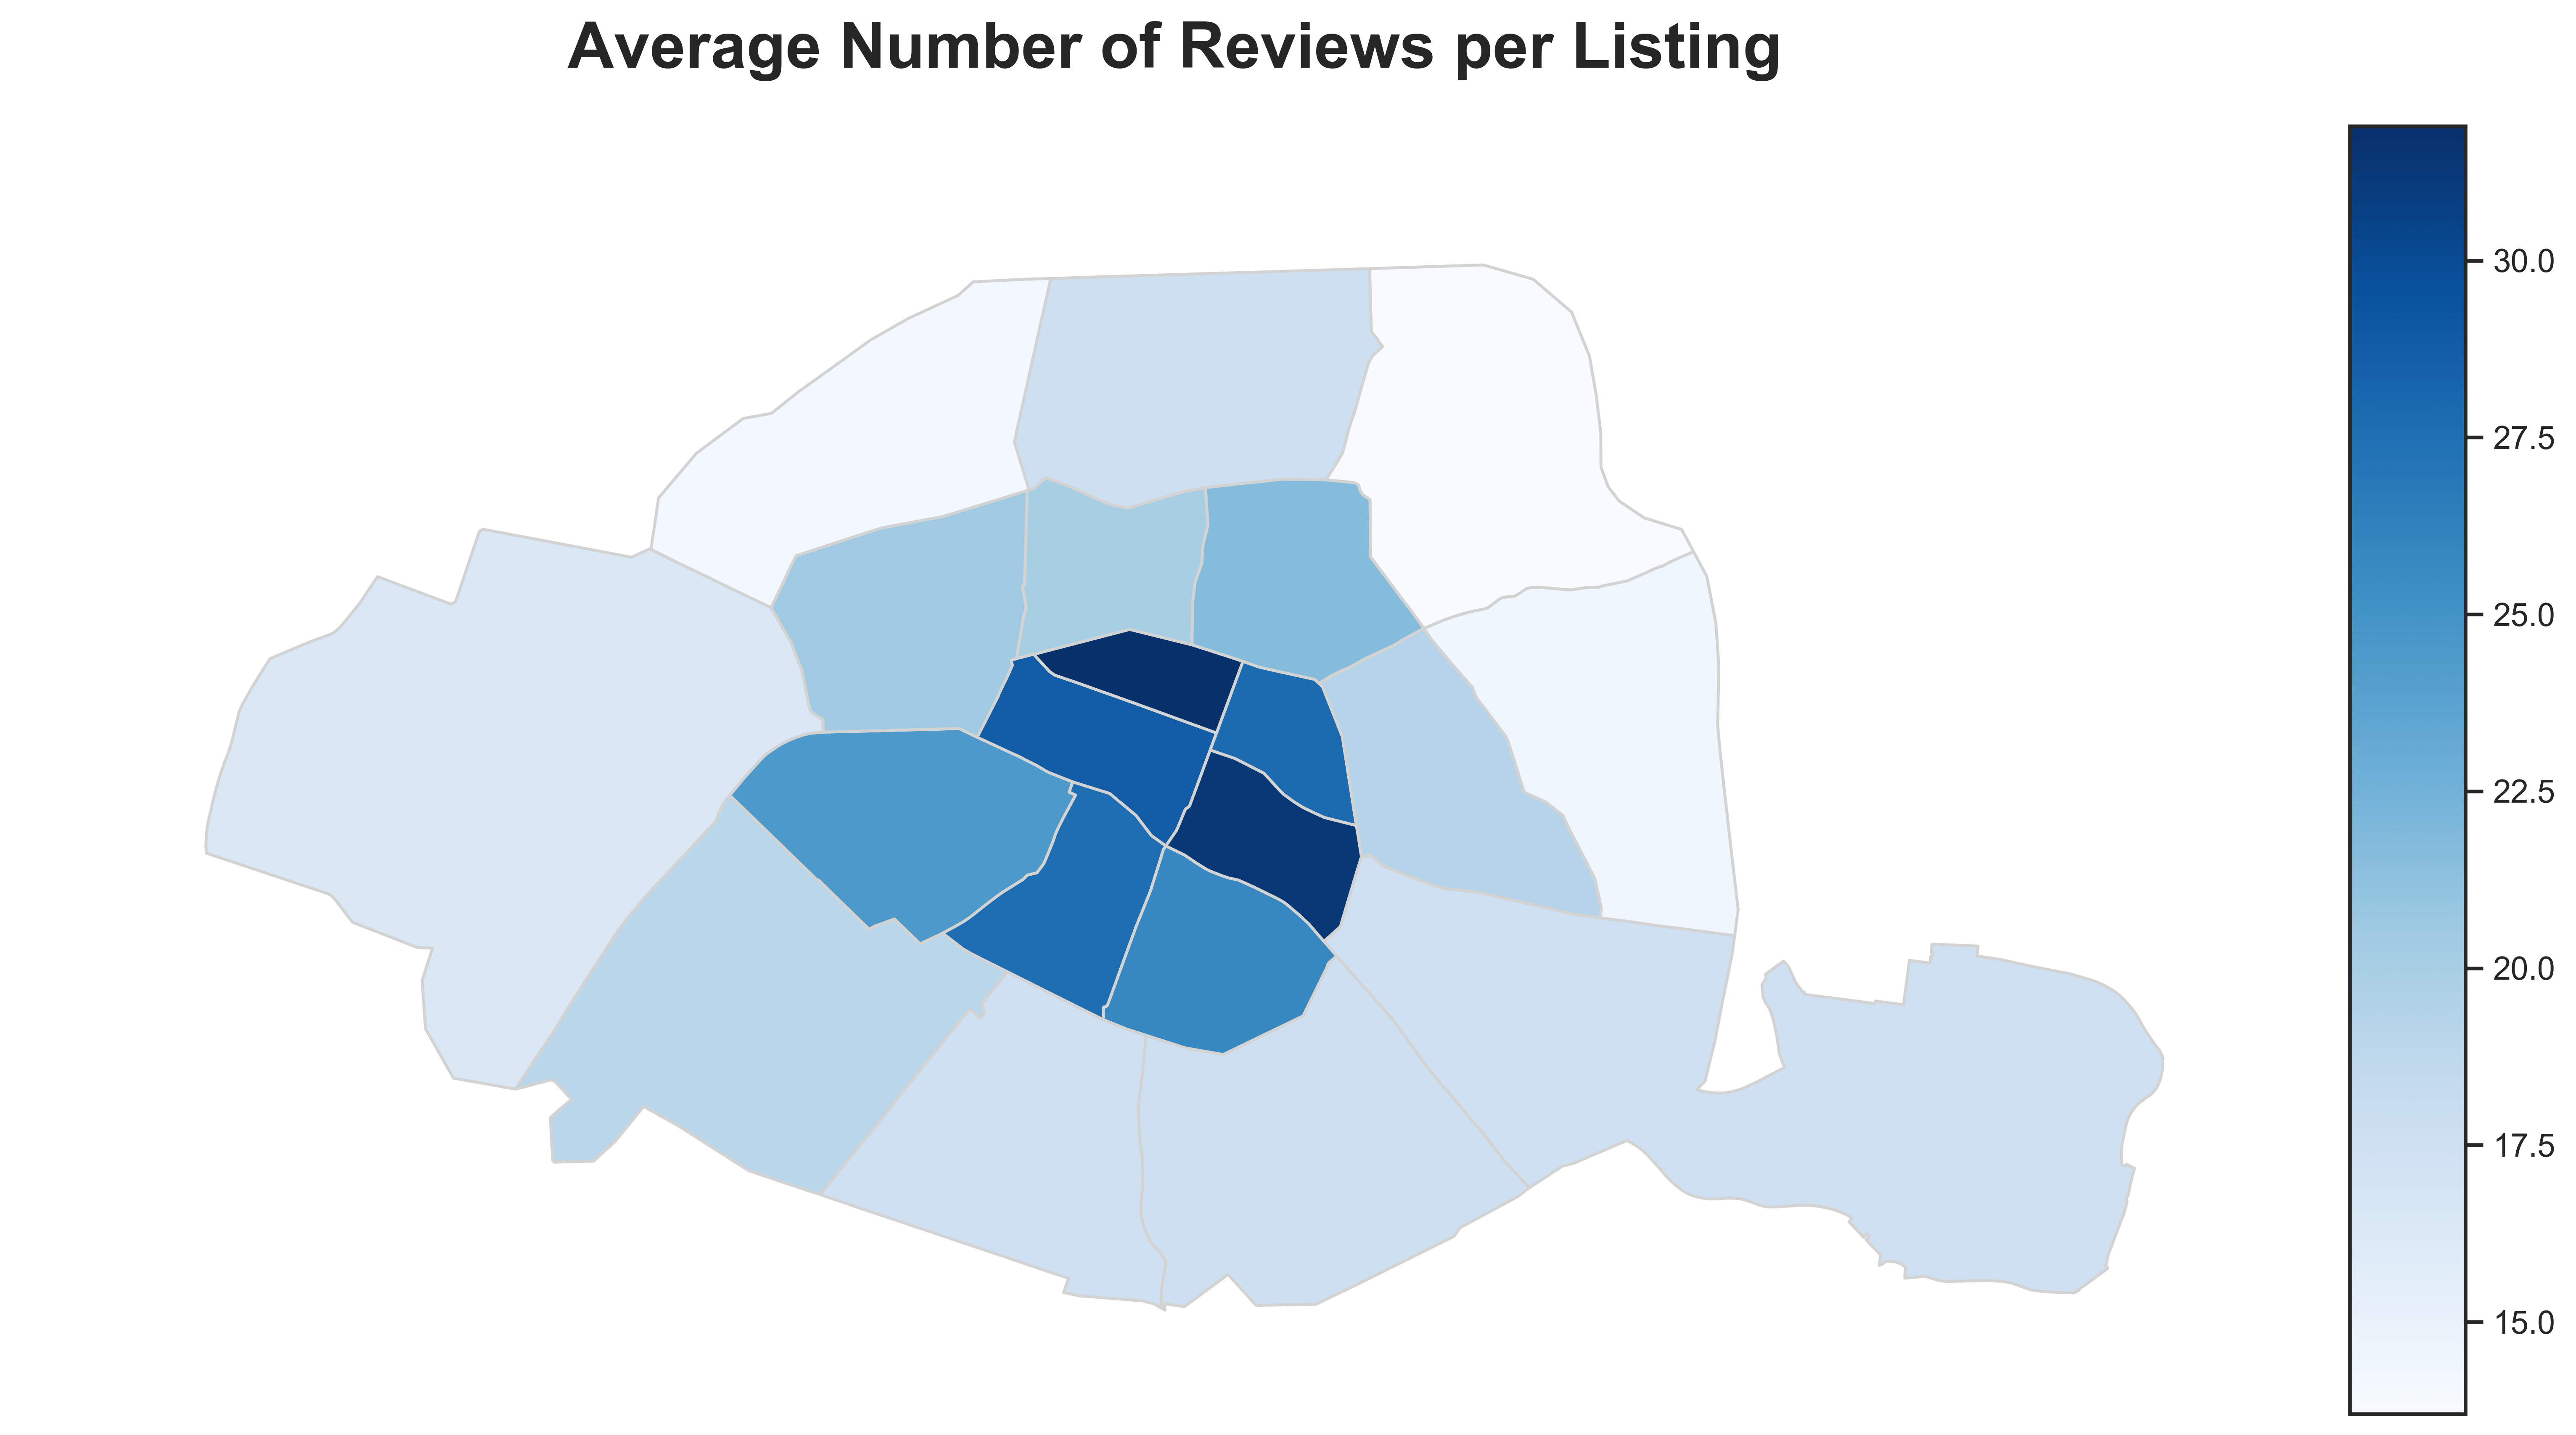
Central arrondissements concentrate the greatest part of the demand (time period: 2019.11).
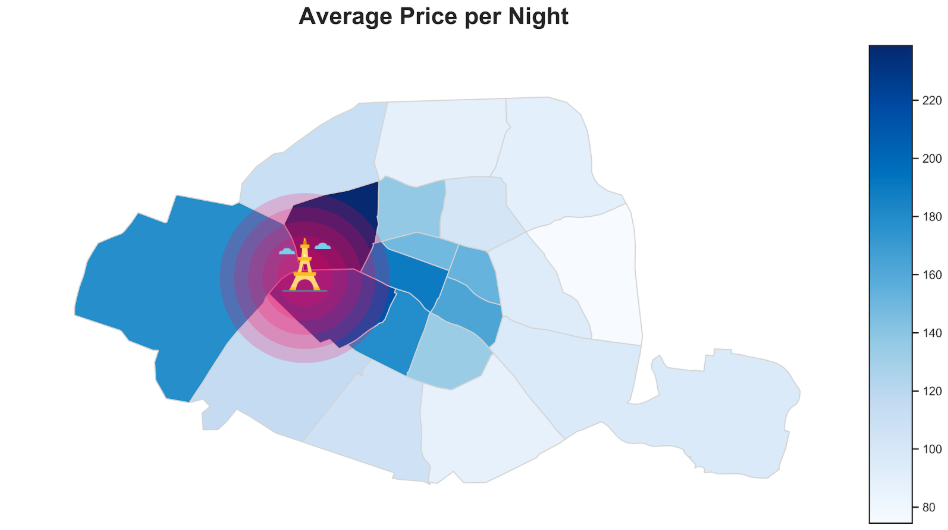
Average prices per night range from 80 to 240 euros, the highest rates being found around the Eiffel tower (time period: 2019.11).
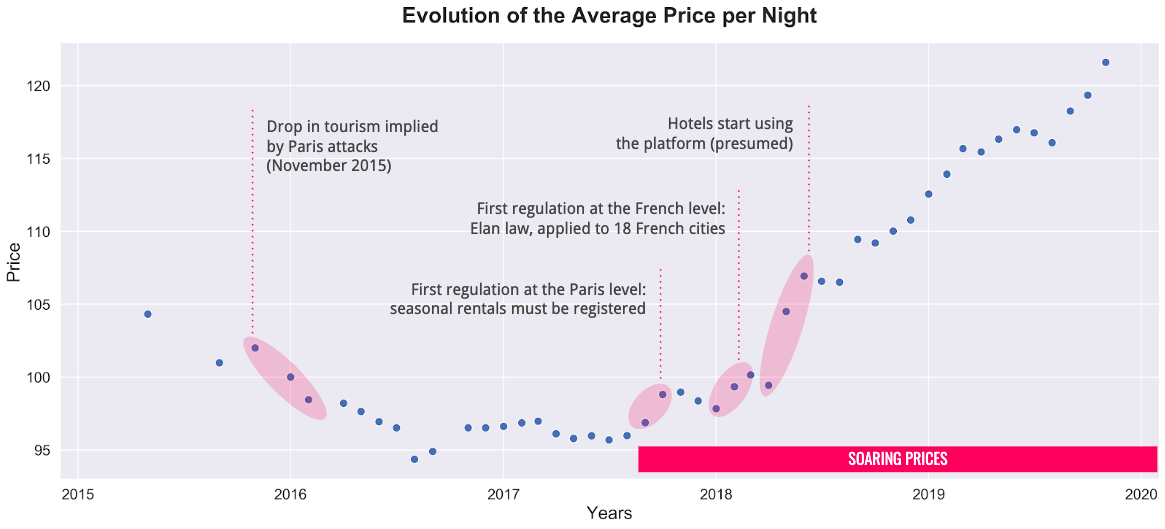
Airbnb prices have been soaring since end-2017, showing a change in the platform’s business model (time period: 2015.05 - 2019.11).
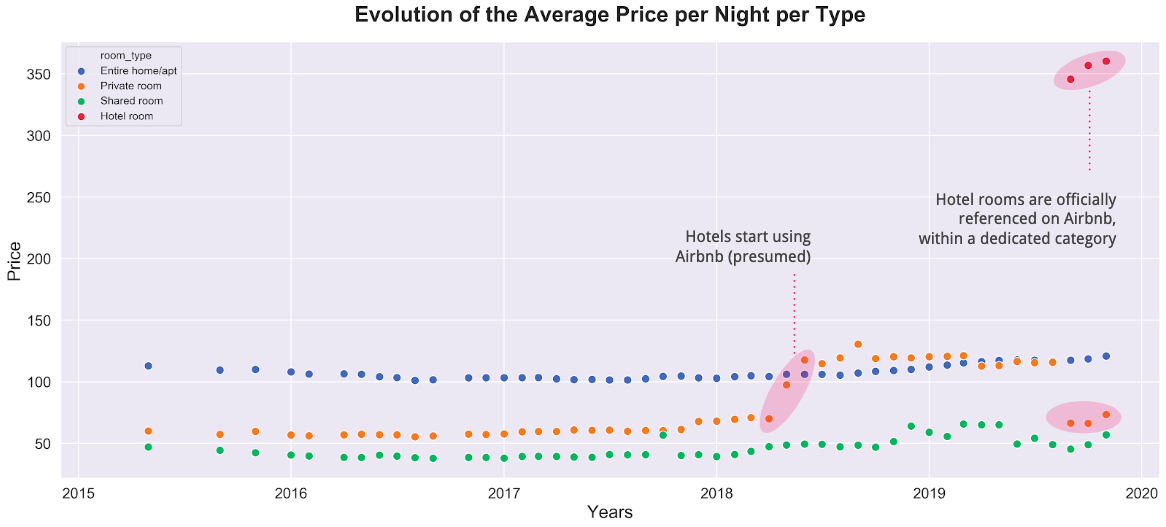
Hotel rooms were officially referenced on Airbnb from mid-2019, but the rise in prices observed within the shared room category indicates that they might have been present on the platform one year earlier (time period: 2015.05 - 2019.11).
GeoPandas, Matplotlib, Seaborn, Requests, BeautifulSoup