


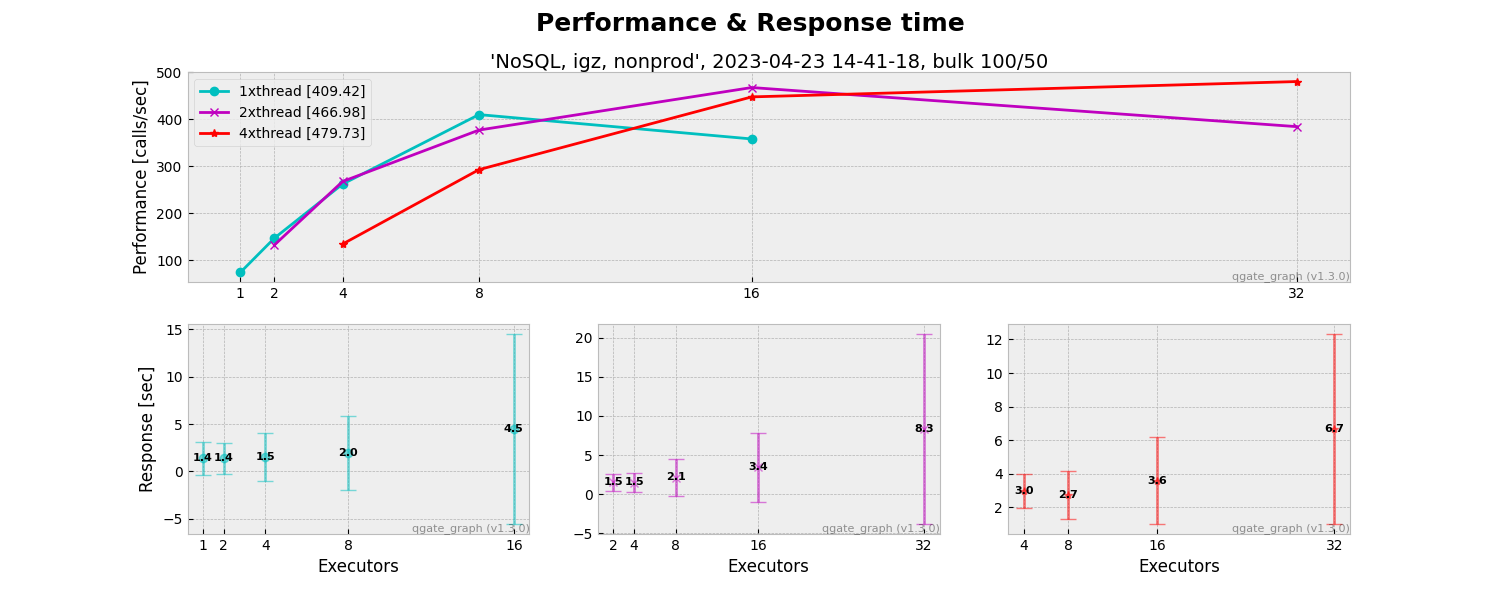
The QGate graph generates graphical outputs based on performance tests (QGate Perf). Key benefits:
- provide graphs about Performance/Throughput and Response time (on typically client side)
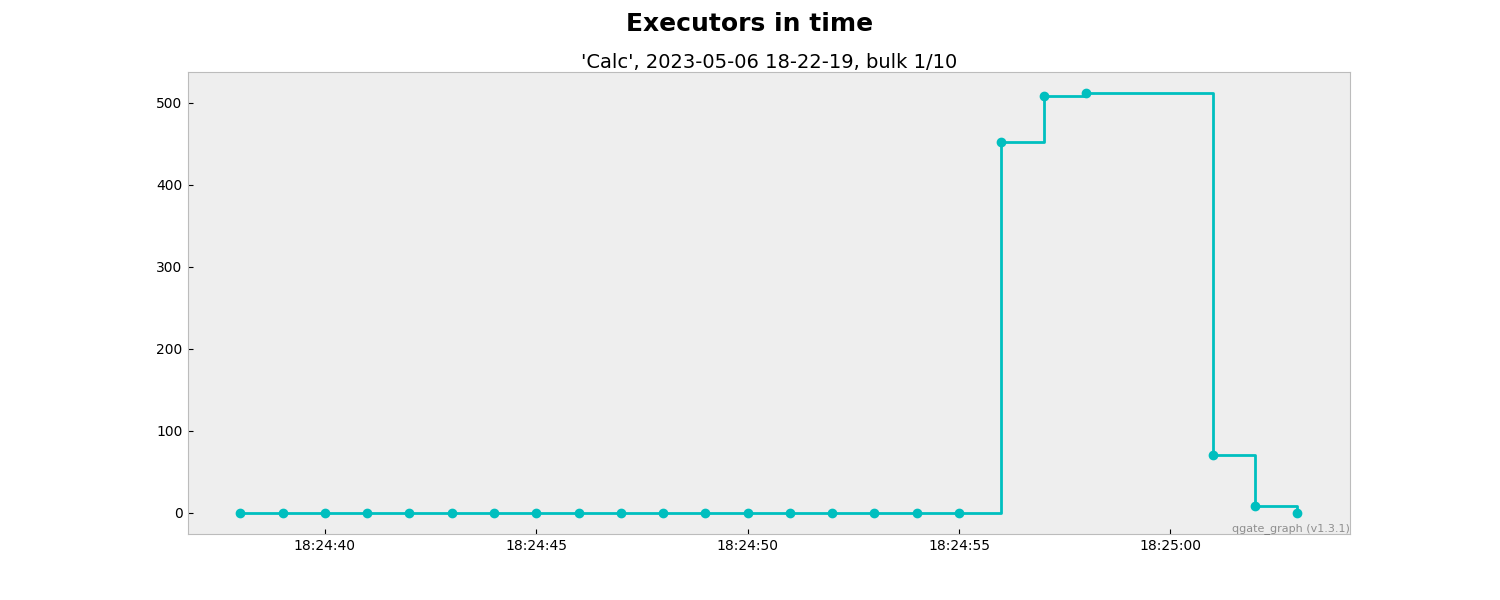
- provide graphs about Executors in time
It is a quick way, how you can identify real performance for your python solution.
NOTE: These graphs only visualize outputs from performance tests (QGate Perf), it is not replacement of detail views from Grafana, Prometheus, etc. in detail of CPU, GPU, RAM, I/O etc. on side of testing system.
from qgate_graph.graph_performance_txt import GraphPerformanceTxt
from qgate_graph.graph_performance_csv import GraphPerformanceCsv
from qgate_graph.graph_performance import GraphPerformance
from qgate_graph.graph_executor import GraphExecutor
import logging

# setup login level
logging.basicConfig()
logging.getLogger().setLevel(logging.INFO)

# generate performance/throughput graphs
graph=GraphPerformance()
graph.generate_from_dir()

# generate executors in time graphs
graph=GraphExecutor()
graph.generate_from_dir()

# generate performance/throughput graphs in TXT form
graph=GraphPerformanceTxt()
graph.generate_from_dir()

# generate performance/throughput graphs in CSV form
graph=GraphPerformanceCsv()
graph.generate_from_dir()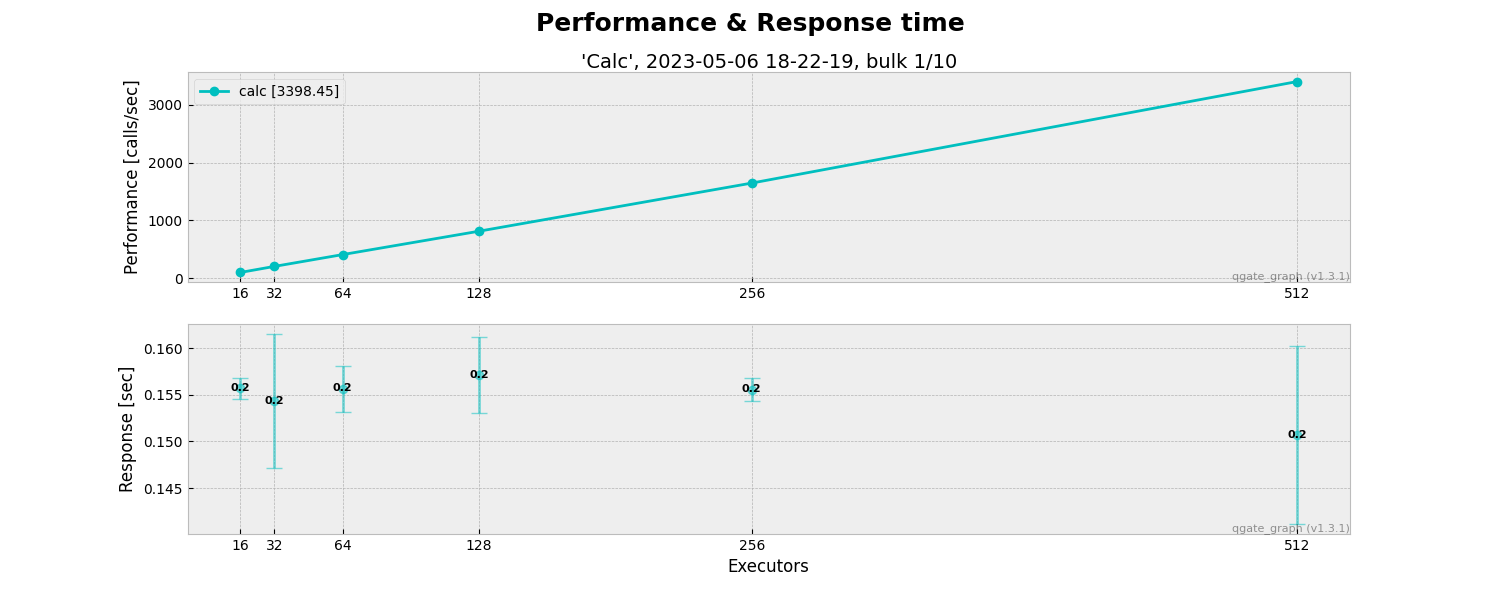

Performance/Throughput & Response time in TXT form

Performance/Throughput & Response time in CSV form
