Contributors graph #847
Comments
|
Is there a good graph-lib? In my opinion this can be rendered and cached server-side |
|
Any progress? |
|
would be nice to have 🎉 |
|
I would like to start working on this feature, if no one is already on it (yeah @lafriks, I learned my lesson, I would probably need some assistance every now and then, e.g. on how to decide about server or client side rendering, what charting library to use etc. |
|
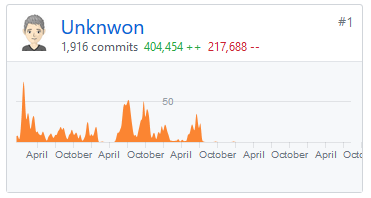
Let's start by taking apart existing solutions to identify required data and possible data structure. GitHubAPI endpoint for contibutions data is The returned JSON data is basically a list of objects (each representing one contributor) sorted least contributions first, most contributions last: The structure is roughly similar to the one documented here and looks like this: Each member of the
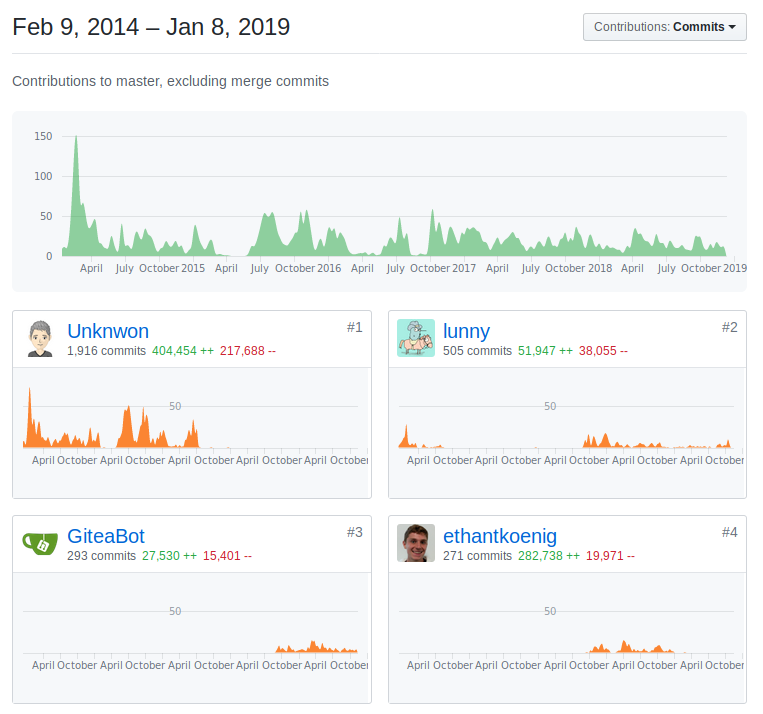
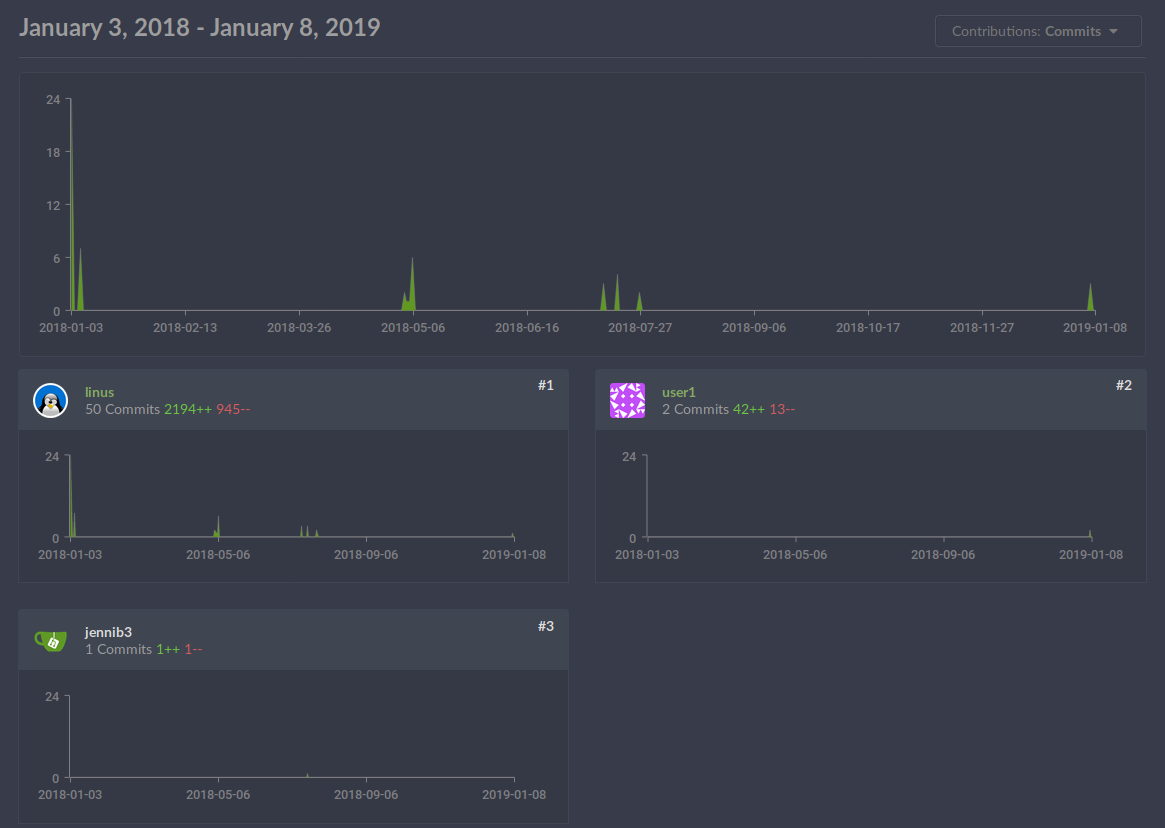
All that information is used to build these cards:
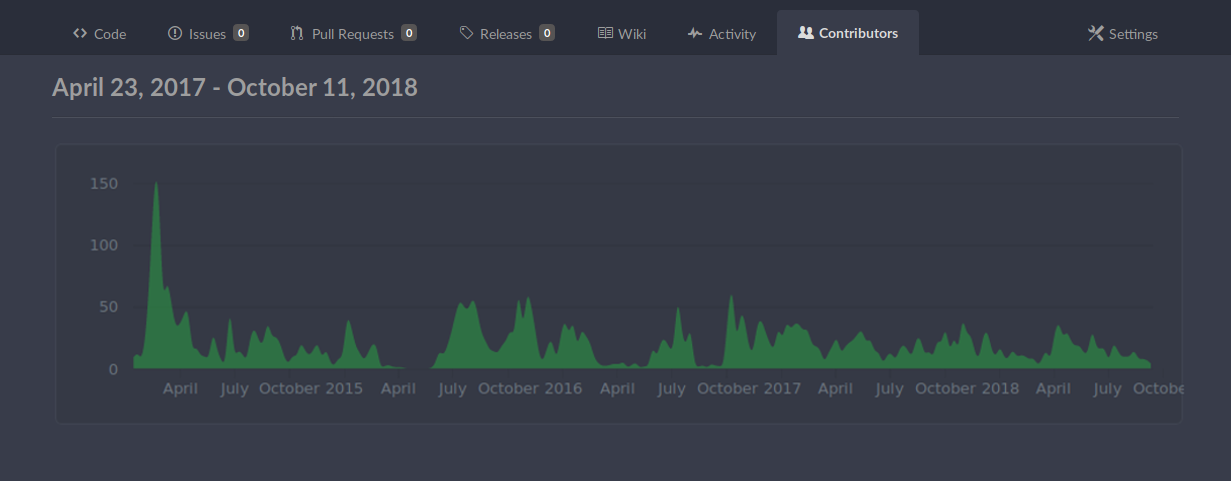
The big contributions graph obviously can be built by adding up the stats from each user of a week GitLabGitLab CE is Open Source, so we have the relevant files:
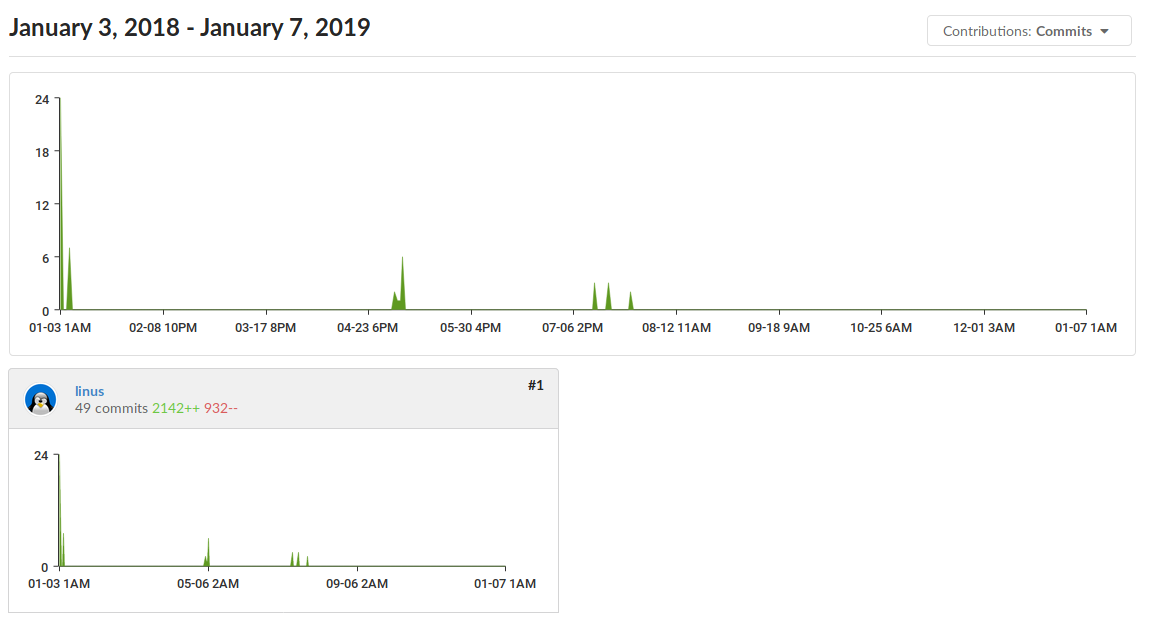
API endpoint is The returned JSON data is much simpler: Each member of the array represents one commit, sorted latest commit first, initial commit last. The structure looks as follows: If a user made multiple commits on the same day, there will simply be duplicate entries with the same user information and date, one for each commit. The per-user tiles will contain less information than on GitHub, the plotting is done by taking the number of commits for one day, X-Axis is time, Y-Axis number of commits. That is done for both the whole repo (ignoring username) and each user (taking all commit entries for a specific user on a specific day). In both cases rendering is done client side, which has the great advantage of being able to build dynamic charts with zooming. |
|
If it works with your general workflow here, I'd be fine with being assigned to this issue. Some more thoughts on this. Constructive feedback is of course highly appreciated! Placing the page link on the UI
That should work fine, no need to restructure anything for now. Speaking of links, the page should probably live at Another idea, which I do not prefer, is putting the contributor graph(s) on the Activity page. I did some DOM editing:
I chose Now some quick CSS editing on the GitHub contributors chart for Gitea and merging the images:
That's a very rough idea of how it may look like, not taking individual per-user charts into account. |


|
Looks wonderful ^-^ |
|
@linusg great! Go ahead! |
|
@lunny I'm kinda confused right now: Who is @Morlinest and what role will he play in this issue? |
|
It is probably a mistake or maybe he has some secret plans with me :D |
|
@linusg @Morlinest :( sorry. A mistake like what @Morlinest said. I want to assign this issue to @linusg but I found it cannot be assigned to non-maintainers and issue poster. |
|
Ok, thanks for clarification 😄 |
|
Oh, so I will have to do it now :D |
|
Short heads-up for those interested: I wanted to work on this during the Christmas holidays, but couldn't find much time. I've created the basic stuff (page, routing etc.) and plan to continue working on it! |
|
Thanks a lot ^-^ |
|
Ok folks, yet another update. I managed it to get to this state:
Click to expand: Gitea vs GitHub (real-life example)
Dark
Details:
Issues left:
Possible enhancements:
Ideas for changes and improvements welcome - I'm exited so far! I fear the upcoming code review though 😄 |


|
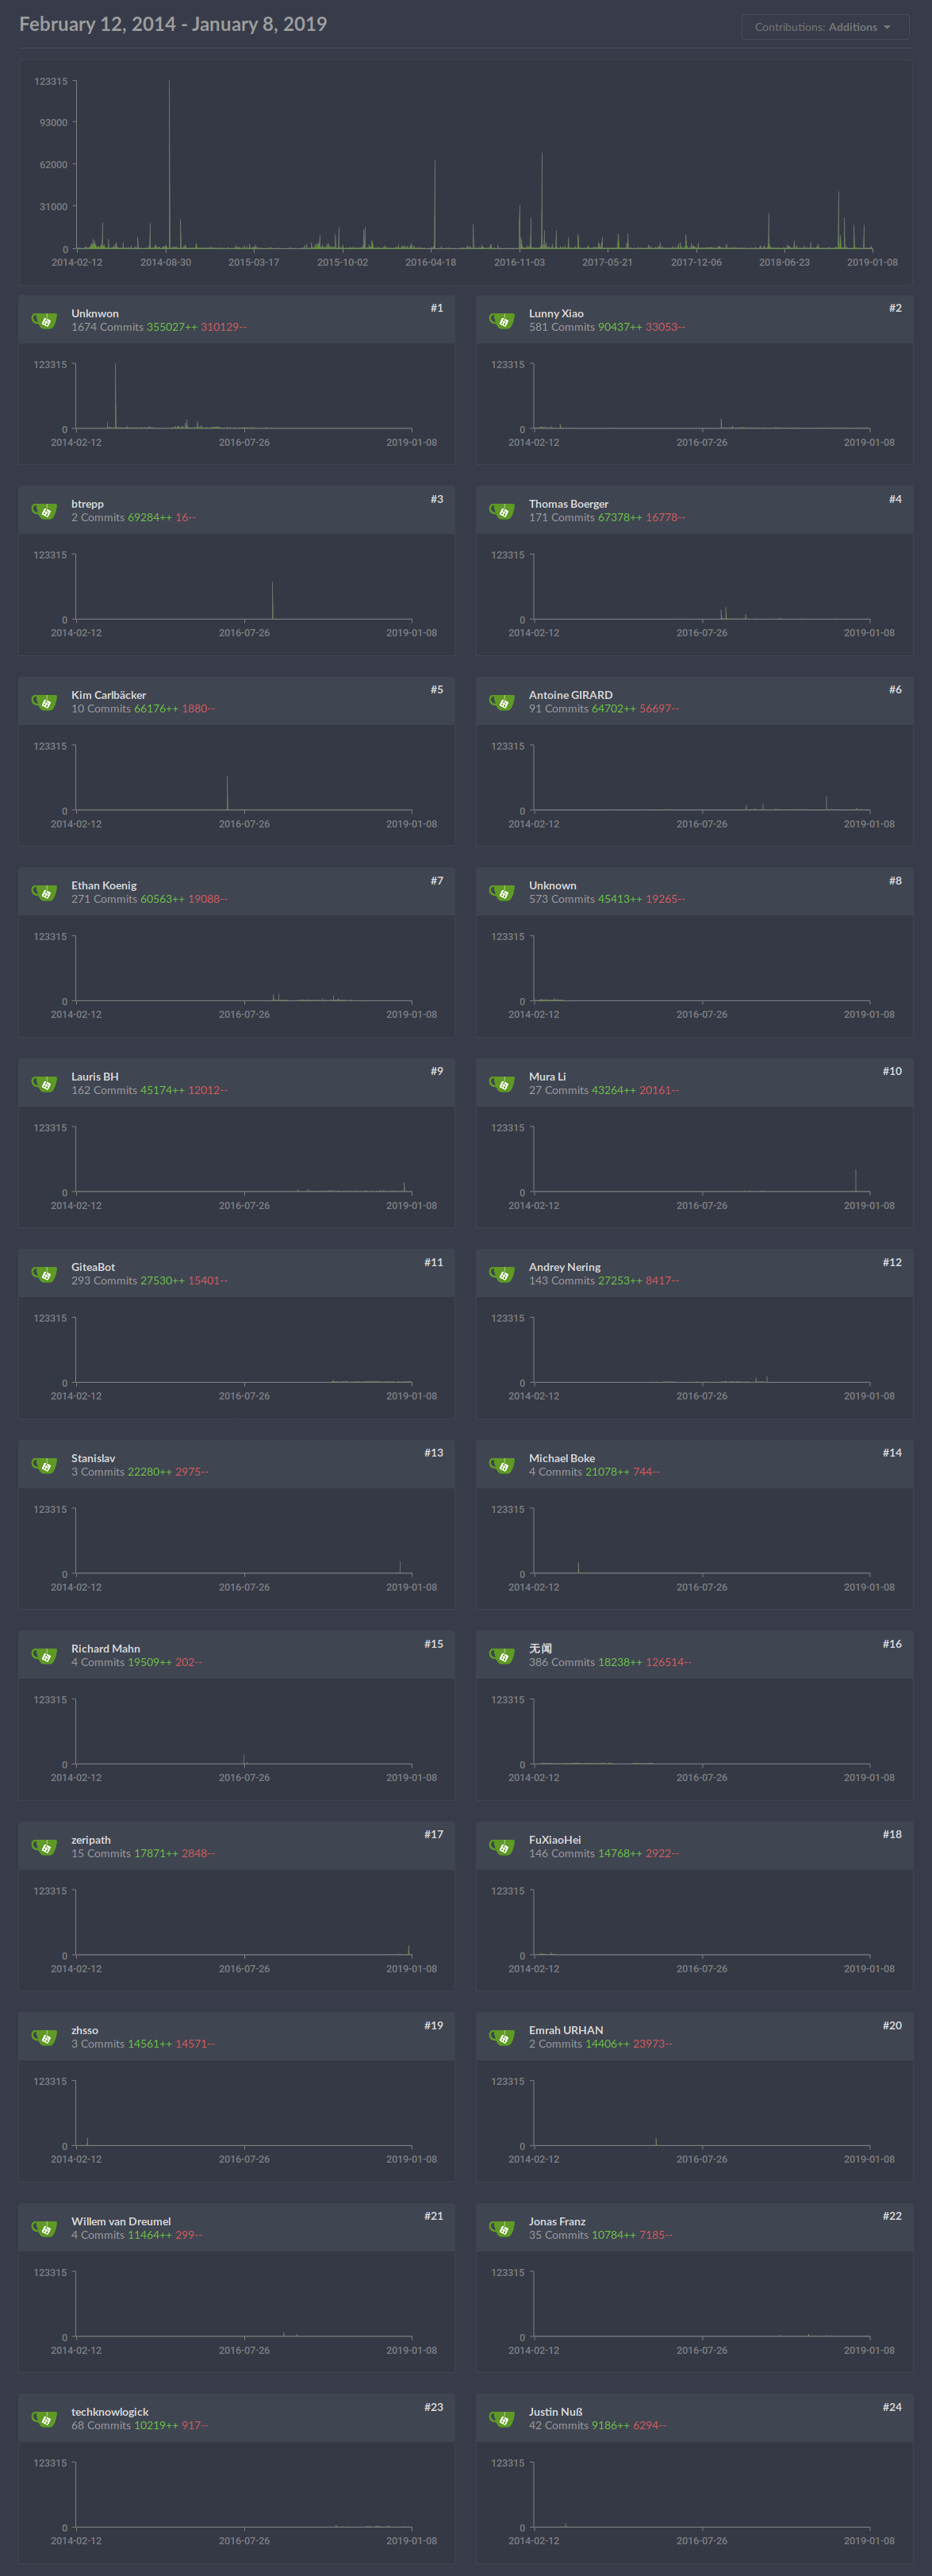
Sooo... here we go! Now it's the time for some external input, so please see below the images.
(gitea repo taken from GitHub)
Let me explain:
Performance: I fixed all of the issues noted in my last post, and I'm back to some performance issues. All stats from my dev machine: The contributors page of the Gitea blog repo takes 1.1s to load, which is probably fine (Page: 1090ms Template: 7ms) The one for the gitea main repo took 1min 14s and reports Page: 74443ms Template: 47ms. It has nine years of history and almost 7k commits, though. Possible improvements: the gitea repo contributor page ends up with 602 user cards, I believe GitHub cuts off at 100. See https://github.com/go-gitea/gitea/graphs/contributors. What do you think about that? As the charts become less useful with very few changes/commits because of the fixed Y-Axis, should we either only show top X contributors or maybe don't generate charts for more than e.g. 100 contributors?
Since the whole commit history will be traversed each time the page is visited, we can probably as well improve the situation by caching the stats. No clue if that makes sense and how implementation would look like. I had to clear the ServiceWorker's cache for the changed CSS files to show up (normal cache refresh wouldn't work). What do I have to do here so it works OOTB? More screenshots, click to expand
|


|
@linusg Great job!!! How about to let the work as a cronjob when the repository is big(i.e. over 1000 commits)? It can be run one or more days according the configuration. I think top 100 is enough, otherwise pagination is better. |
Maybe you can use the default branch option instead of creating another option. |
|
This issue has been automatically marked as stale because it has not had recent activity. It will be closed if no further activity occurs during the next 2 weeks. Thank you for your contributions. |
|
Nope, still working on this - someone might remove the |
That's good news, hoping to see this feature coming soon! |
This comment was marked as off-topic.
This comment was marked as off-topic.
|
I will try to implement this since no one seems to be working on it. I have zero experience with go but I think I will figure it out. Let's see how it goes 🤞 |
|
I decided to use Chart.js to draw the graphs. Right now gitea repository looks like this: 
There are still some work to do but before continuing I wanted to ask the maintainers if the Chart.js dependency is OK or not. If it is not ok which library should I use? Any other feedback is also greatly appreciated :) |
|
Since it's under MIT license, I think it's acceptable. Is that library the best choice to draw the graph? But of course PRs are always welcome. |
|
@lunny These were my requirements:
Of course none of these requirements are hard requirements but they are nice to have. Chart.js supports all of them (last one available via an extension) If anyone have a simpler alternative in mind, I can take a look at that too. |
|
Another update (Help needed): I copied the Activity page and replace the content with graphs. I think it looks OK except for the top section where it shows dates and period selection menu (they are left-overs from Activity page). 
I obviously need to replace that top right menu with contribution type selection (commits, additions, deletions) however, I don't have any idea about how to handle it in a single page. The Activity page's menu redirects you to other endpoints and makes relevant calls to get the data. In my case, I already have the data and I just need to pass the selected option to my Vue component which draws the graphs.
I also don't know any Vue either so... I think I need a little bit of help here. Best way to help: Show me an example from this repository where dynamically selected option is passed to Vue. That's how I implemented all of this, by replicating, without knowing the details of these languages anyway :D |
|
If we want to introduce a frontend chart library but not two for this requirement and future requirements, I think we have some options below:
|
|
In my previous comment, the graphs are already drawn with Chart.js but this is also a nice list @lunny. I examined them a little bit and I might consider switching to ApexCharts because they have exactly what we need: https://github.com/apexcharts/apexcharts.js#a-little-more-than-the-basic
I still need help with the issue I mentioned in my previous comment though. (Maybe @wxiaoguang could help me) |
|
Thank you for the work on the charts. I suggest to keep the current information easily available, though. Like, make the contributors clickable easily, but also retain access to an overview of merged pull requests etc. I use this quite frequently to check what kind of activity a project has: Basic maintenance? New Features? Only users reporting bugs and no actual progress? Another suggestion: Gitea already counts not only commits / code contributions in some places like the heatmap, and more and more people think this is the right direction for the software community, some even move over because of this. Maybe we can have an activity overview which does not only count code contributions, but also draw different kinds of contributions (in different colour), so you can check at a glance how the amount of commits, issues and pull requests change over time. Maybe even separated in opened / fixed ... |
|
Can't really comment on chart libraries but as long as you're lazy-loading them with apexcharts does look pretty well-suited to the task yes. |
I am glad to help (if it is in my knowledge), but at the moment, I haven't got the point, the questions (experience with Go/Vue) seems general.
There are some Vue components, the data could be passed by either:
|
@fnetX thanks for the suggestions. I created an endpoint which returns contributors' commits, additions and deletions for each week. I think this data can also be used to generate code frequency graph. I am not planning to implement it for this PR though as it is out of scope.
@silverwind, I don't do any And @wxiaoguang, is there a way to pass some property with pageData and not trigger a re-render of whole page? Fetching data is expensive so in Go file, I fetch all the data I need and pass it to Vue via pageData. When user change selection, I don't want to fetch data again. 
Here, I have all the data for commits, additions and deletions (1 expensive call). If "commits" option is selected I draw graphs with commits data. When user change selected option to something else I just need to change the data I am feeding to graphs. Hope this makes sense and clears up the confusion. |
If you want to get some new data without re-rendering, then I think the only way is "fetch" |
Definitely do it. If you don't code-split off the chart library with |
|
I opened a pull request: #27882. It would be nice if I can get some review and help from folks following this thread. @silverwind I just saw your comment. OK, I will look into that 👍 |
Continuation of #25439. Fixes #847

Before:
<img width="1296" alt="image"
src="https://github.com/go-gitea/gitea/assets/32161460/24571ac8-b254-43c9-b178-97340f0dc8a9">

----
After:
<img width="1296" alt="image"
src="https://github.com/go-gitea/gitea/assets/32161460/c60b2459-9d10-4d42-8d83-d5ef0f45bf94">

---
#### Overview
This is the implementation of a requested feature: Contributors graph
(#847)

It makes Activity page a multi-tab page and adds a new tab called
Contributors. Contributors tab shows the contribution graphs over time
since the repository existed. It also shows per user contribution graphs
for top 100 contributors. Top 100 is calculated based on the selected
contribution type (commits, additions or deletions).

---
#### Demo
(The demo is a bit old but still a good example to show off the main
features)

<video src="https://github.com/go-gitea/gitea/assets/32161460/9f68103f-8145-4cc2-94bc-5546daae7014" controls width="320" height="240">
  <a href="https://github.com/go-gitea/gitea/assets/32161460/9f68103f-8145-4cc2-94bc-5546daae7014">Download</a>
</video>


#### Features:

- Select contribution type (commits, additions or deletions)
- See overall and per user contribution graphs for the selected
contribution type
- Zoom and pan on graphs to see them in detail
- See top 100 contributors based on the selected contribution type and
selected time range
- Go directly to users' profile by clicking their name if they are
registered gitea users
- Cache the results so that when the same repository is visited again
fetching data will be faster


---------

Co-authored-by: silverwind <me@silverwind.io>
Co-authored-by: hiifong <i@hiif.ong>
Co-authored-by: delvh <dev.lh@web.de>
Co-authored-by: 6543 <6543@obermui.de>
Co-authored-by: yp05327 <576951401@qq.com>
Continuation of go-gitea#25439. Fixes go-gitea#847

Before:
<img width="1296" alt="image"
src="https://github.com/go-gitea/gitea/assets/32161460/24571ac8-b254-43c9-b178-97340f0dc8a9">

----
After:
<img width="1296" alt="image"
src="https://github.com/go-gitea/gitea/assets/32161460/c60b2459-9d10-4d42-8d83-d5ef0f45bf94">

---
#### Overview
This is the implementation of a requested feature: Contributors graph
(go-gitea#847)

It makes Activity page a multi-tab page and adds a new tab called
Contributors. Contributors tab shows the contribution graphs over time
since the repository existed. It also shows per user contribution graphs
for top 100 contributors. Top 100 is calculated based on the selected
contribution type (commits, additions or deletions).

---
#### Demo
(The demo is a bit old but still a good example to show off the main
features)

<video src="https://github.com/go-gitea/gitea/assets/32161460/9f68103f-8145-4cc2-94bc-5546daae7014" controls width="320" height="240">
  <a href="https://github.com/go-gitea/gitea/assets/32161460/9f68103f-8145-4cc2-94bc-5546daae7014">Download</a>
</video>

#### Features:

- Select contribution type (commits, additions or deletions)
- See overall and per user contribution graphs for the selected
contribution type
- Zoom and pan on graphs to see them in detail
- See top 100 contributors based on the selected contribution type and
selected time range
- Go directly to users' profile by clicking their name if they are
registered gitea users
- Cache the results so that when the same repository is visited again
fetching data will be faster

---------

Co-authored-by: silverwind <me@silverwind.io>
Co-authored-by: hiifong <i@hiif.ong>
Co-authored-by: delvh <dev.lh@web.de>
Co-authored-by: 6543 <6543@obermui.de>
Co-authored-by: yp05327 <576951401@qq.com>
(cherry picked from commit 21331be)
|
Automatically locked because of our CONTRIBUTING guidelines |
Implement contributor graphs: https://github.com/go-gitea/gitea/graphs/contributors
Want to back this issue? Post a bounty on it! We accept bounties via Bountysource.
The text was updated successfully, but these errors were encountered: