Template Variable Defaults Blanked When Using Data Links Back to Same Dashboard #35471
Comments
|
Thought I'd share a quick animated GIF showing this... Makes panel and datalinks unusable in this version if you're using variables.
|
|
I have a feeling we have had this exact same issue before. |
|
@lux4rd0 If you have the default values and then click the link, do the values disappear? |
|
If I launch the page - then click on the link, the values do not disappear. I tried a few other things as well. Change the time frame and click the link - values do not disappear. I think it just happens to do with when I change a variable. I did a few other tests where I changed the variable - then used the link - and it reset back as normal, and then quickly wiped all of the variables out to empty. (but still in the drop-downs - just not selected.) |
|
@tskarhed I just tested main and it's almost right. In my case - three of the four variables reset correctly - one that defaults to "All" still blanked out a second after hitting the anchor link.
Should be:
Variable definition:
Trying to troubleshoot what's different in these variables... |


|
Actually - looking at this again - a few other variables aren't right either. It's resetting to first available in the variable - not what's defaulted in the "save variables". My "Interval" variable is set by default to 12h (saving) but gets reset to 1d, even though it was "pushed" to 1h by my link. So maybe the fix is ignoring the saved defaults? |
|
This is on first page load: Turns into this on clicking the link (which is not what's stored as my saved defaults): |
|
I've also noticed that if I change a drop-down variable, move to something like the folder view (clicking on the top folder path next to the Dashboard name) then choose the same dashboard, it'll blank out the variables that were defined to be "save as default". I can repeat this on the Play site: https://play.grafana.org/d/000000137/influxdb-group-by-variable The groupBy default is "datacenter".
Change it to something else like "source"
Click back up on the folder view to take you back to "Influx DB"
Then choose the "InfluxDB Group By Variable" again, and the groupBy is blank.
I've done it with all of the other examples in the InfluxDB example folder, and it obviously can get pretty drastic...
I see there's a PR for this - #36839 - but since it looks to be failing on something besides a datalink pushing a URL - not sure if that would fix things in this case either... Thanks for taking a look at this! |


|
Hi everyone, I've looked into this issue a bit and I think the root cause is that we've migrated to React Router. Previously we did a full page reload and so the variables would auto load the defaults. But now we're just changing the variable values when the user clicks a panel link. I'm looking into a solution for this. |
|
@hugohaggmark I just pulled the 8.1.2 release today and I'm still having the issues with blanked variables.
Where Station Name and Forecast Day should have variables in them. (Station Name has an "All" and Forecast Day has an empty default). Can we revisit this? Thanks! |

|
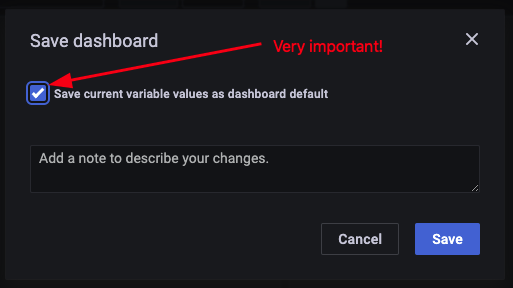
@lux4rd0 what does your dashboard json look like for those variables? Try the following:
If you still have an issue ping me again. Thank you 🙏 |
|
Thanks, @hugohaggmark - I still had one "default" that wasn't added to my JSON for Station Name: Before: After: The other variable for Forecast Day shouldn't have a saved default, however - since it's dynamically generated. I'll see how that gets impacted - but I don't see a change in the JSON for that variable. I Will review it tomorrow as the date progresses. I think this looks good though. :) Thanks! |
What happened:
When creating a data link to essentially "reset" any change in drop-down variables back to the dashboard defaults (On Dashboard Load) - the dashboard loads correctly (with defaults) - and then immediately blanks out all variables defaults.
What you expected to happen:
Not sure why there's an additional refresh of the variables after load that blanks out any defaults. It should not blank out the defaults (on dashboard load).
How to reproduce it (as minimally and precisely as possible):
Dashboard with data link:
That pushes new variables back into the same dashboard:
/d/${__dashboard.uid}/?var-forecast_day_num=${__data.fields["day_num"]}&var-display_date=${__data.fields.day_start_local}&from=now%2B${__data.fields.day_relative}d%2Fd&to=now%2B${__data.fields.day_relative}d%2Fd&var-interval=1h&${station_name:queryparam}&${tz:queryparam}Dashboard presented with new parameters correctly.
Click on the panel link to "reset" back to the dashboard URL without any pushed variables (top Left panel has a panel link):
URL: /d/${__dashboard.uid}Takes me back to the same dashboard as expected and proper... And then a split second later, removes all "on dashboard load" variables to:
Them all being blank. (The variables are in the dropdowns - just the default selection has been wiped out...)
Anything else we need to know?:
Rolled back to testing on 7.5.7 and this works as expected.
Environment: Linux Docker x64
The text was updated successfully, but these errors were encountered: