new release 1.4.1 breaks FlowCharting graph #145
Comments
|
Interesting... can you take a snapshot and attach it to this issue? https://grafana.com/blog/2022/10/17/grafana-9.2-release-troubleshooting-grafana-panels-with-a-new-support-feature/ |
|
Also, what version of Grafana are you on (and did that remain the same)? |
|
Hi I mentioned in the post. It is 9.2.2 version. Thanks That links take me to the post, not an issue. Also what snapshot would you like me to attach. I don't have anything besides I already snapped :). Thanks |
|
Got it, so you used 9.2.2 for both 1.2.6 and 1.4.1 versions of TwinMaker. Ha, I got similarly confused! That post shows you how to make a snapshot, it's a new feature in 9.2. Once done, see if you can attach that to this same issue. |
|
Unfortunately, we run the Grafana on the local servers so you won't get access to snapshot URLs. Unless I misunderstood that feature. I published to snapshots.raintank.io. But the FlowCharting plugin is not installed there. https://snapshots.raintank.io/dashboard/snapshot/ZLOmG71njLeNIPLu7XQfK9SlGiP2SVNg?orgId=2 Let me know if raintank will help you I will publish the broken chart with 1.4.1v |
|
Can I help with anything to troubleshoot this issue? |
|
@ryantxu is refering to a debug snapshot generated from the Panel > More > Get Help menu. these snapshots are self-contained and do not have a url. they can be attached to this issue. please see the video in link #145 (comment) |
|
Thanks. Files are attached and marked 1.2.6v and 1.4.1v |
|
Thanks, @ryantxu is there anything else I can provide ? |
|
@misiek303 I believe this was caused by the change to wide time series to support alerting in #135. Adding the
@ryantxu I wasn't able to get the flowchart viz to load with either of the attached examples, but it seems like it could be an issue with angular and/or the debug snapshot tool. |

|
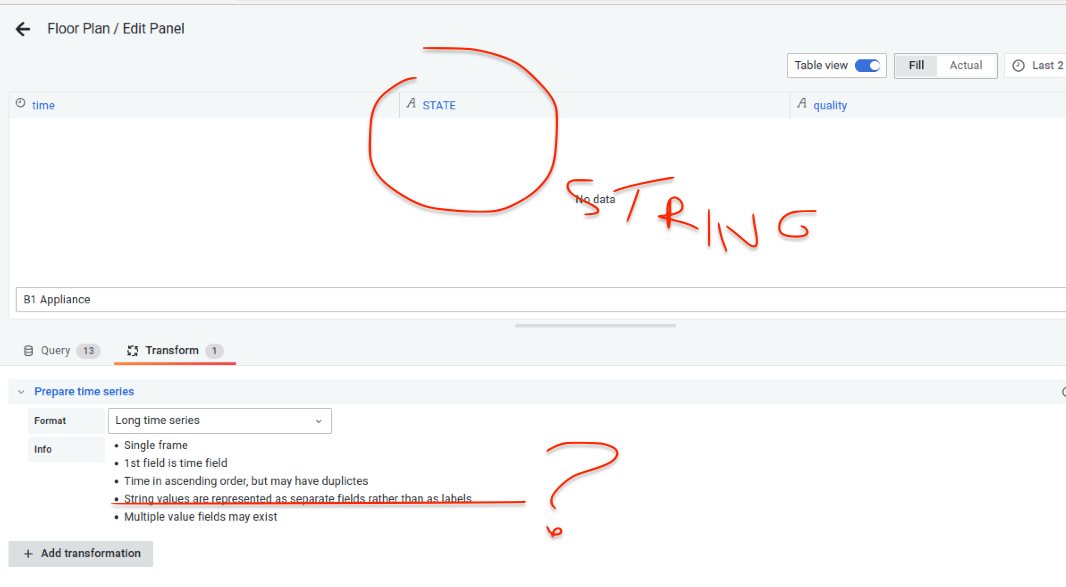
Indeed it fixes showing up all metrics in the drop-down of the FlowCharting plugin. But it breaks the string-type data.
No String values are shown
|

|
@misiek303 i see what's going on here. the transformation is expecting all queries to have at least one time column and one numeric column, but it seems like some of your queries are returning only time and string columns @ryantxu any thoughts on how to mix the two types of queries since we can't target individual queries with transformations? i guess we could add an option to format the query in the editor? |
|
Hi. Do you have any new updates? |
|
Hi. Are you working on this issue? can I get an update? |
|
|
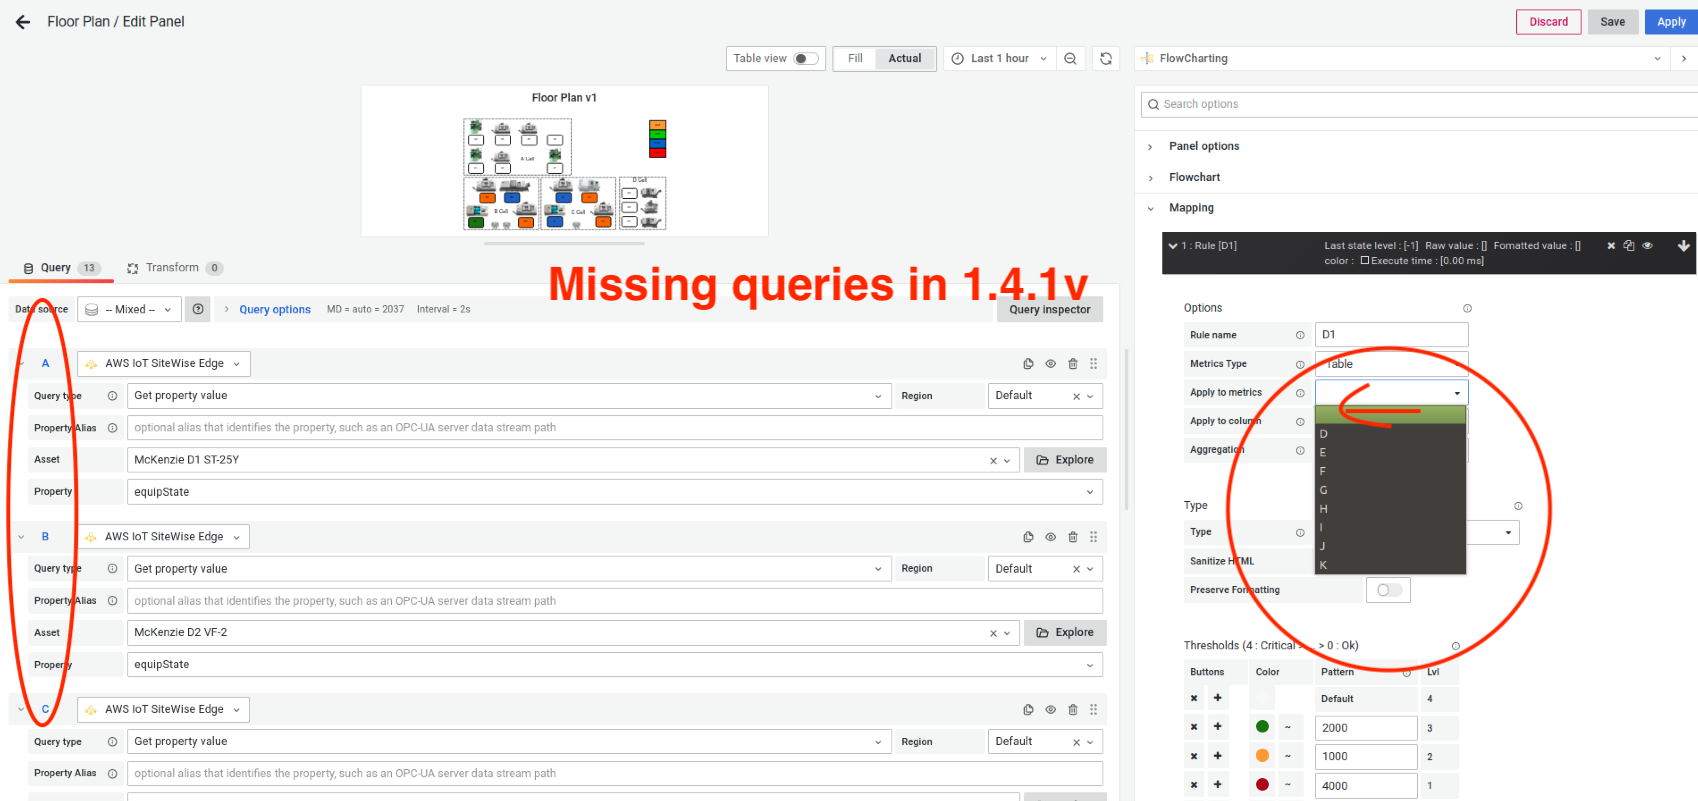
After the upgrade from 1.2.6 to 1.4.1 FlorCharting graph broke some of the queries. Some of the queries are not available in the Mapping option -> Apply to column. The Property value is an INTEGER.
Grafana 9.2.2 version.
Before the upgrade

After the upgrade
Also after the upgrade, something else changed. The label of the fields.
This is how the Pie chart should look, showing the percentage and State text.

And this is what happened after upgrade

Is there any potential fix for that or a known issue that is going to be addressed soon?
Thanks
The text was updated successfully, but these errors were encountered: