Note
This project covers only the first seven months of 2020 since the original data set only contains data from January 2020 until July 2020.
The COVID-19 Dataset is a publicly available dataset from Kaggle, published by Devakumar K.P. on January 21, 2020. It provides information on the cumulative count of confirmed, death, and recovered cases of COVID-19 from different countries since January 2020. This dataset encompasses details such as the country, date, longitude, latitude, the cumulative number of confirmed cases, cumulative number of confirmed deaths, cumulative number of recoveries, and WHO Region of the cumulative cases.
This data science project aims to perform exploratory data analysis on the impact of the spread of the Coronavirus. It employs various visualization techniques, such as treemaps, pie charts, and geographical maps, to visualize the data and provide insights into the progression of the pandemic over time across different regions. The resulting insights can help researchers, policymakers, and the general public to learn and better understand the dynamics of the COVID-19 pandemic and make informed decisions for their health and safety.
These are the final columns comprising the ETL pipeline's resulting data set.
- Country - Country of the recorded case(s)
- Lat - Latitude of the location
- This column is retained only for Power BI Map visualizations.
- Long - Longitude of the location
- This column is retained only for Power BI Map visualizations.
- Confirmed - Cumulative number of confirmed cases until the given date
- Deaths - Cumulative number of deaths until the given date
- Recovered - Cumulative number of recovered cases until the given date
- Active - Cumulative number of active cases until the given date
- WHO Region - The WHO Region Code of the recorded case(s)
These columns are implemented to introduce more granularity into the final data set.
- Year - Year of the cumulative report
- Month - Month of the cumulative report
- Month Name - Month name of the cumulative report
- Day of Week - Day of week of the cumulative report
- Day Name - Day name of the cumulative report
- Month Short Name - Short name of the month the cumulative report
Cumulative Trends
What is the monthly trends of cumulative case outcomes?
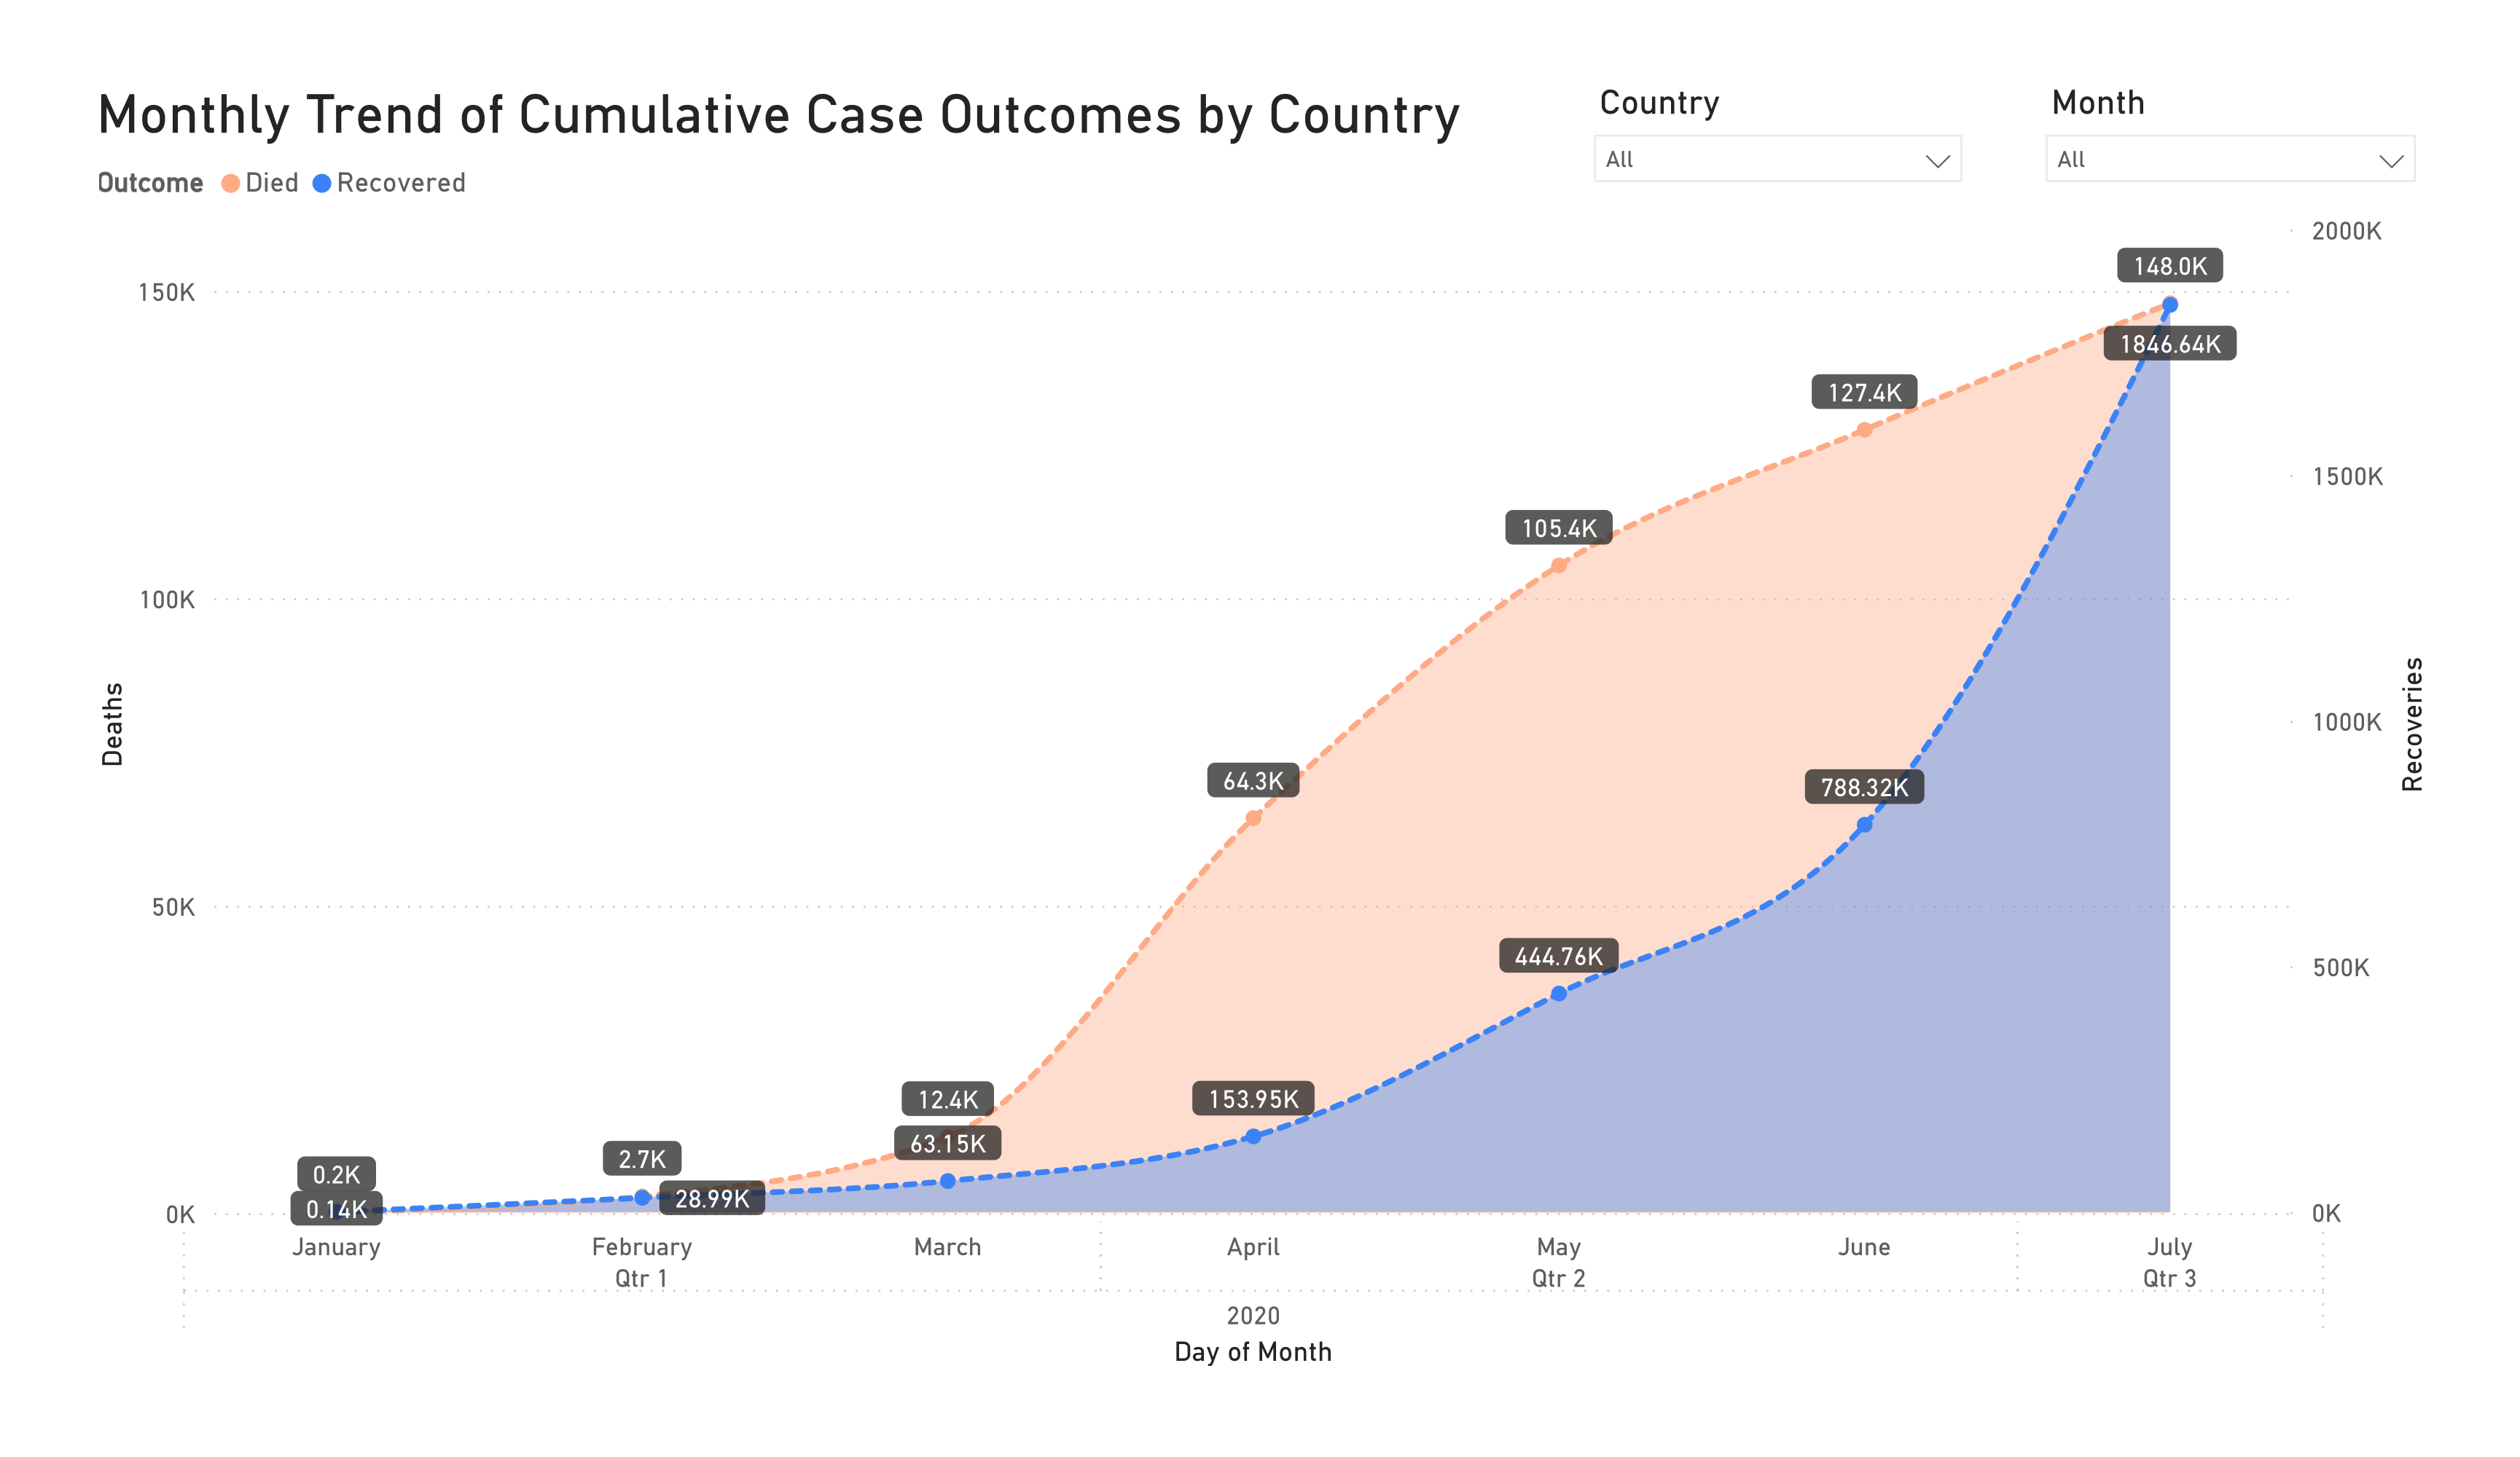
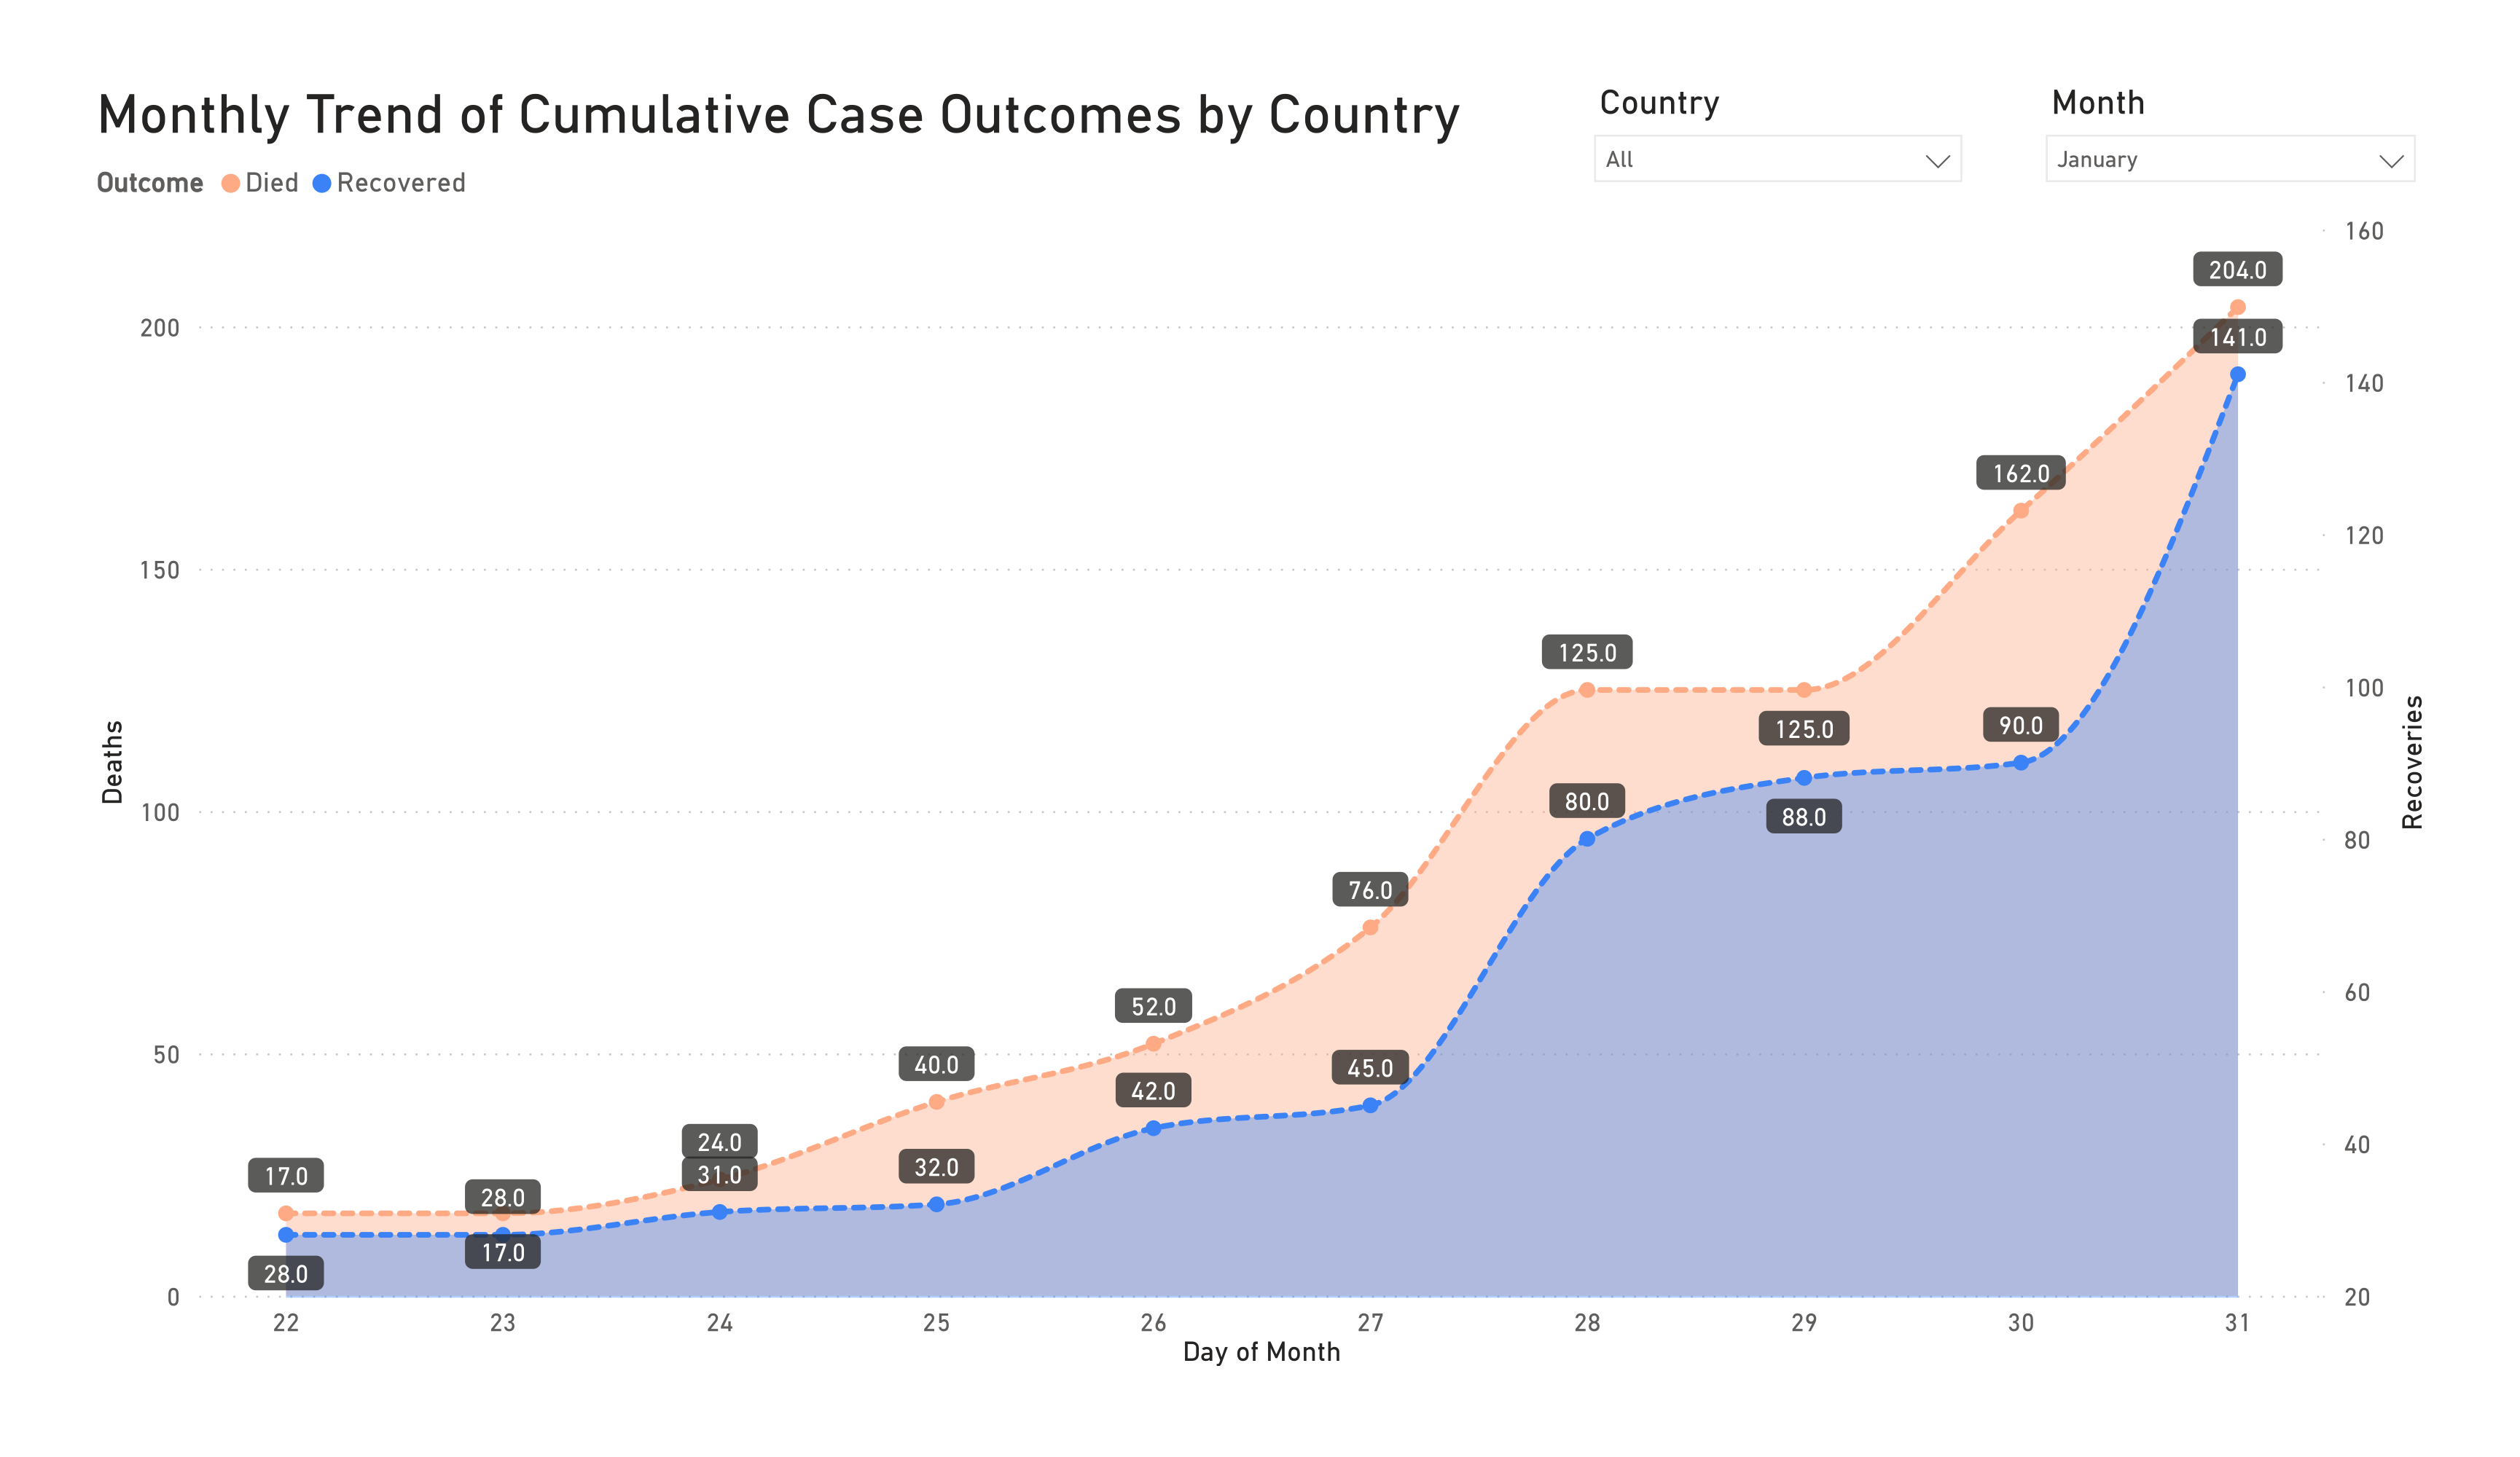
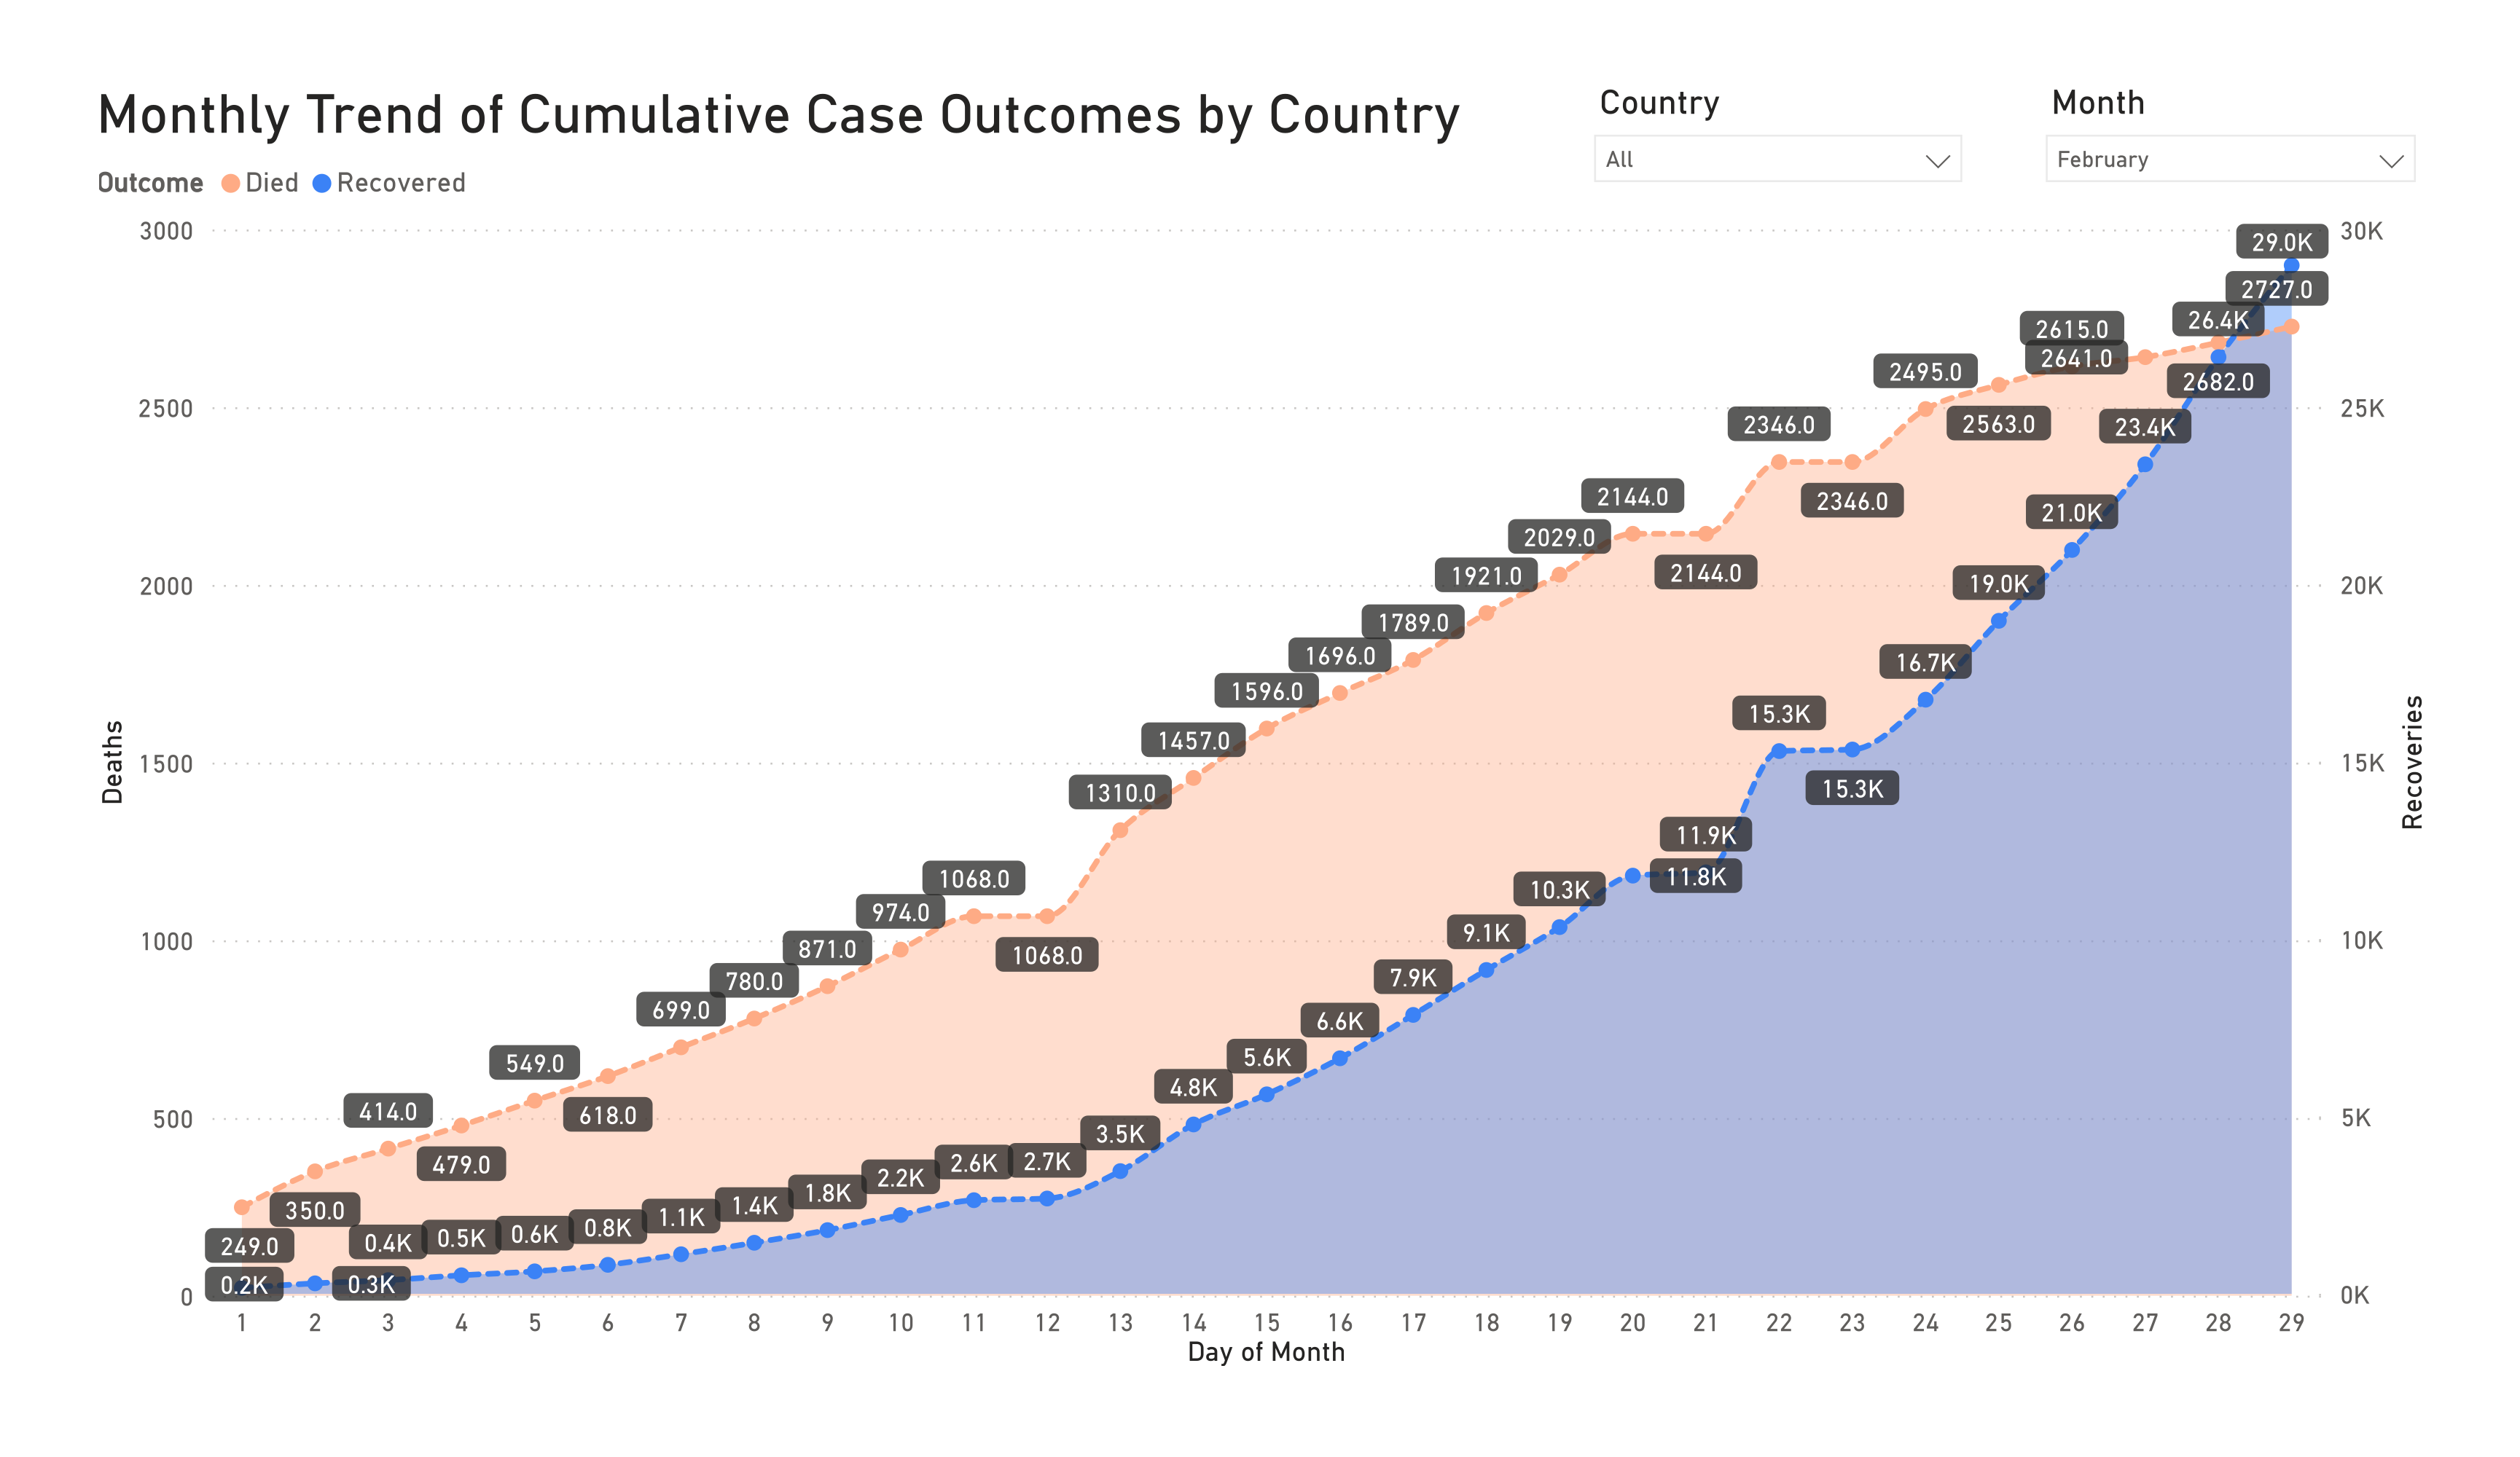
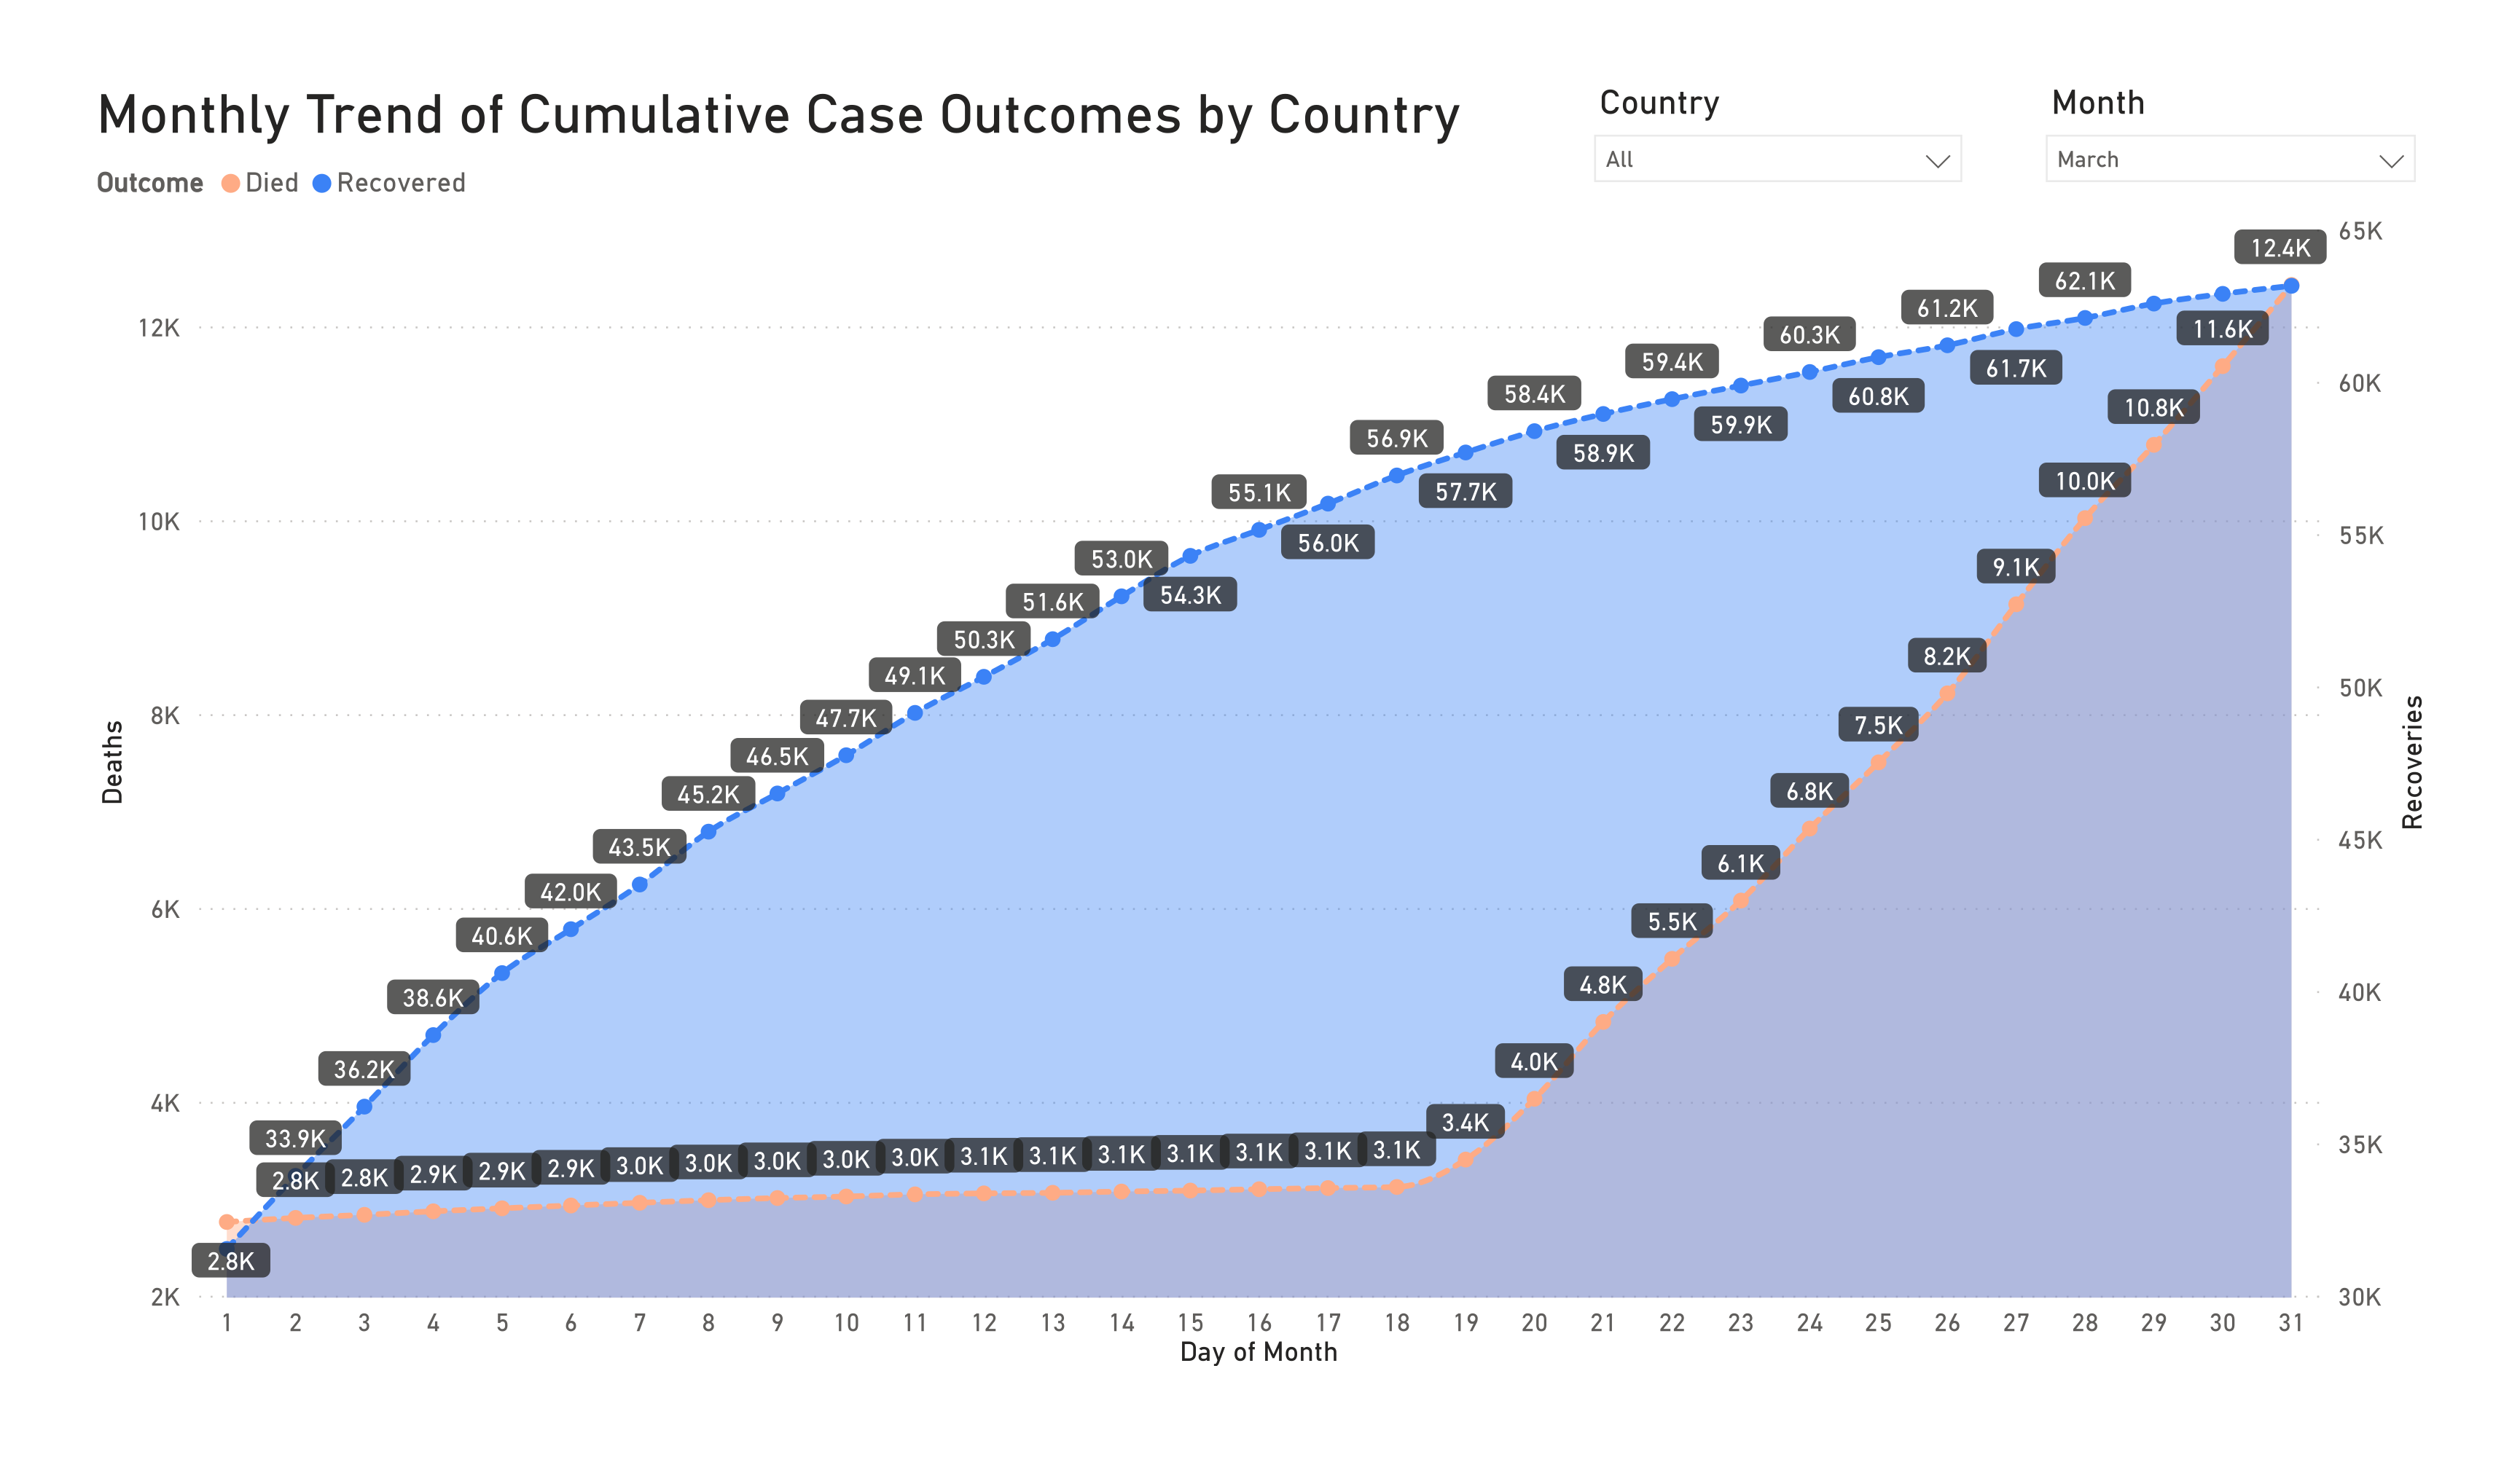
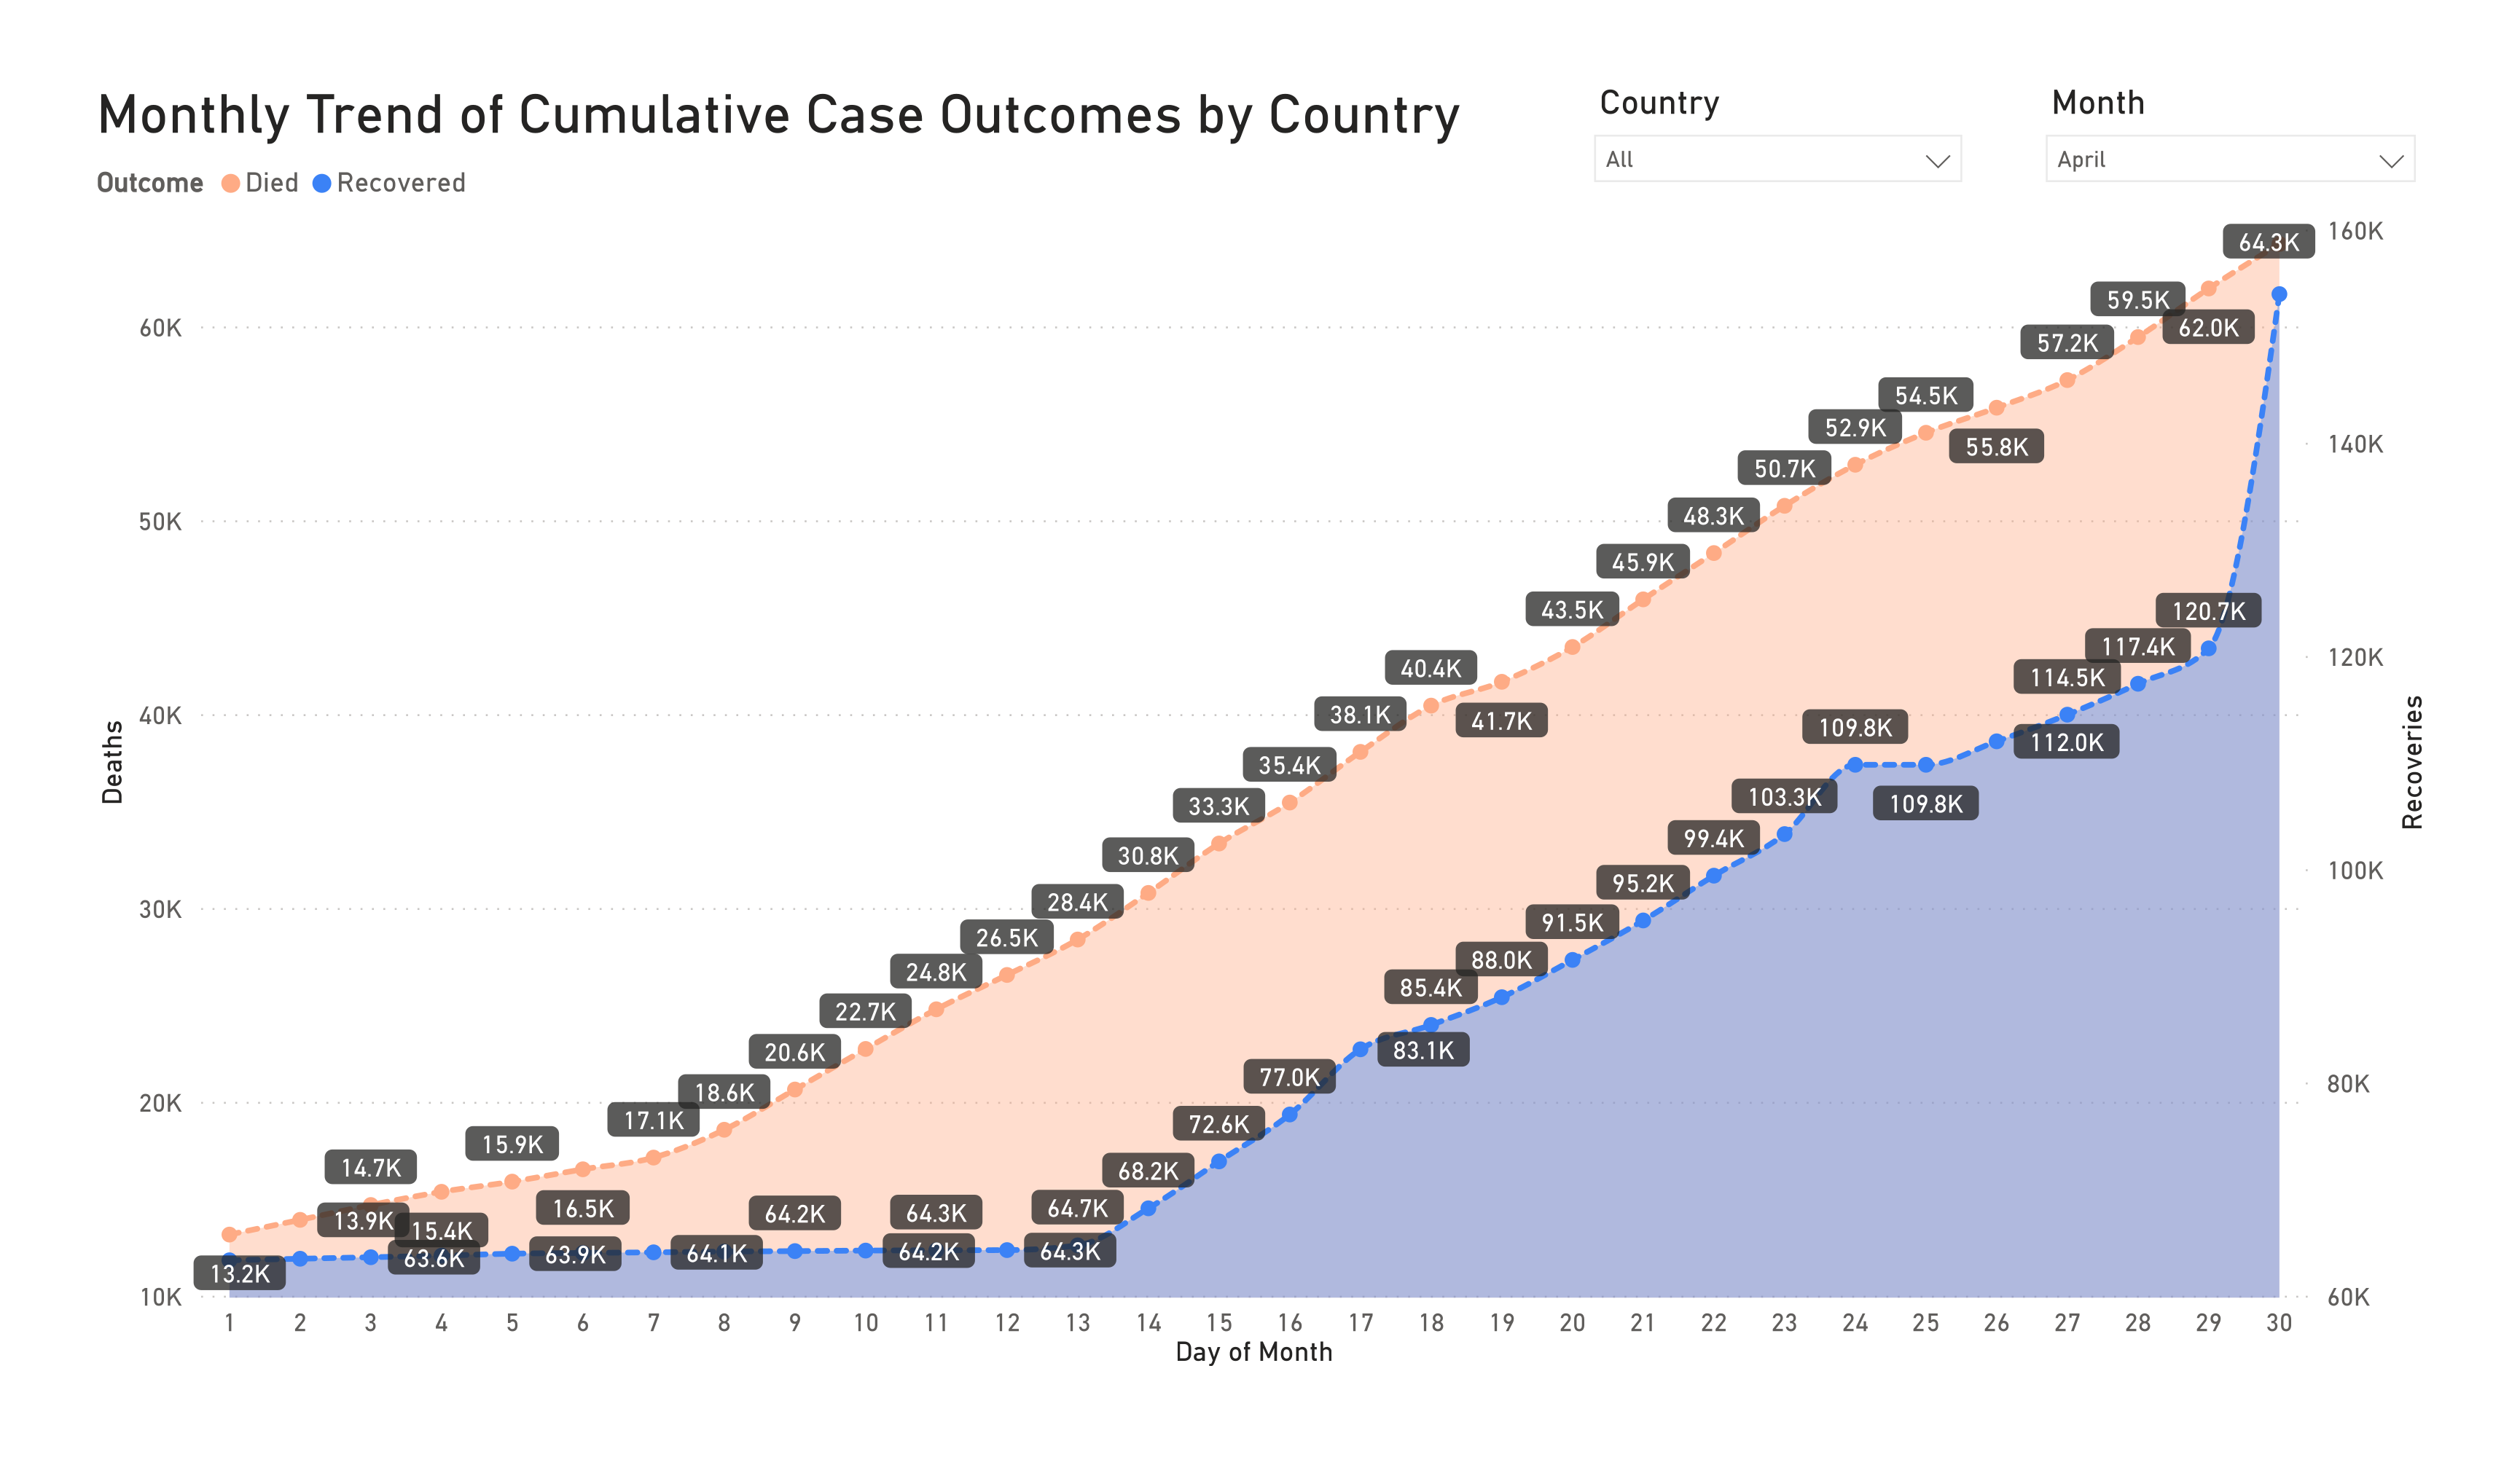
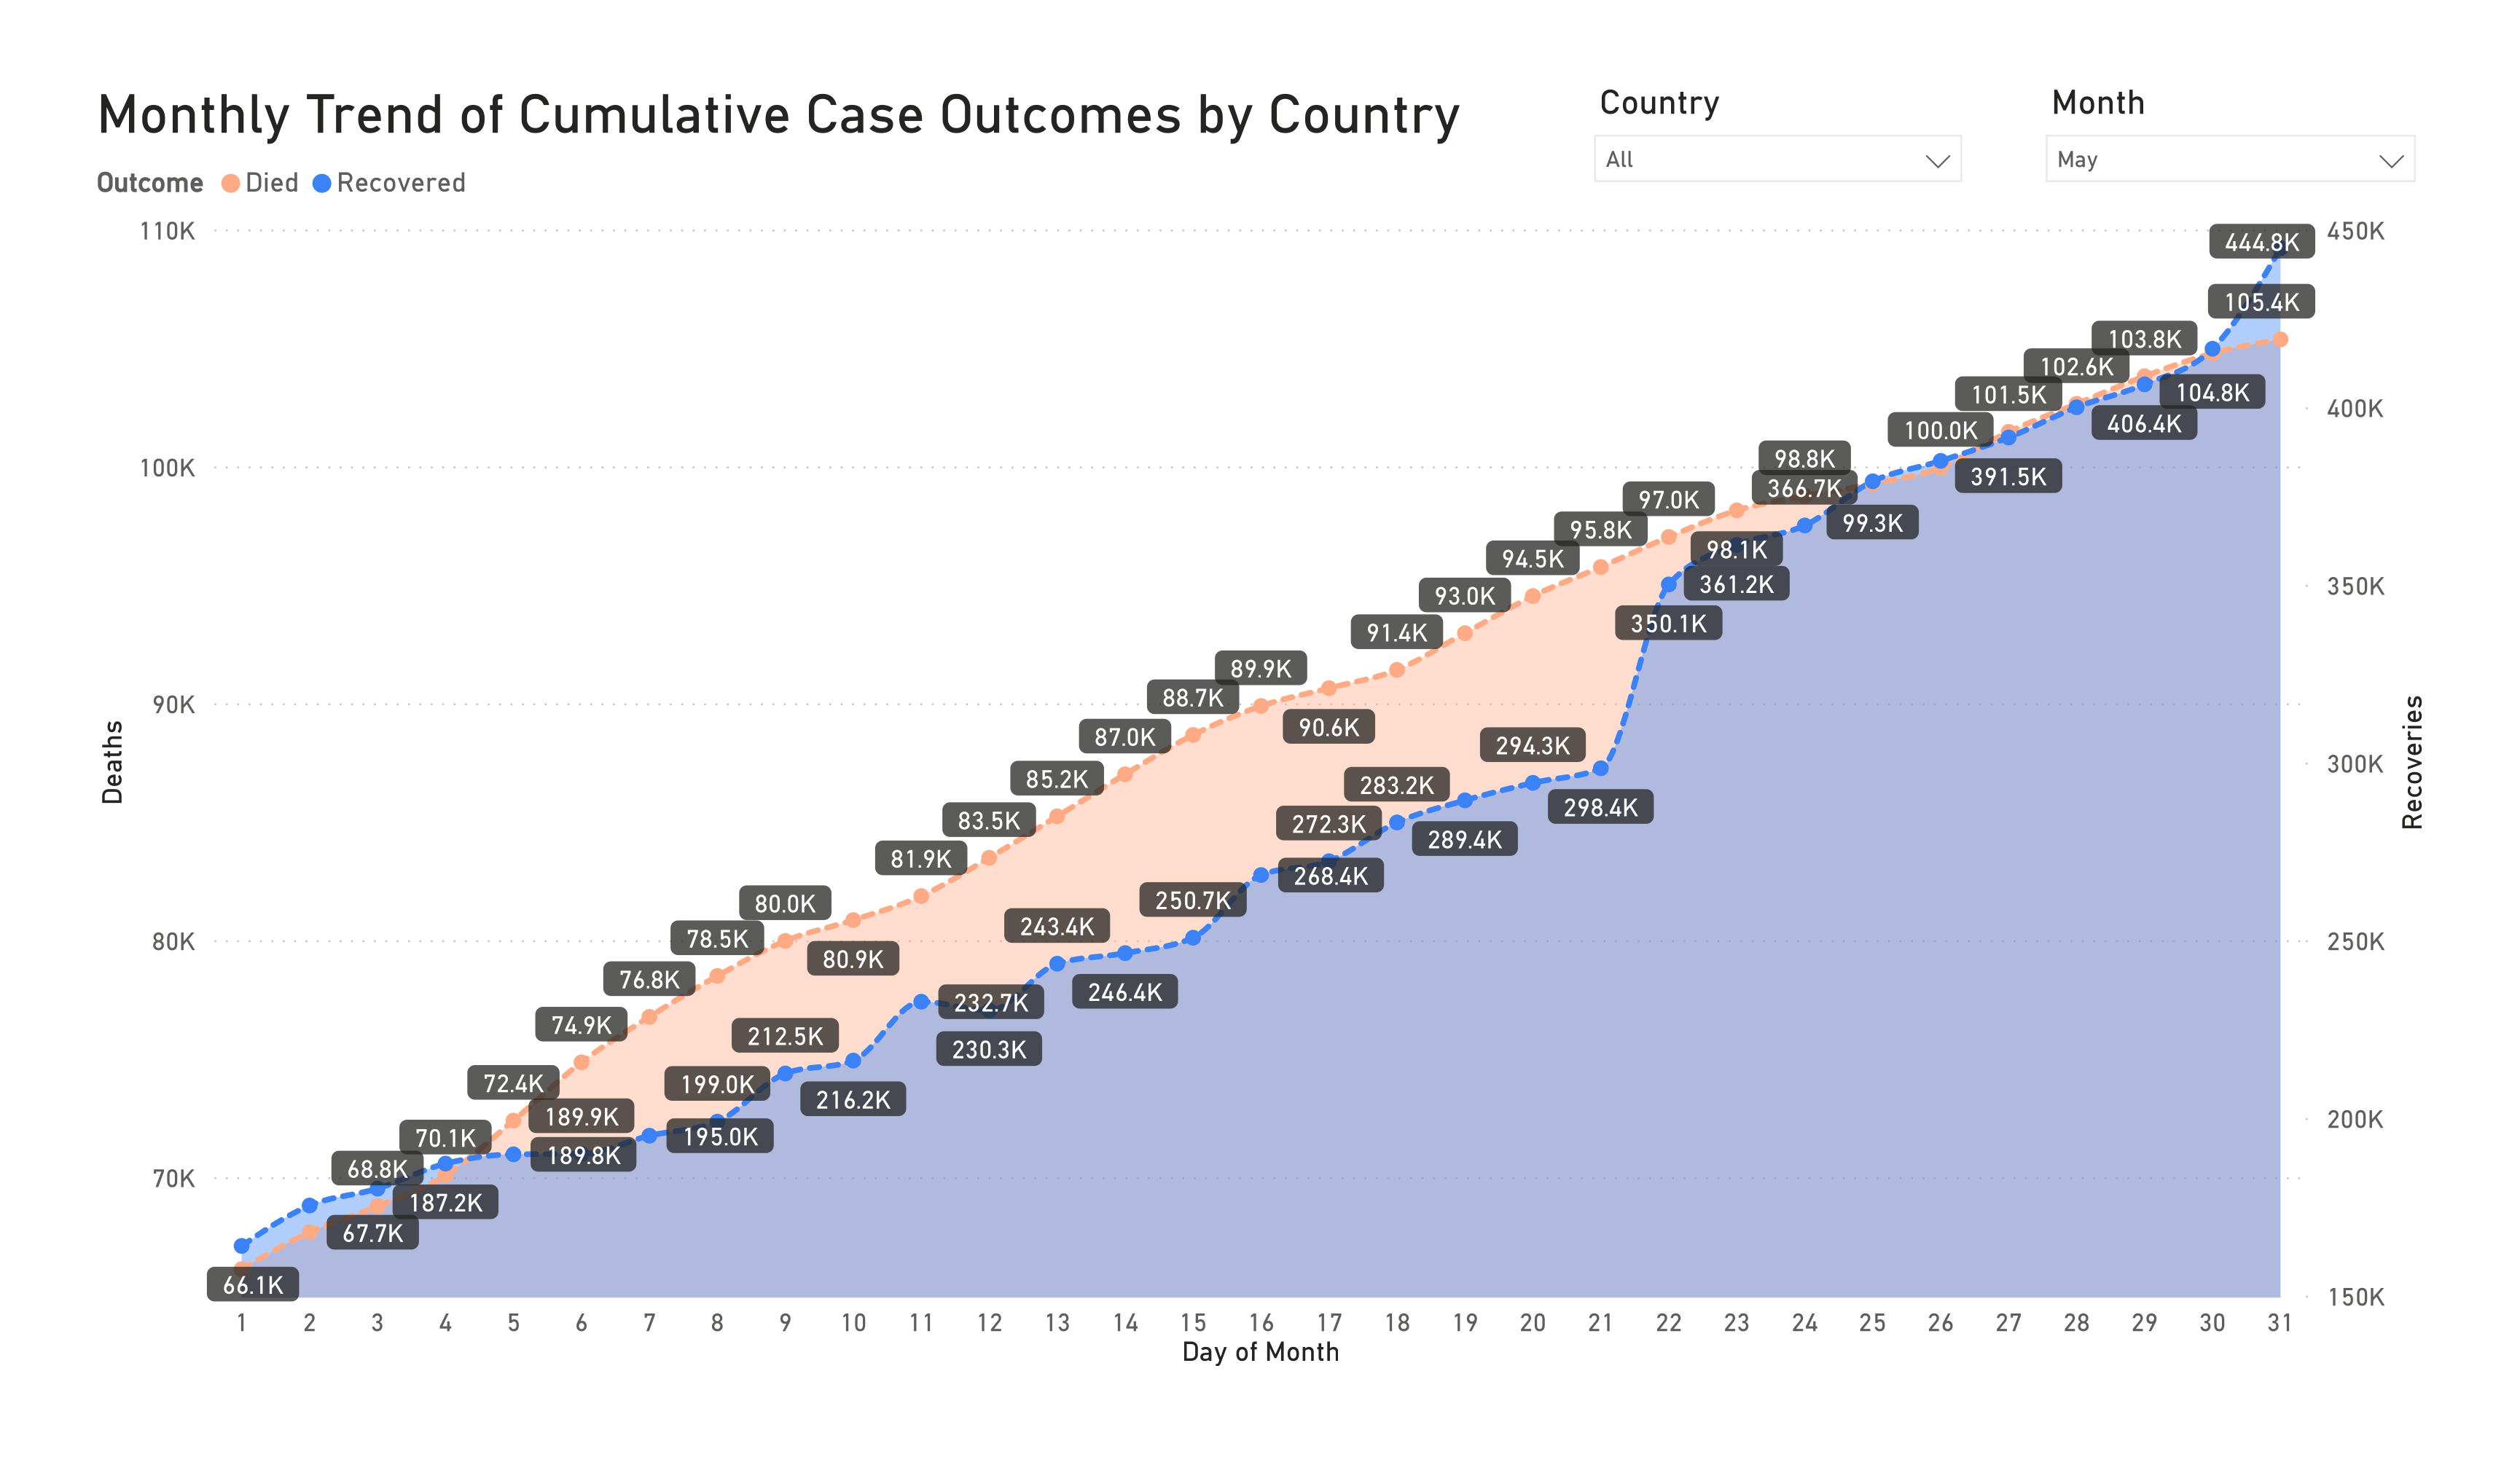
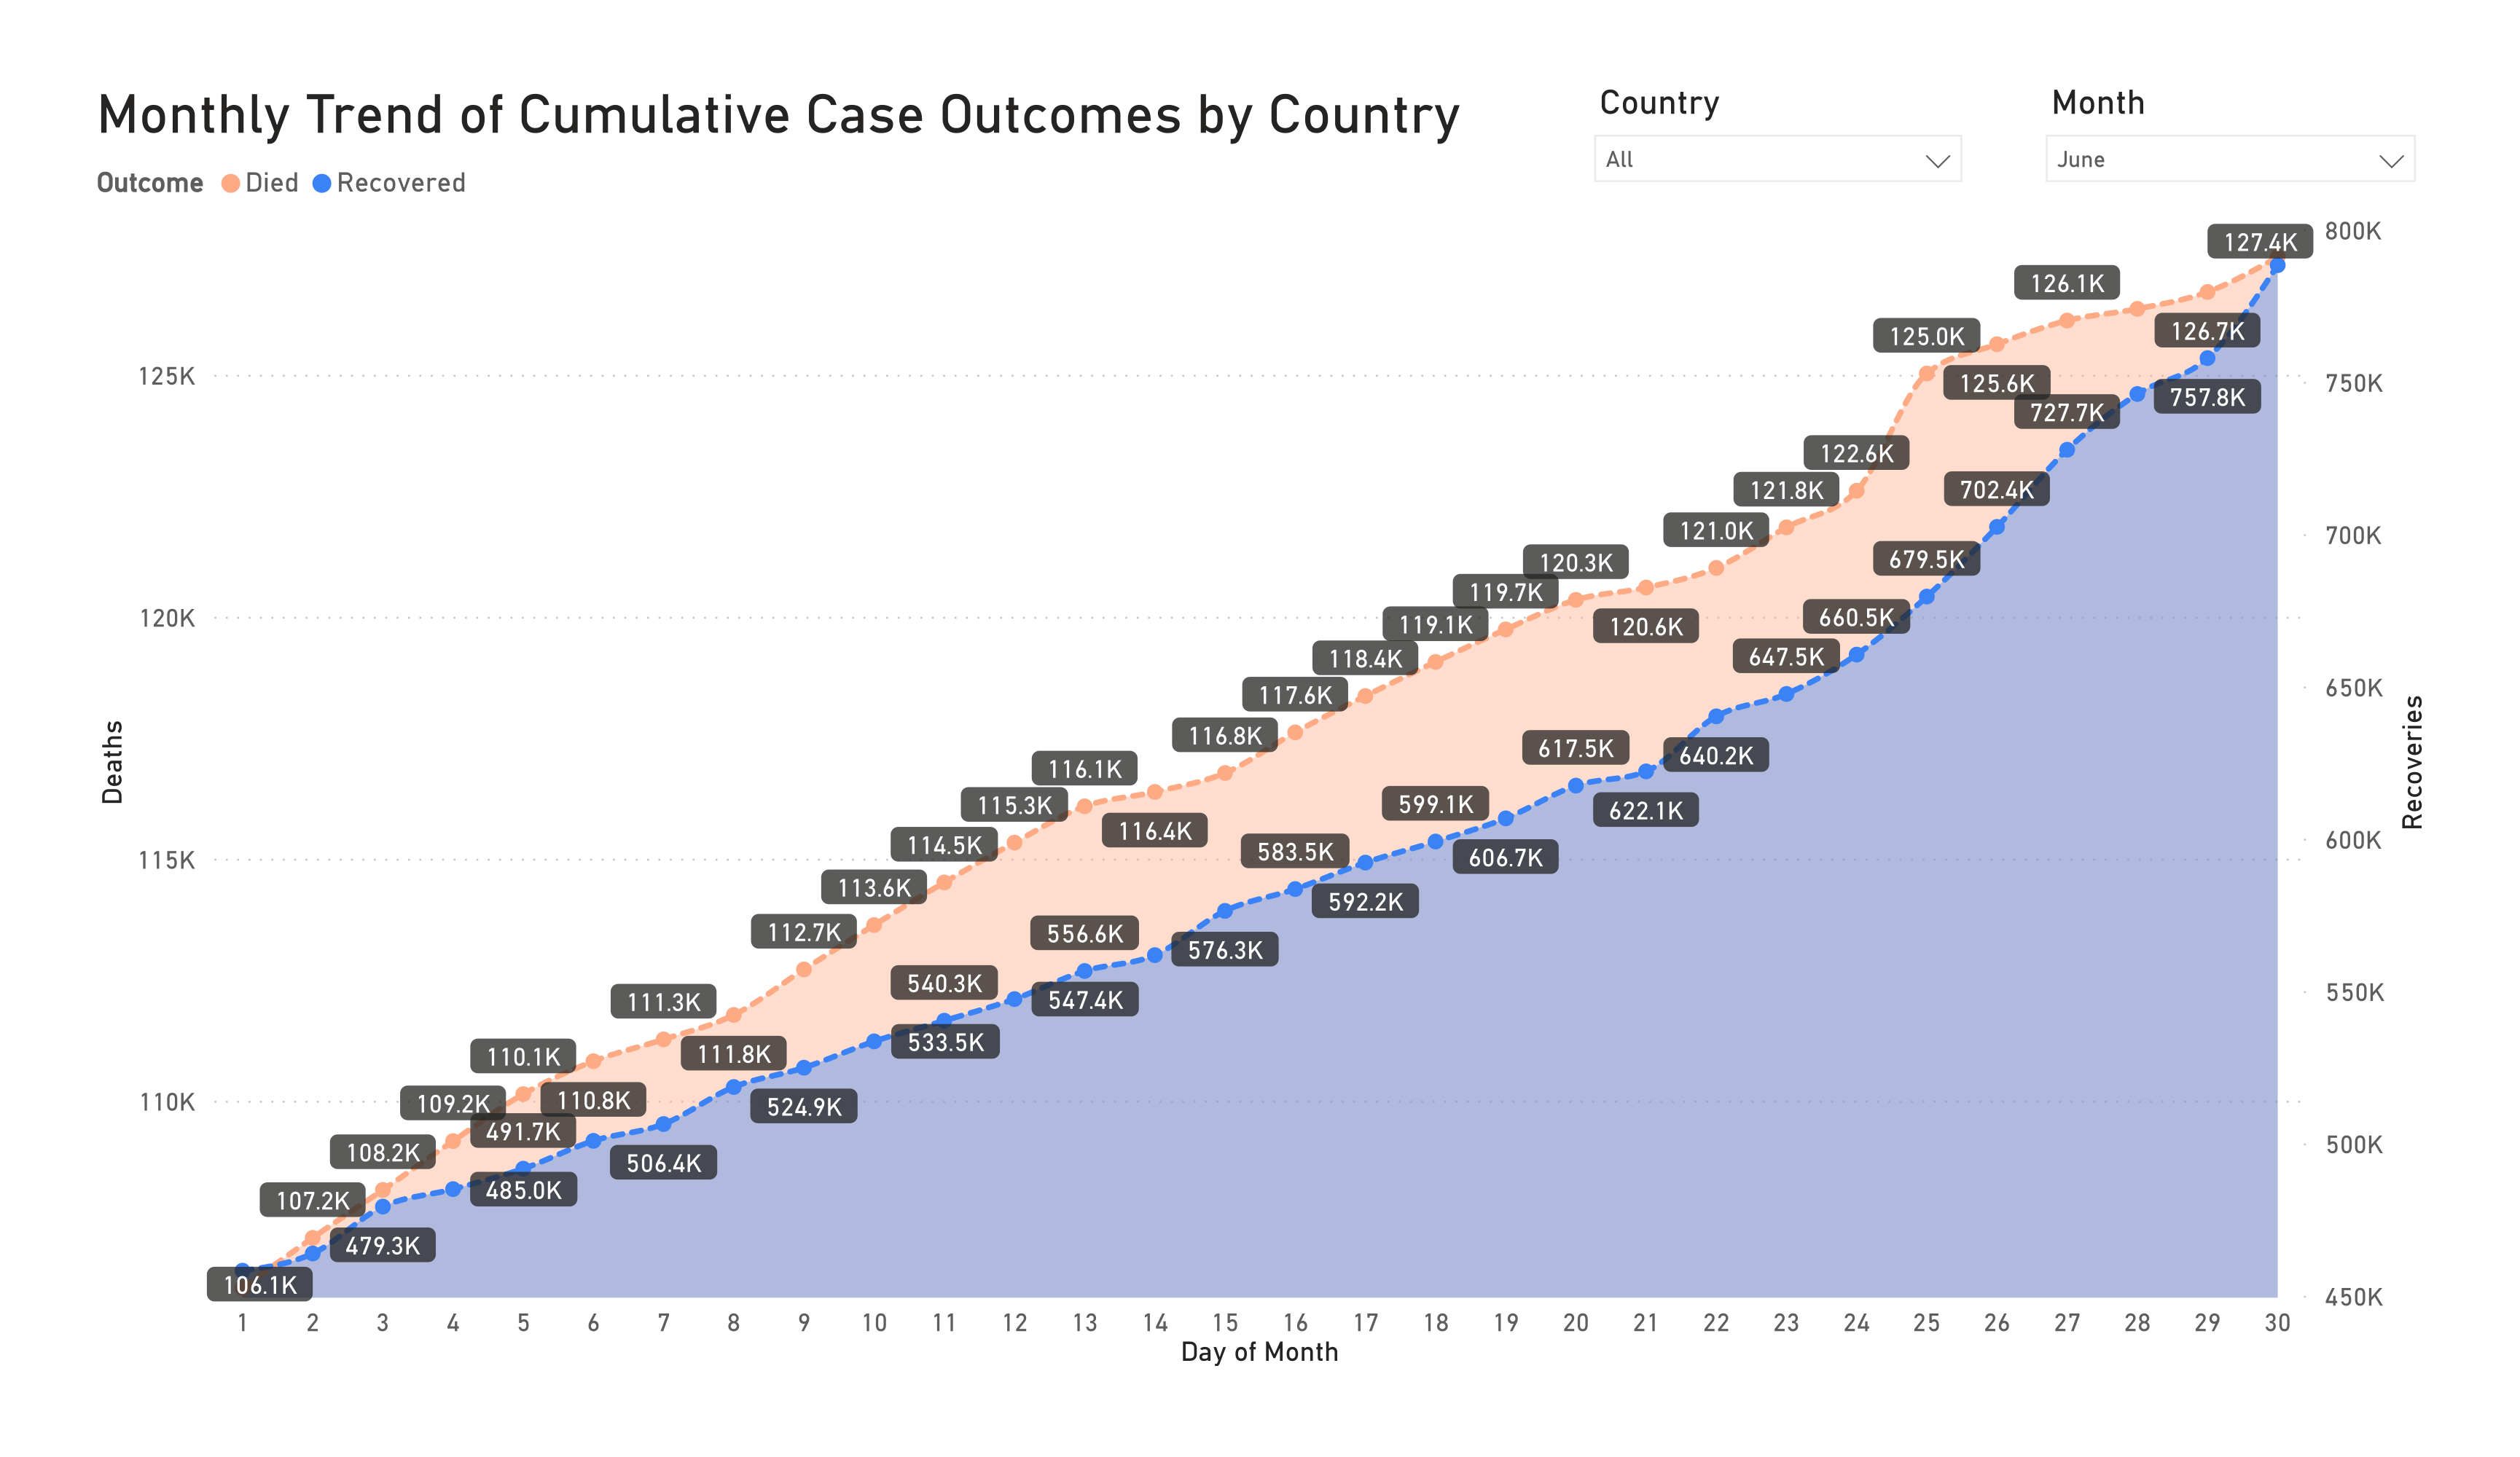
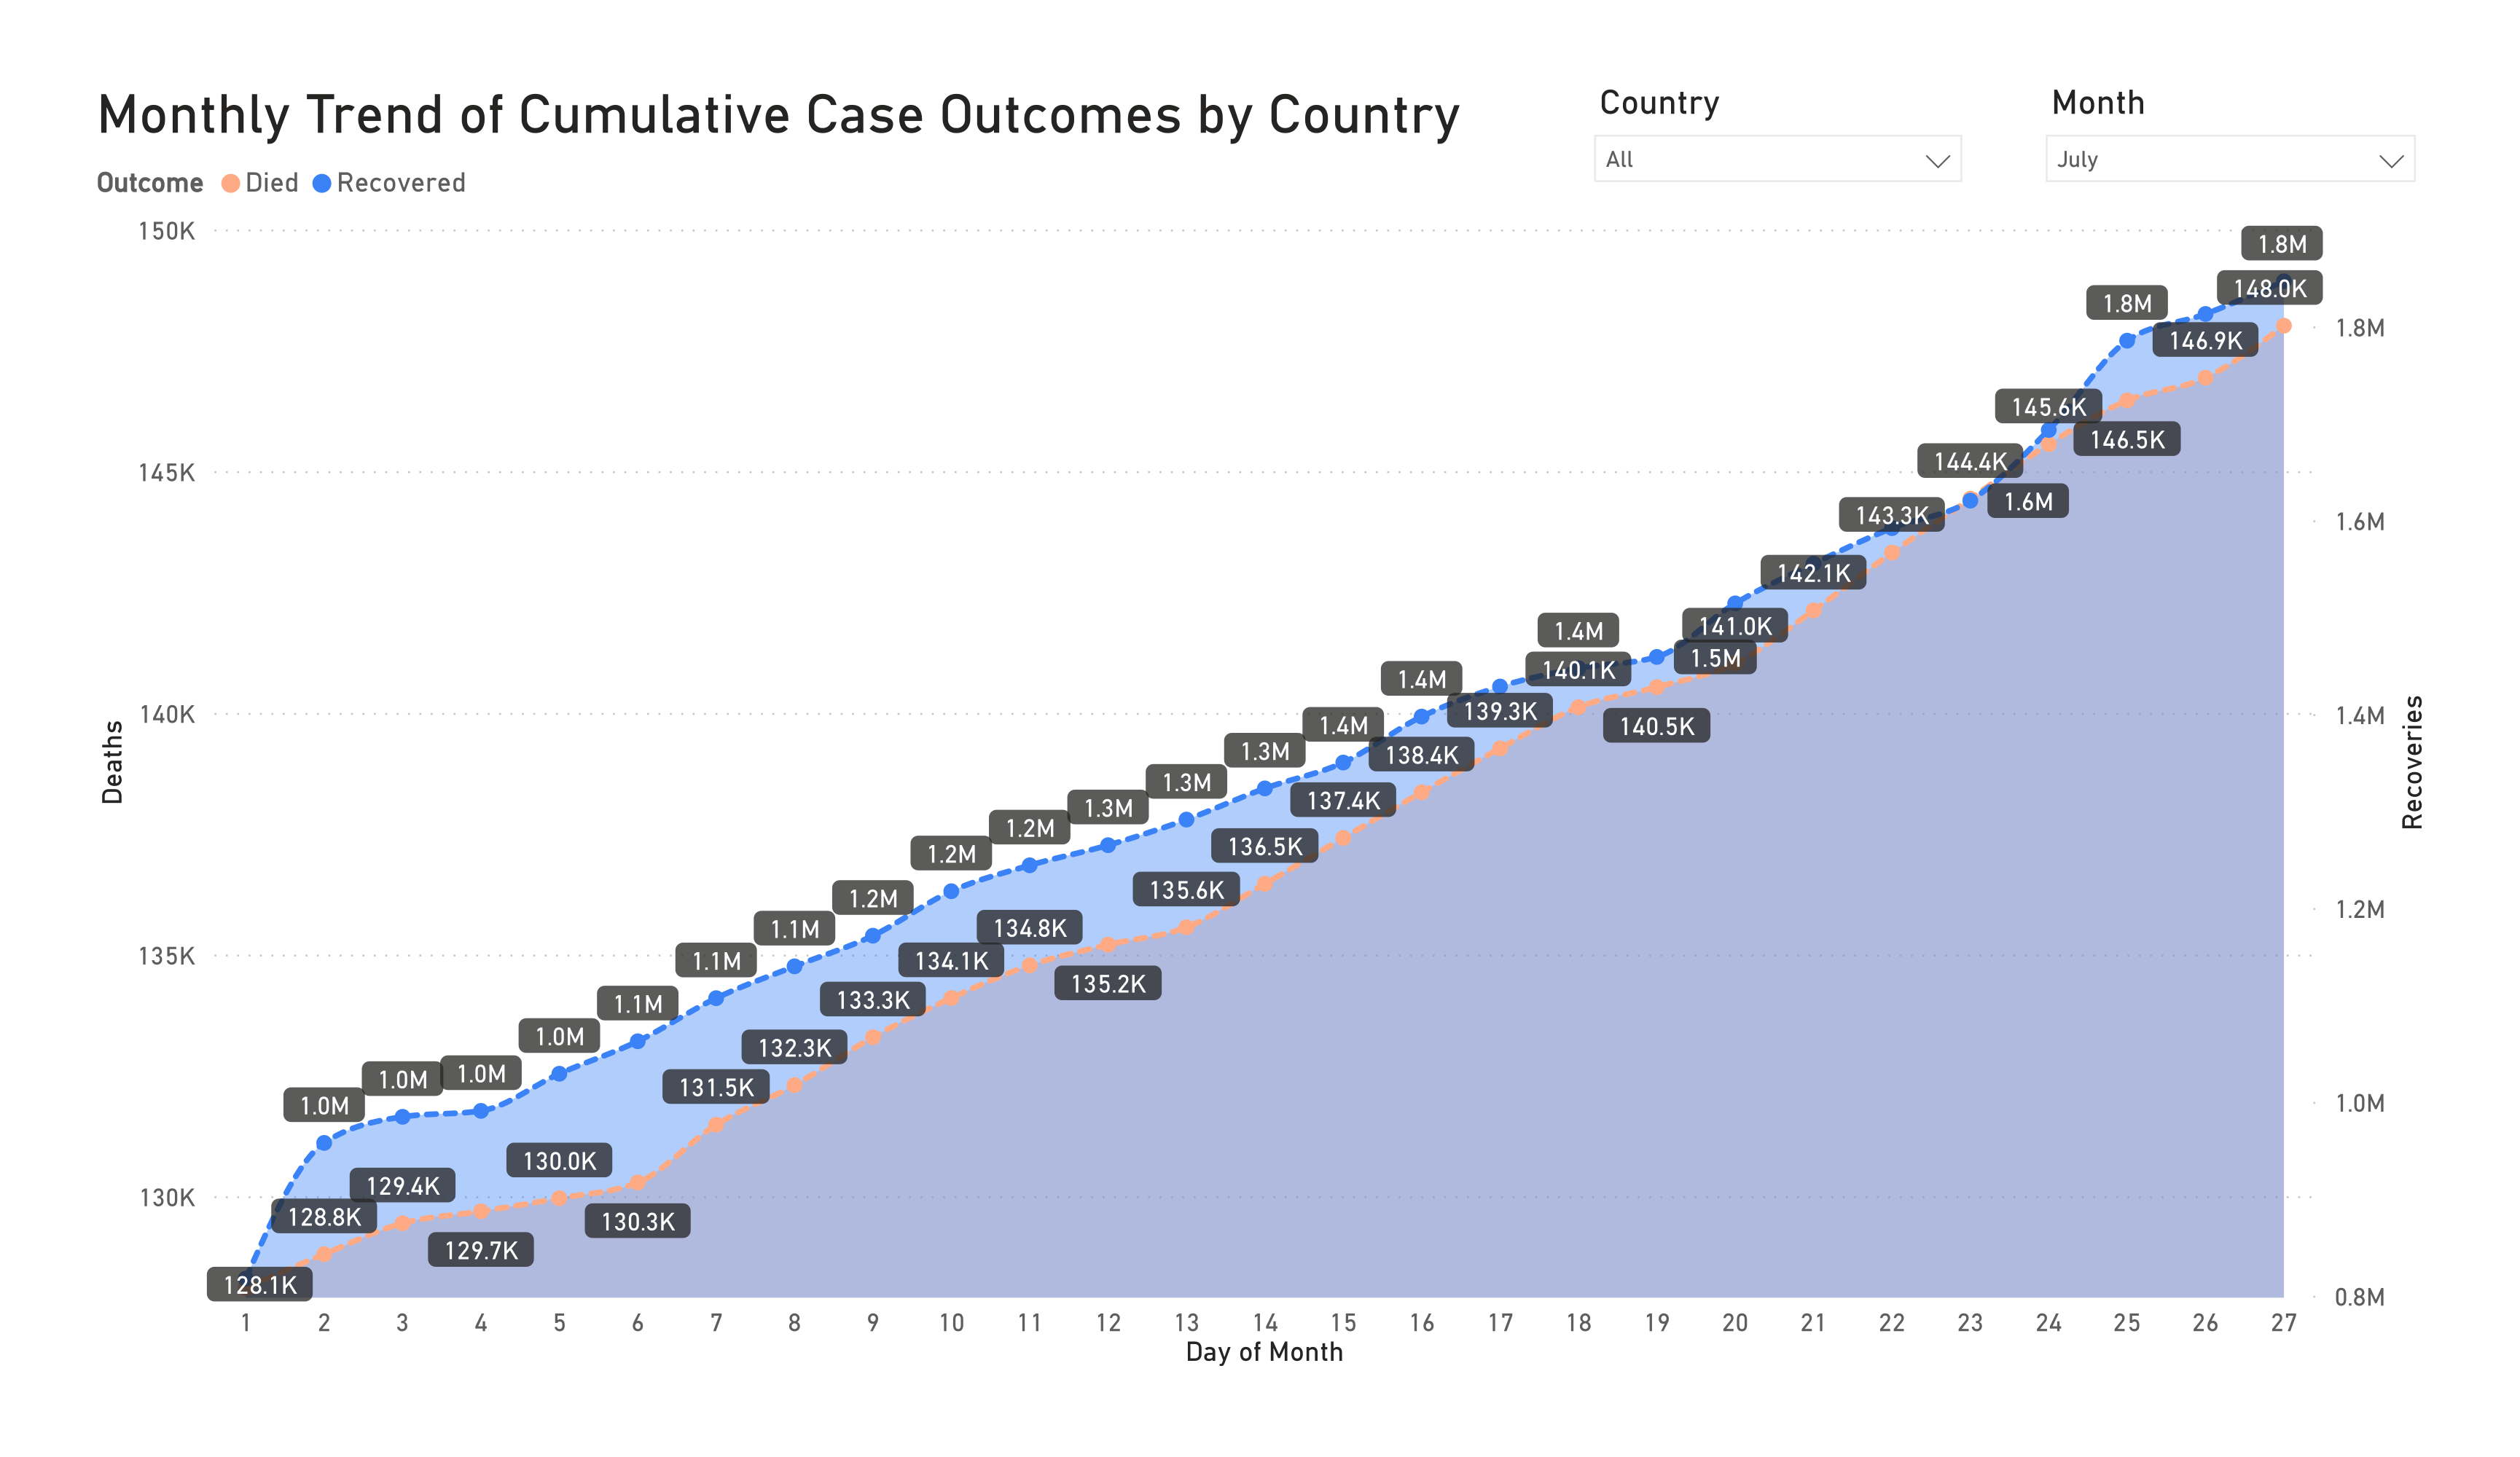
Lorem ipsum dolor sit amet, consectetur adipiscing elit, sed do eiusmod tempor incididunt ut labore et dolore magna aliqua. Ut enim ad minim veniam, quis nostrud exercitation ullamco laboris nisi ut aliquip ex ea commodo consequat. Duis aute irure dolor in reprehenderit in voluptate velit esse cillum dolore eu fugiat nulla pariatur. Excepteur sint occaecat cupidatat non proident, sunt in culpa qui officia deserunt mollit anim id est laborum.
Geographical Inquiries
Case Outcomes by Country
What are the top 5 countries with the highest death count?
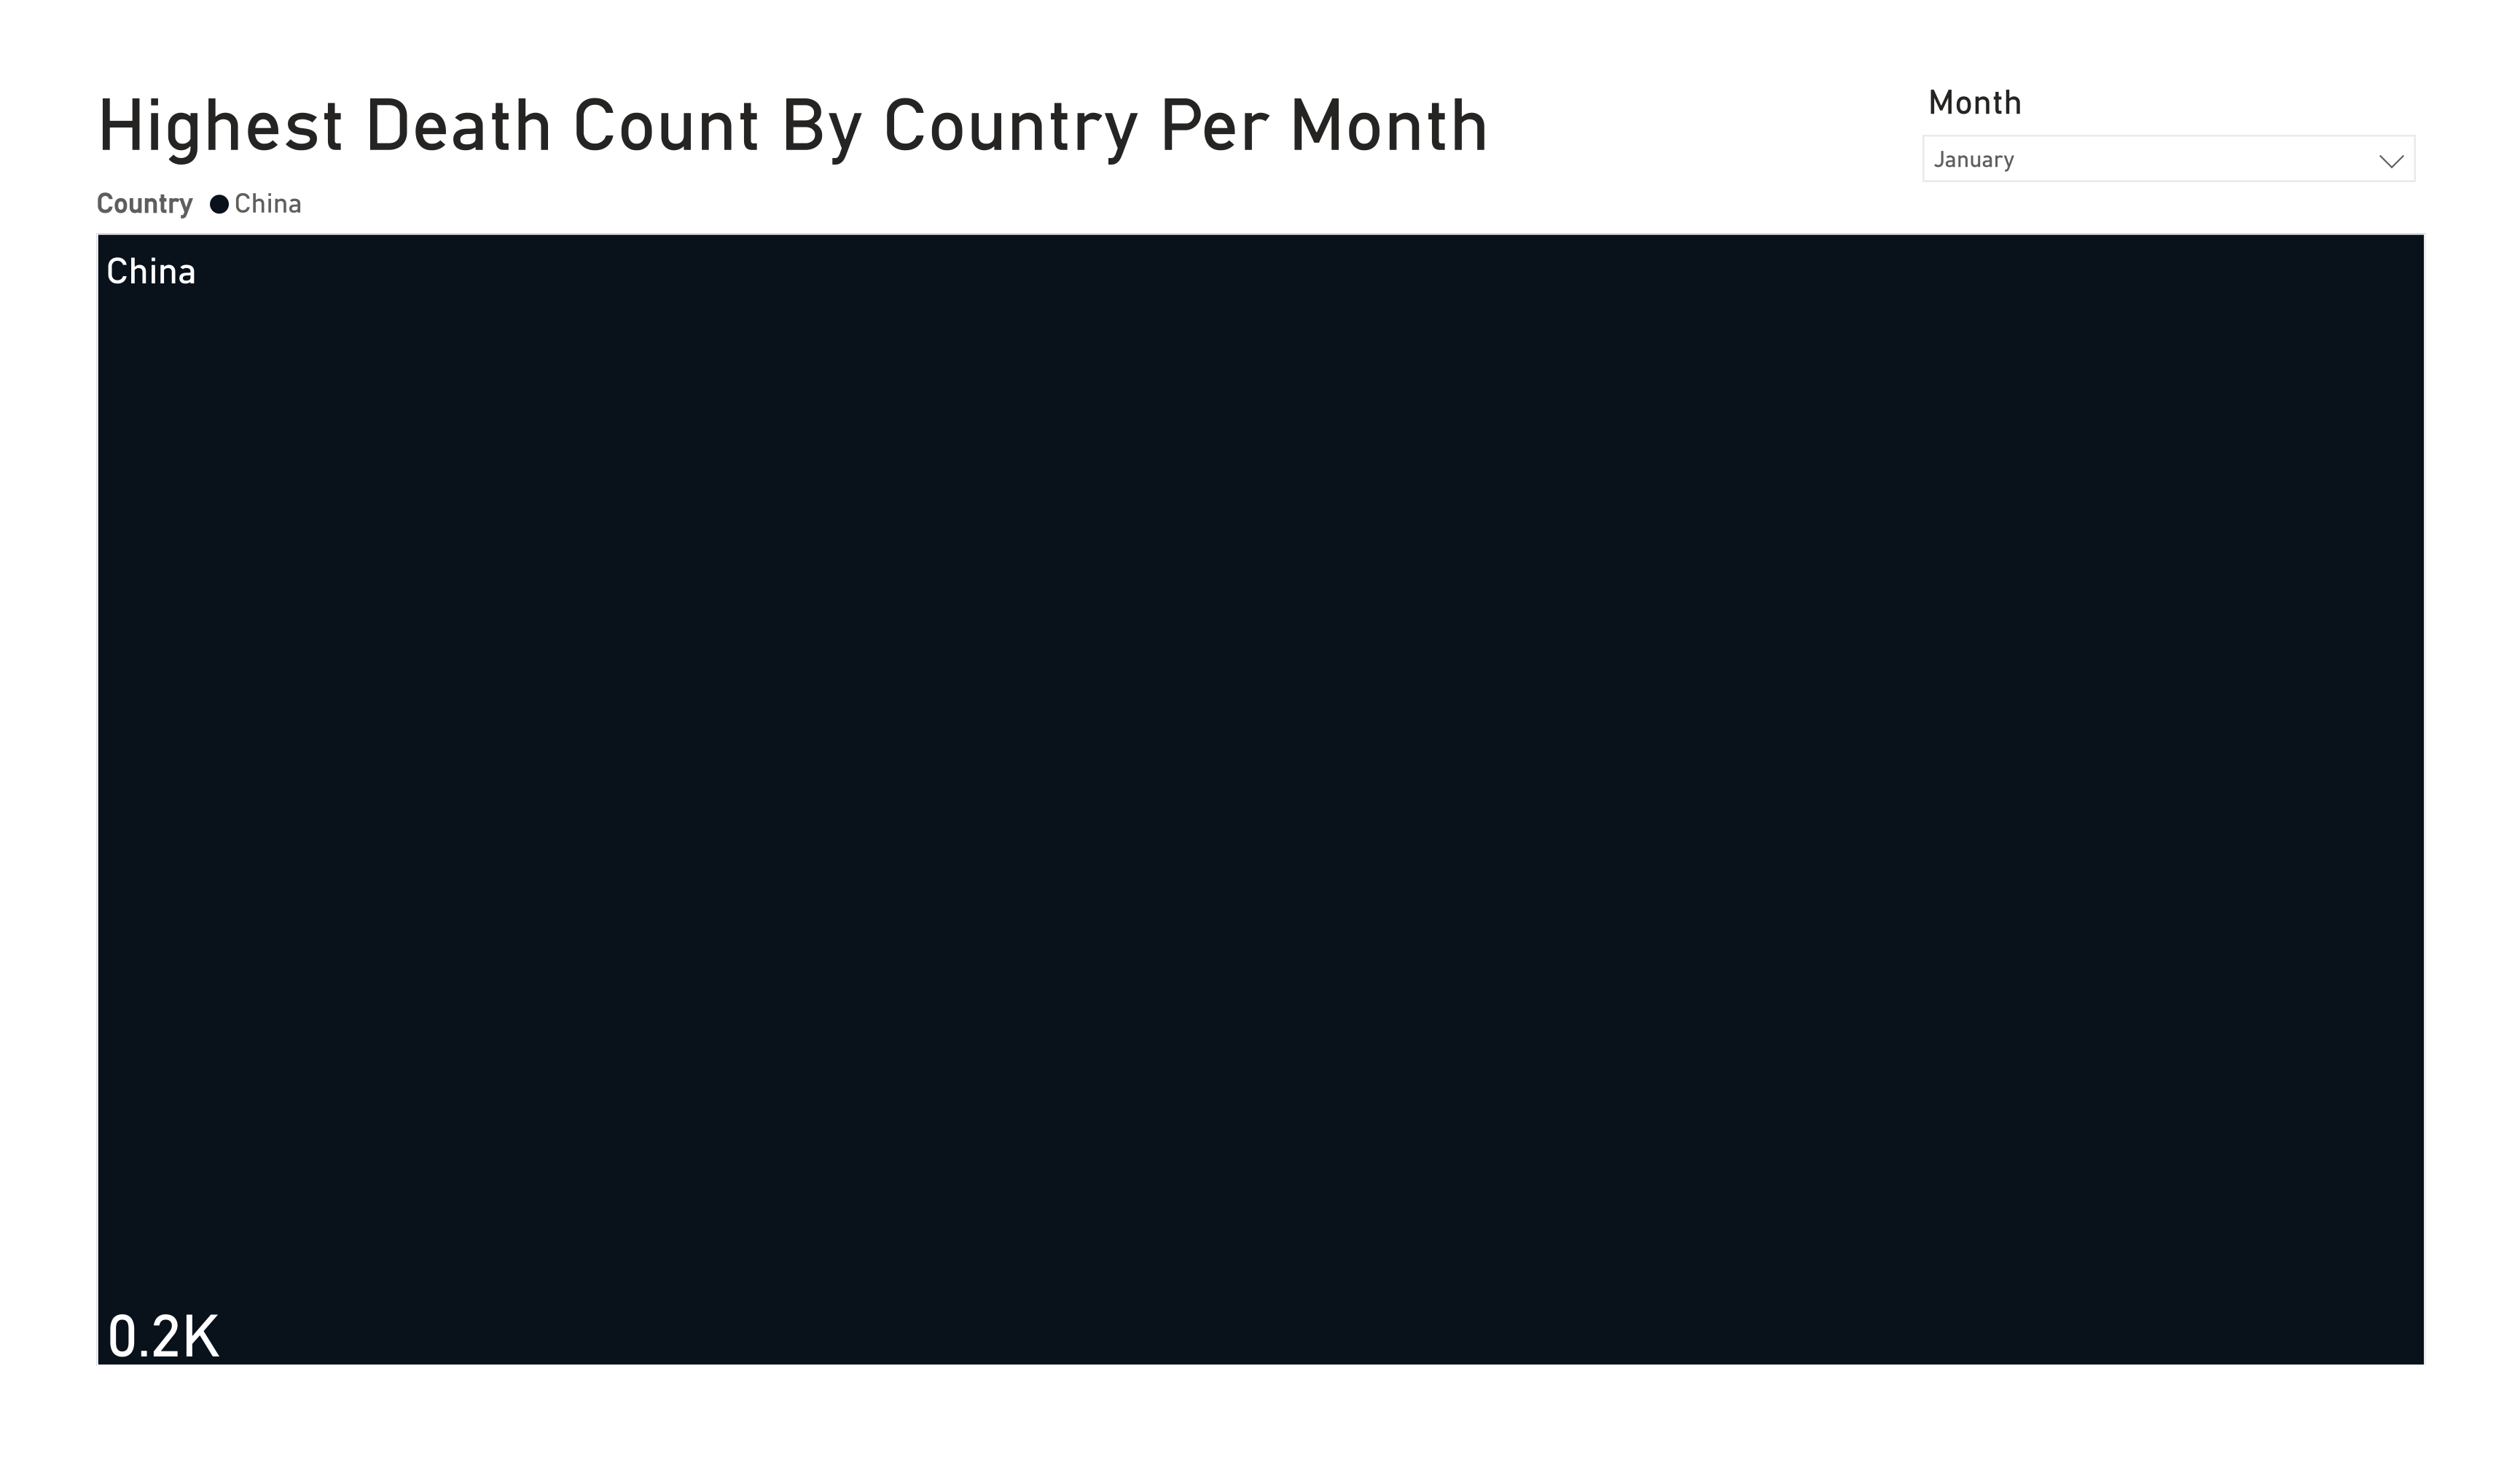
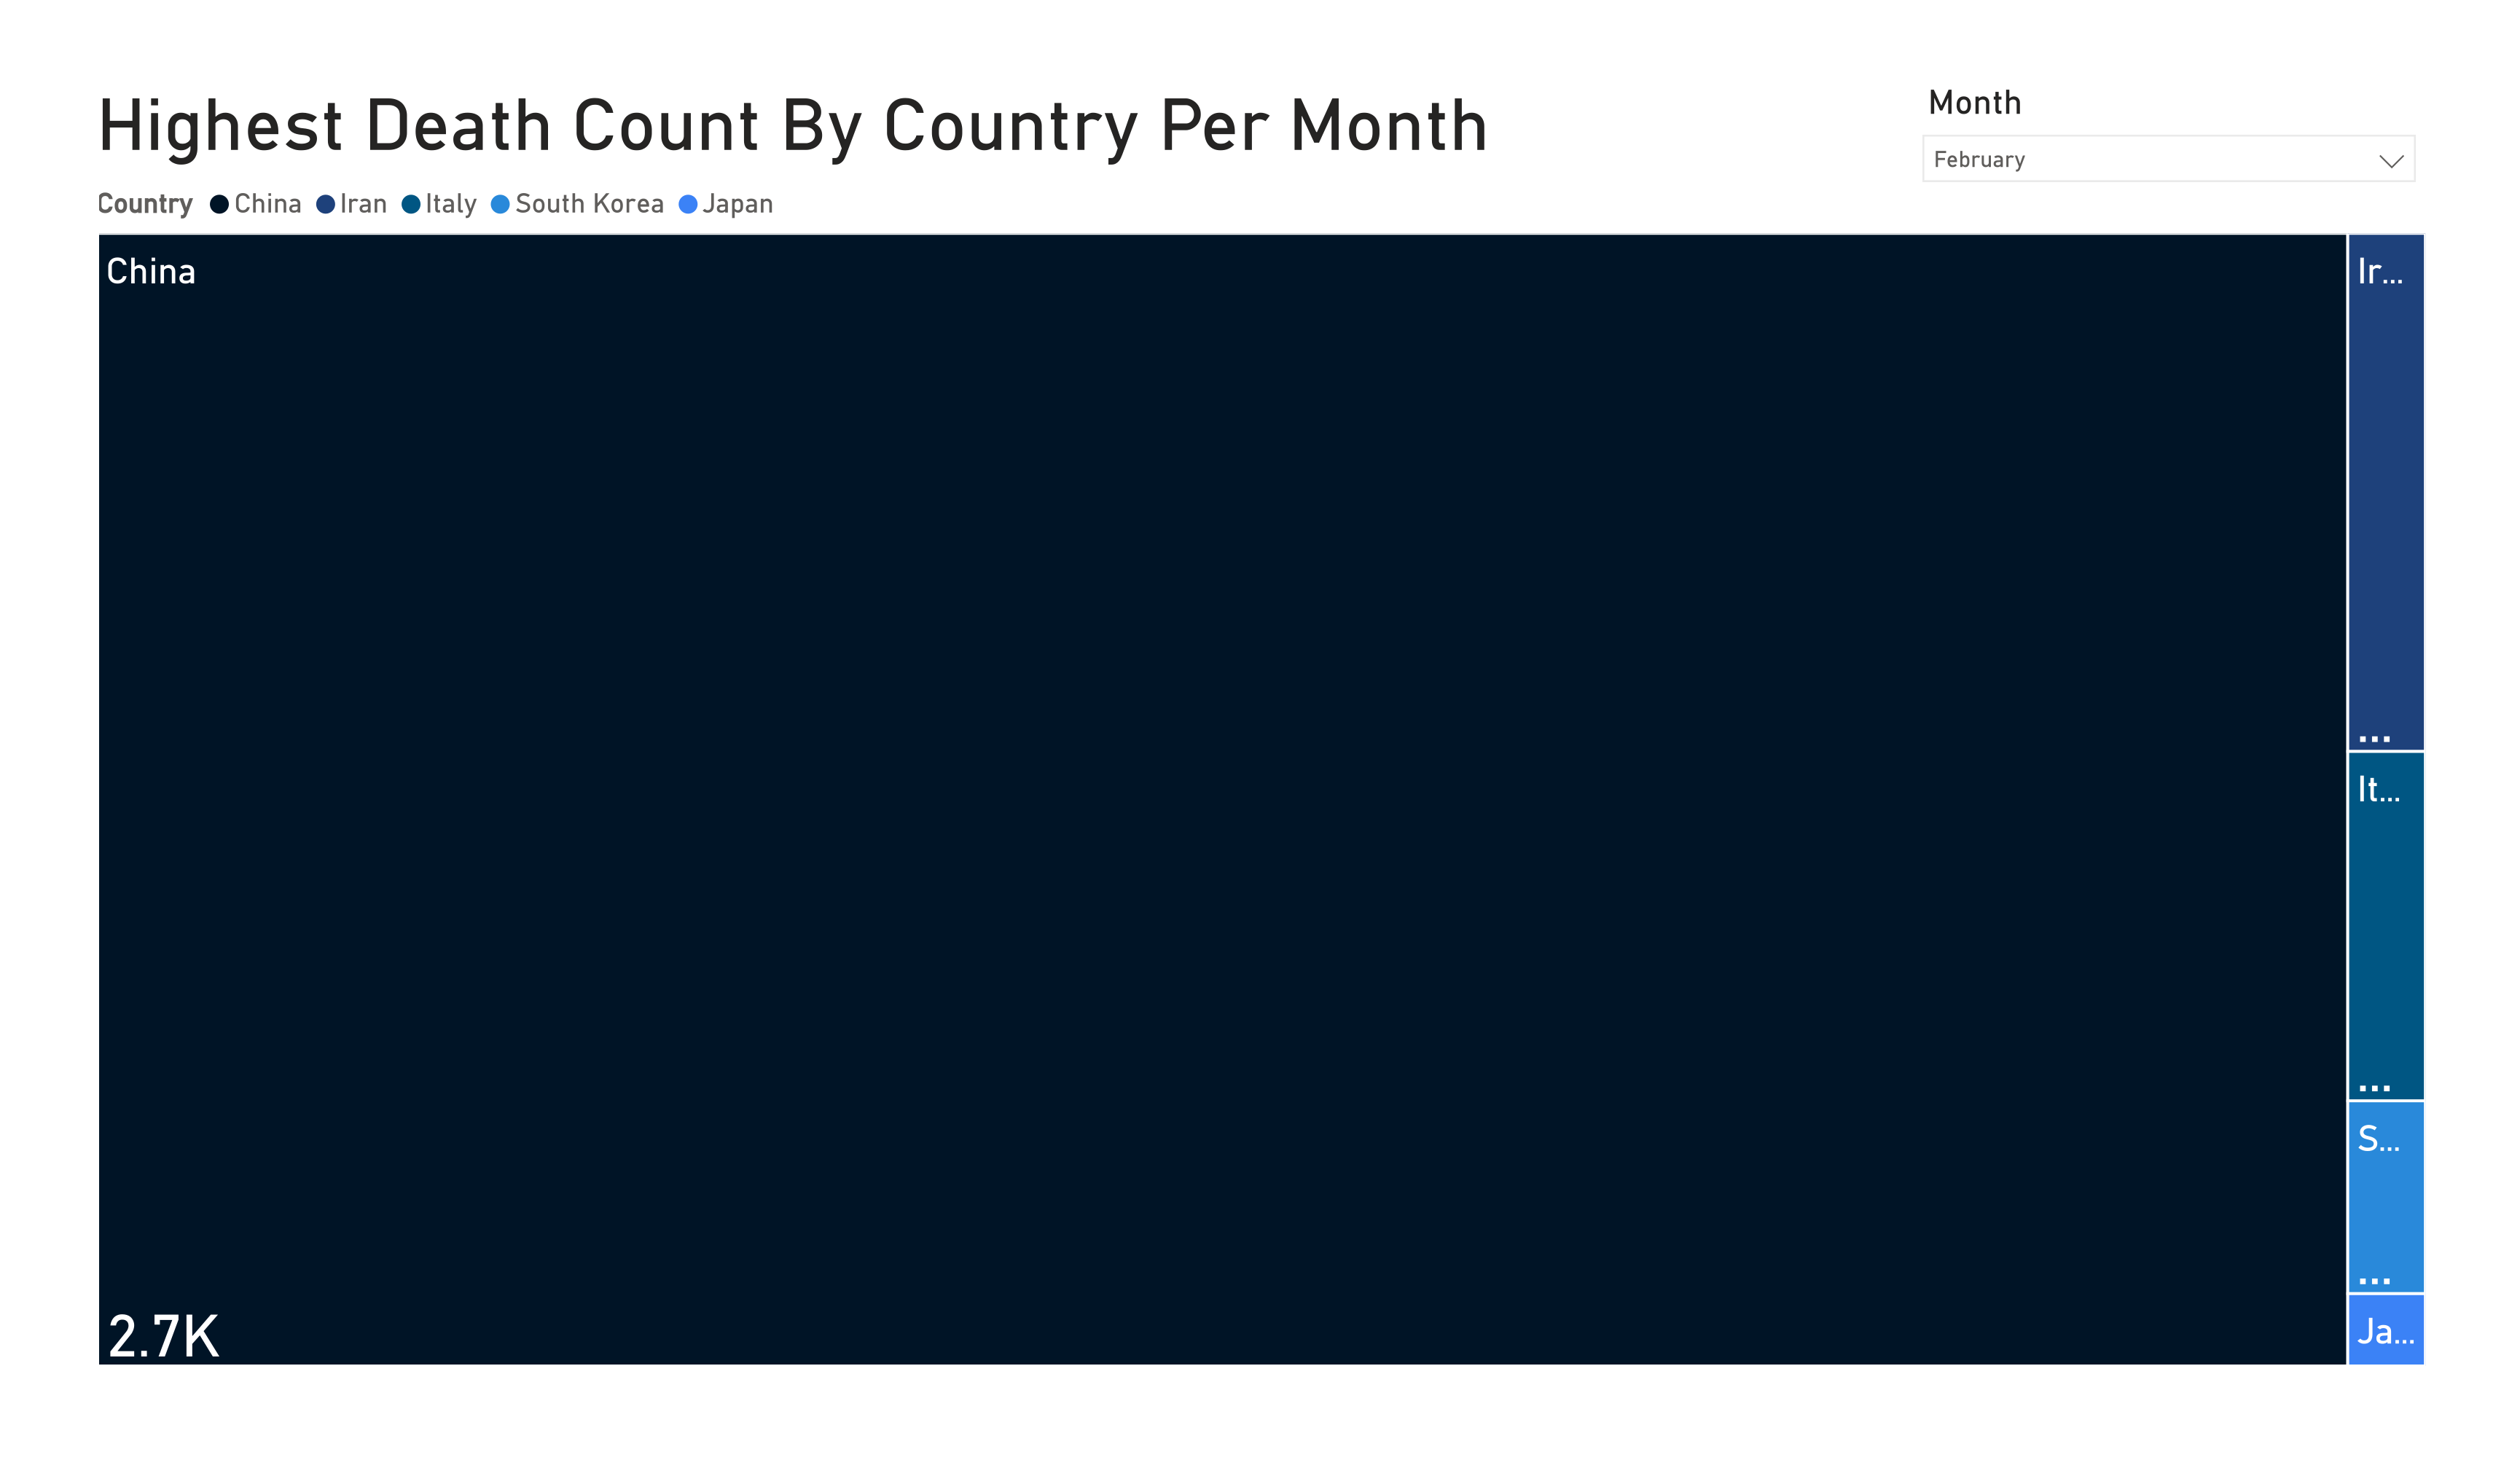
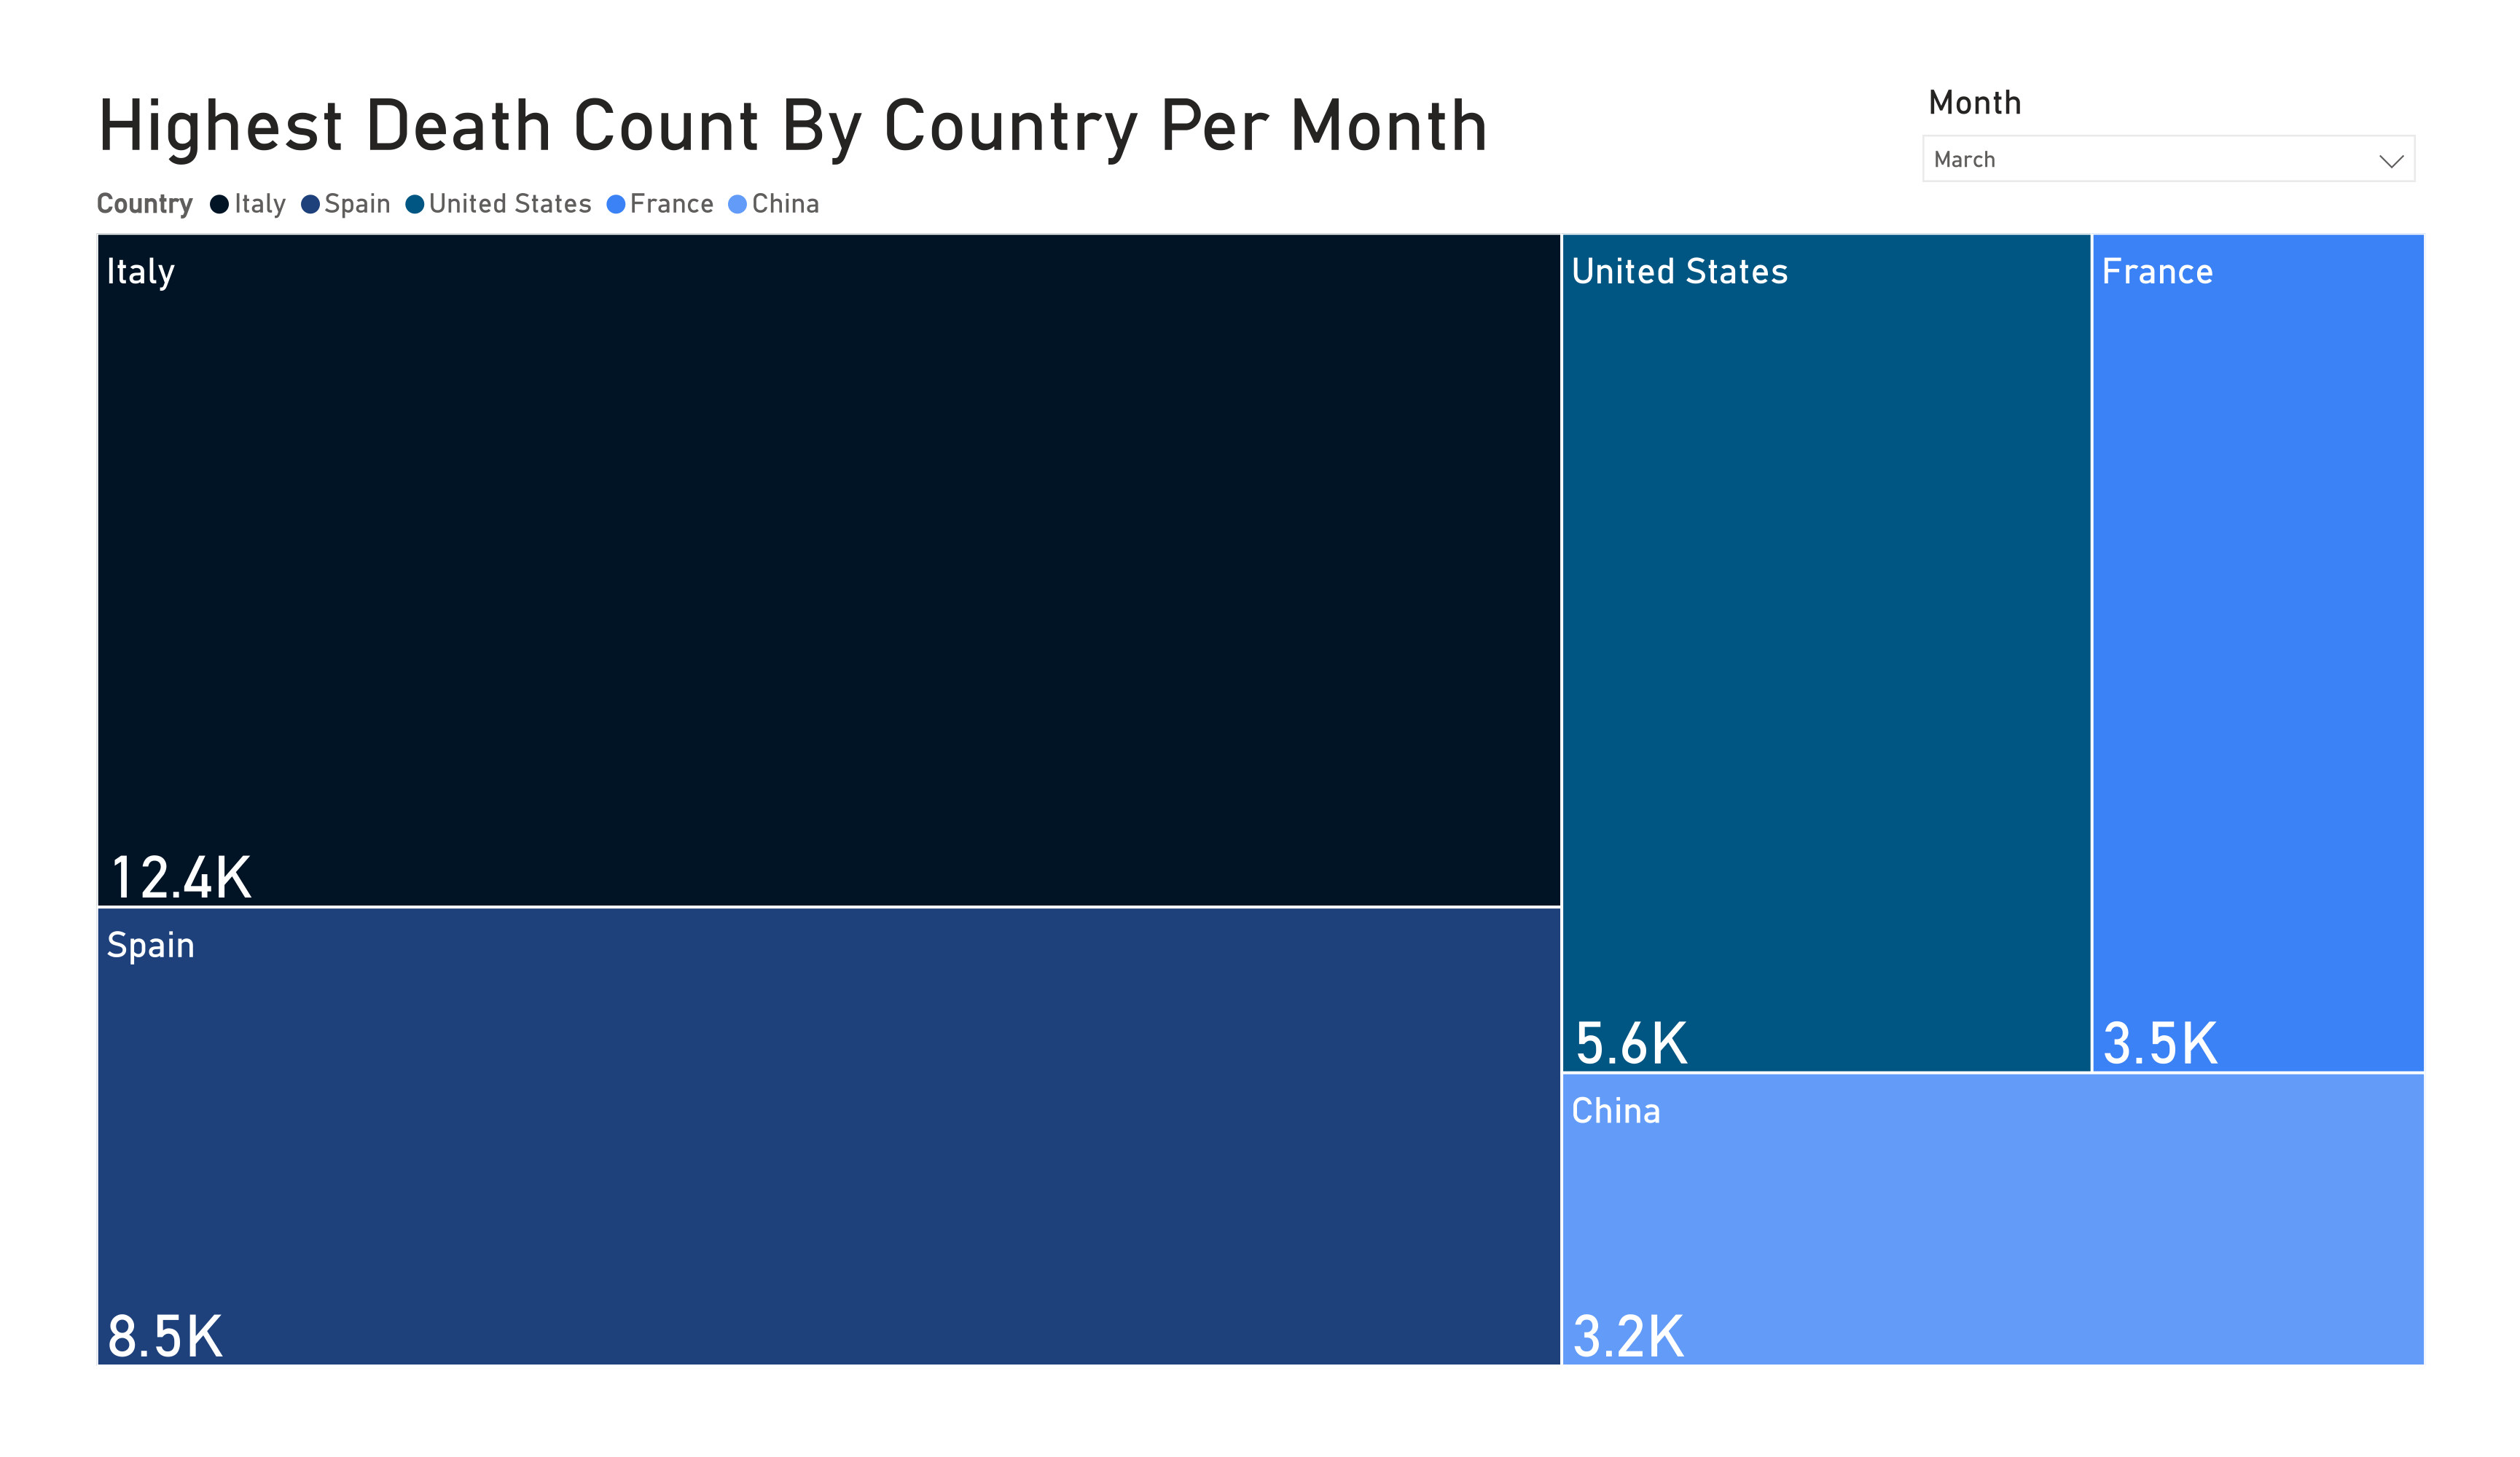
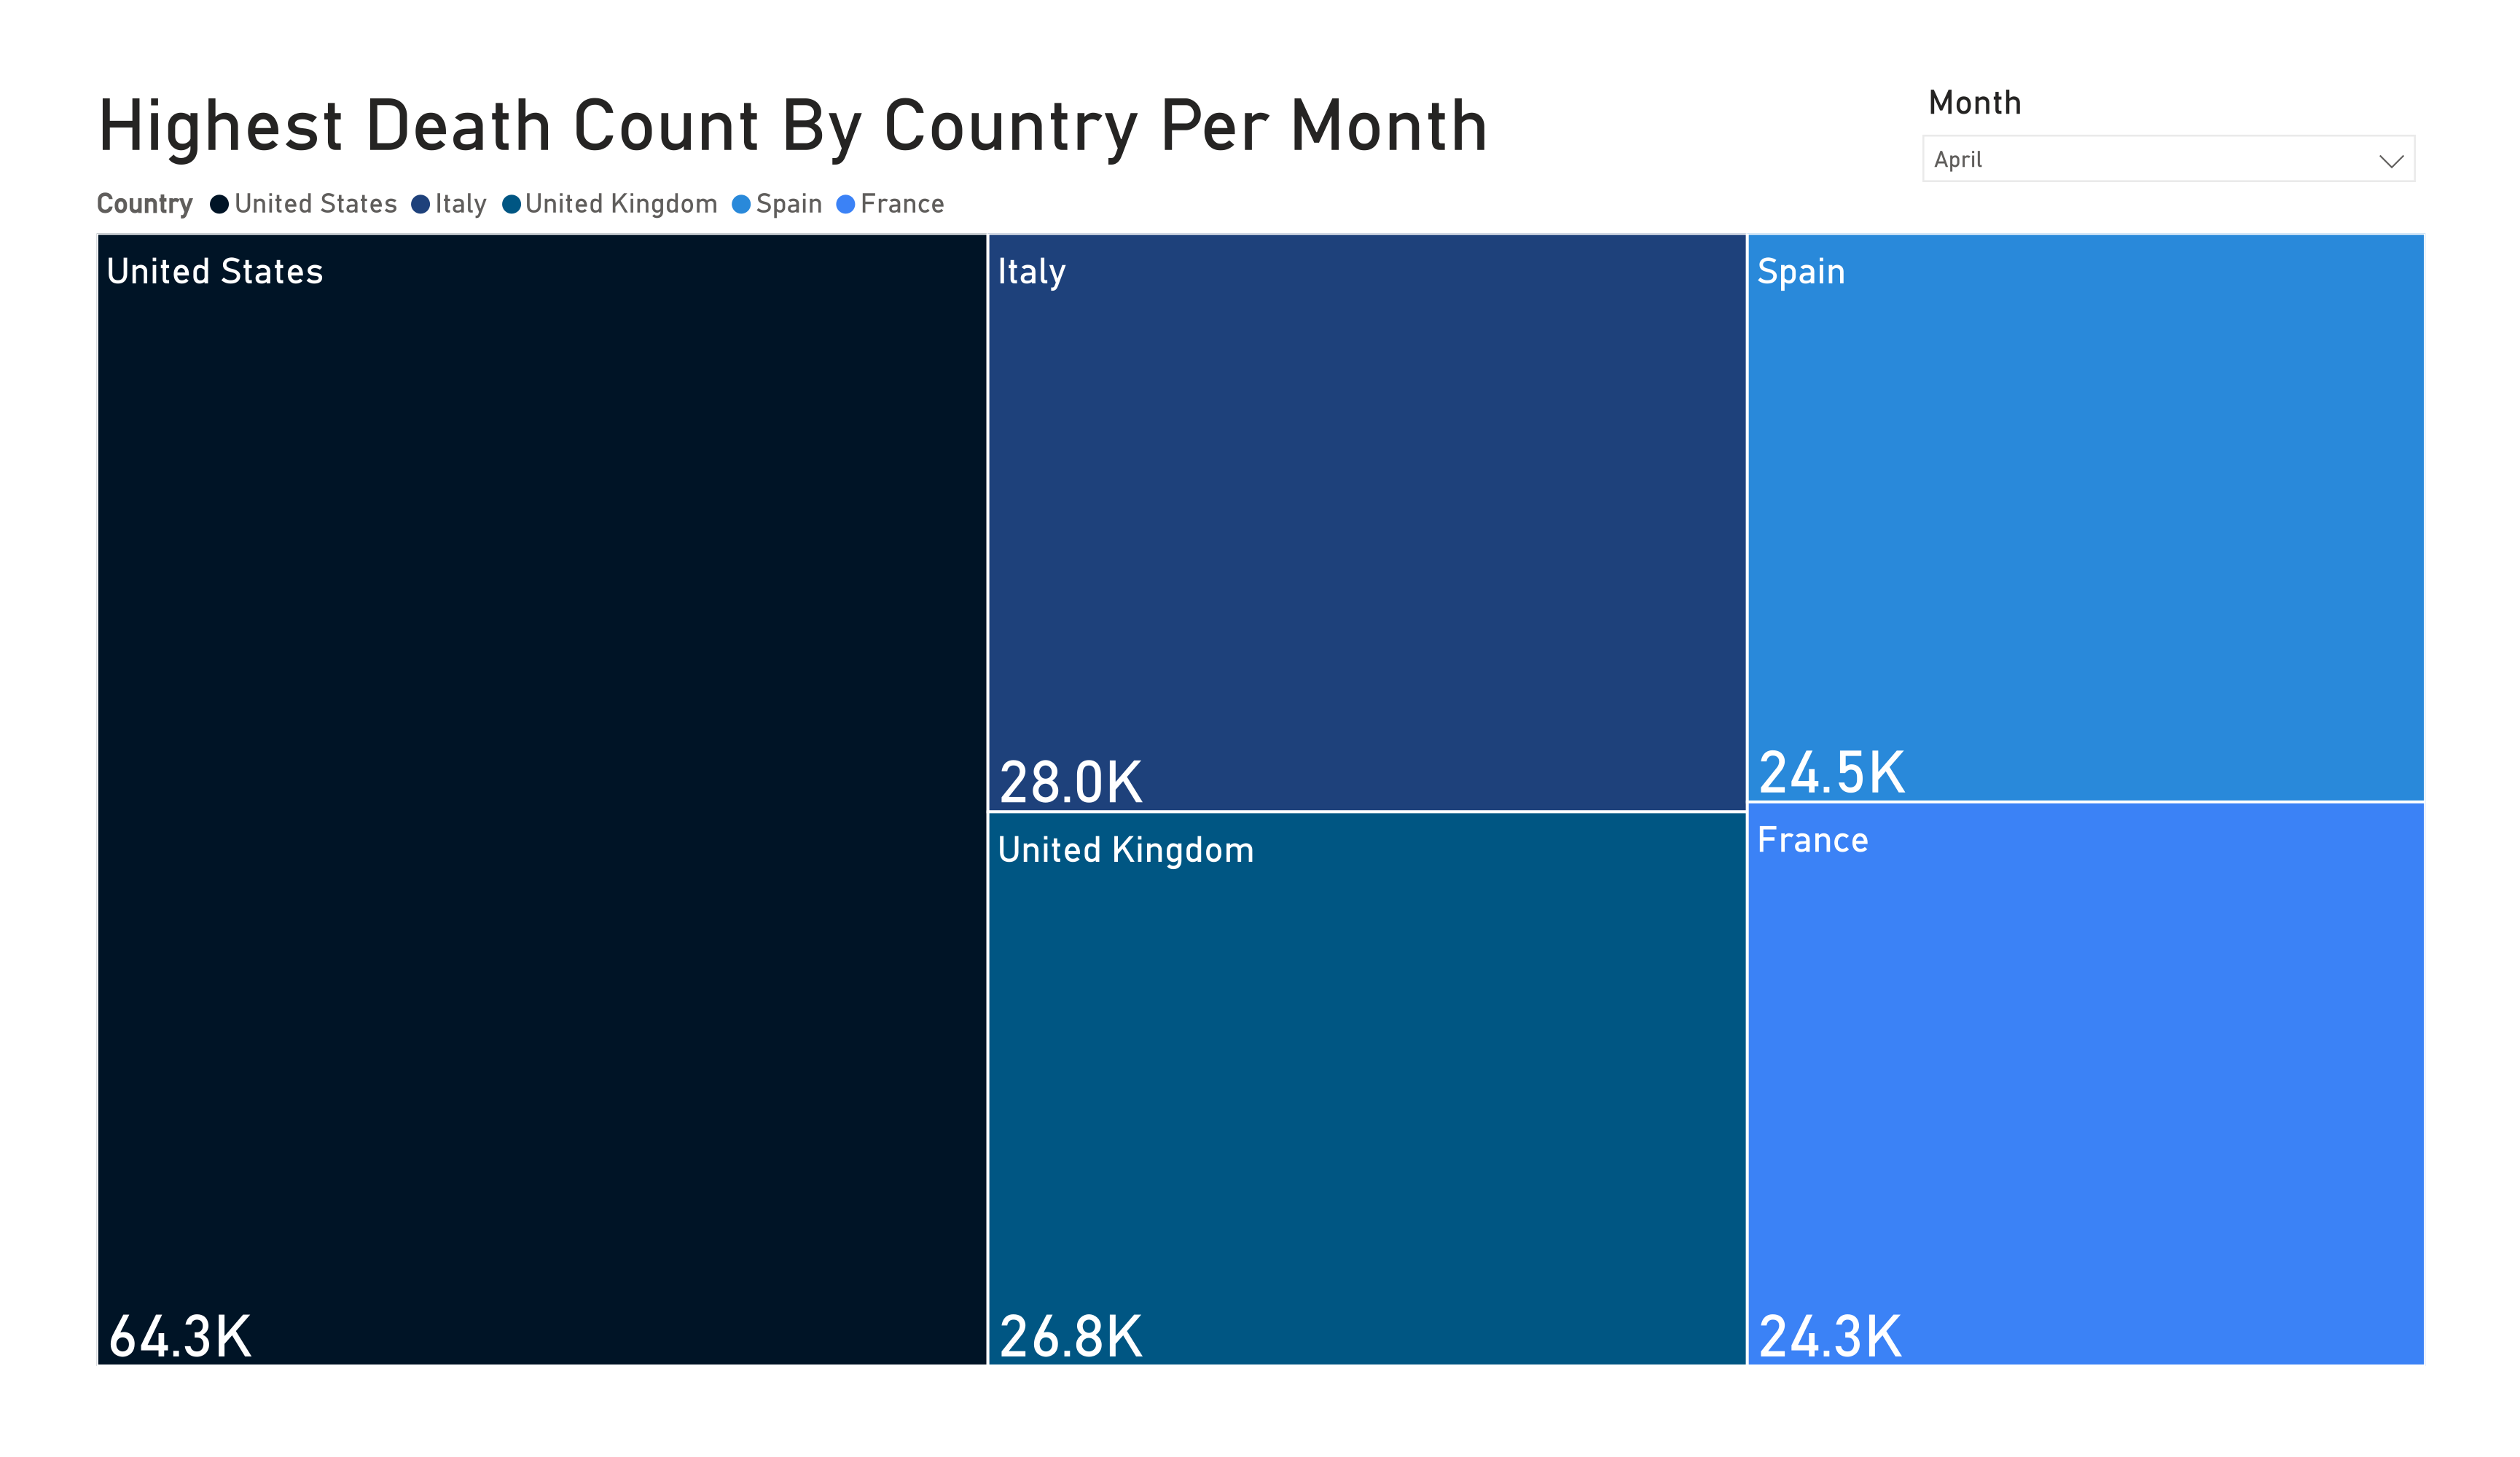
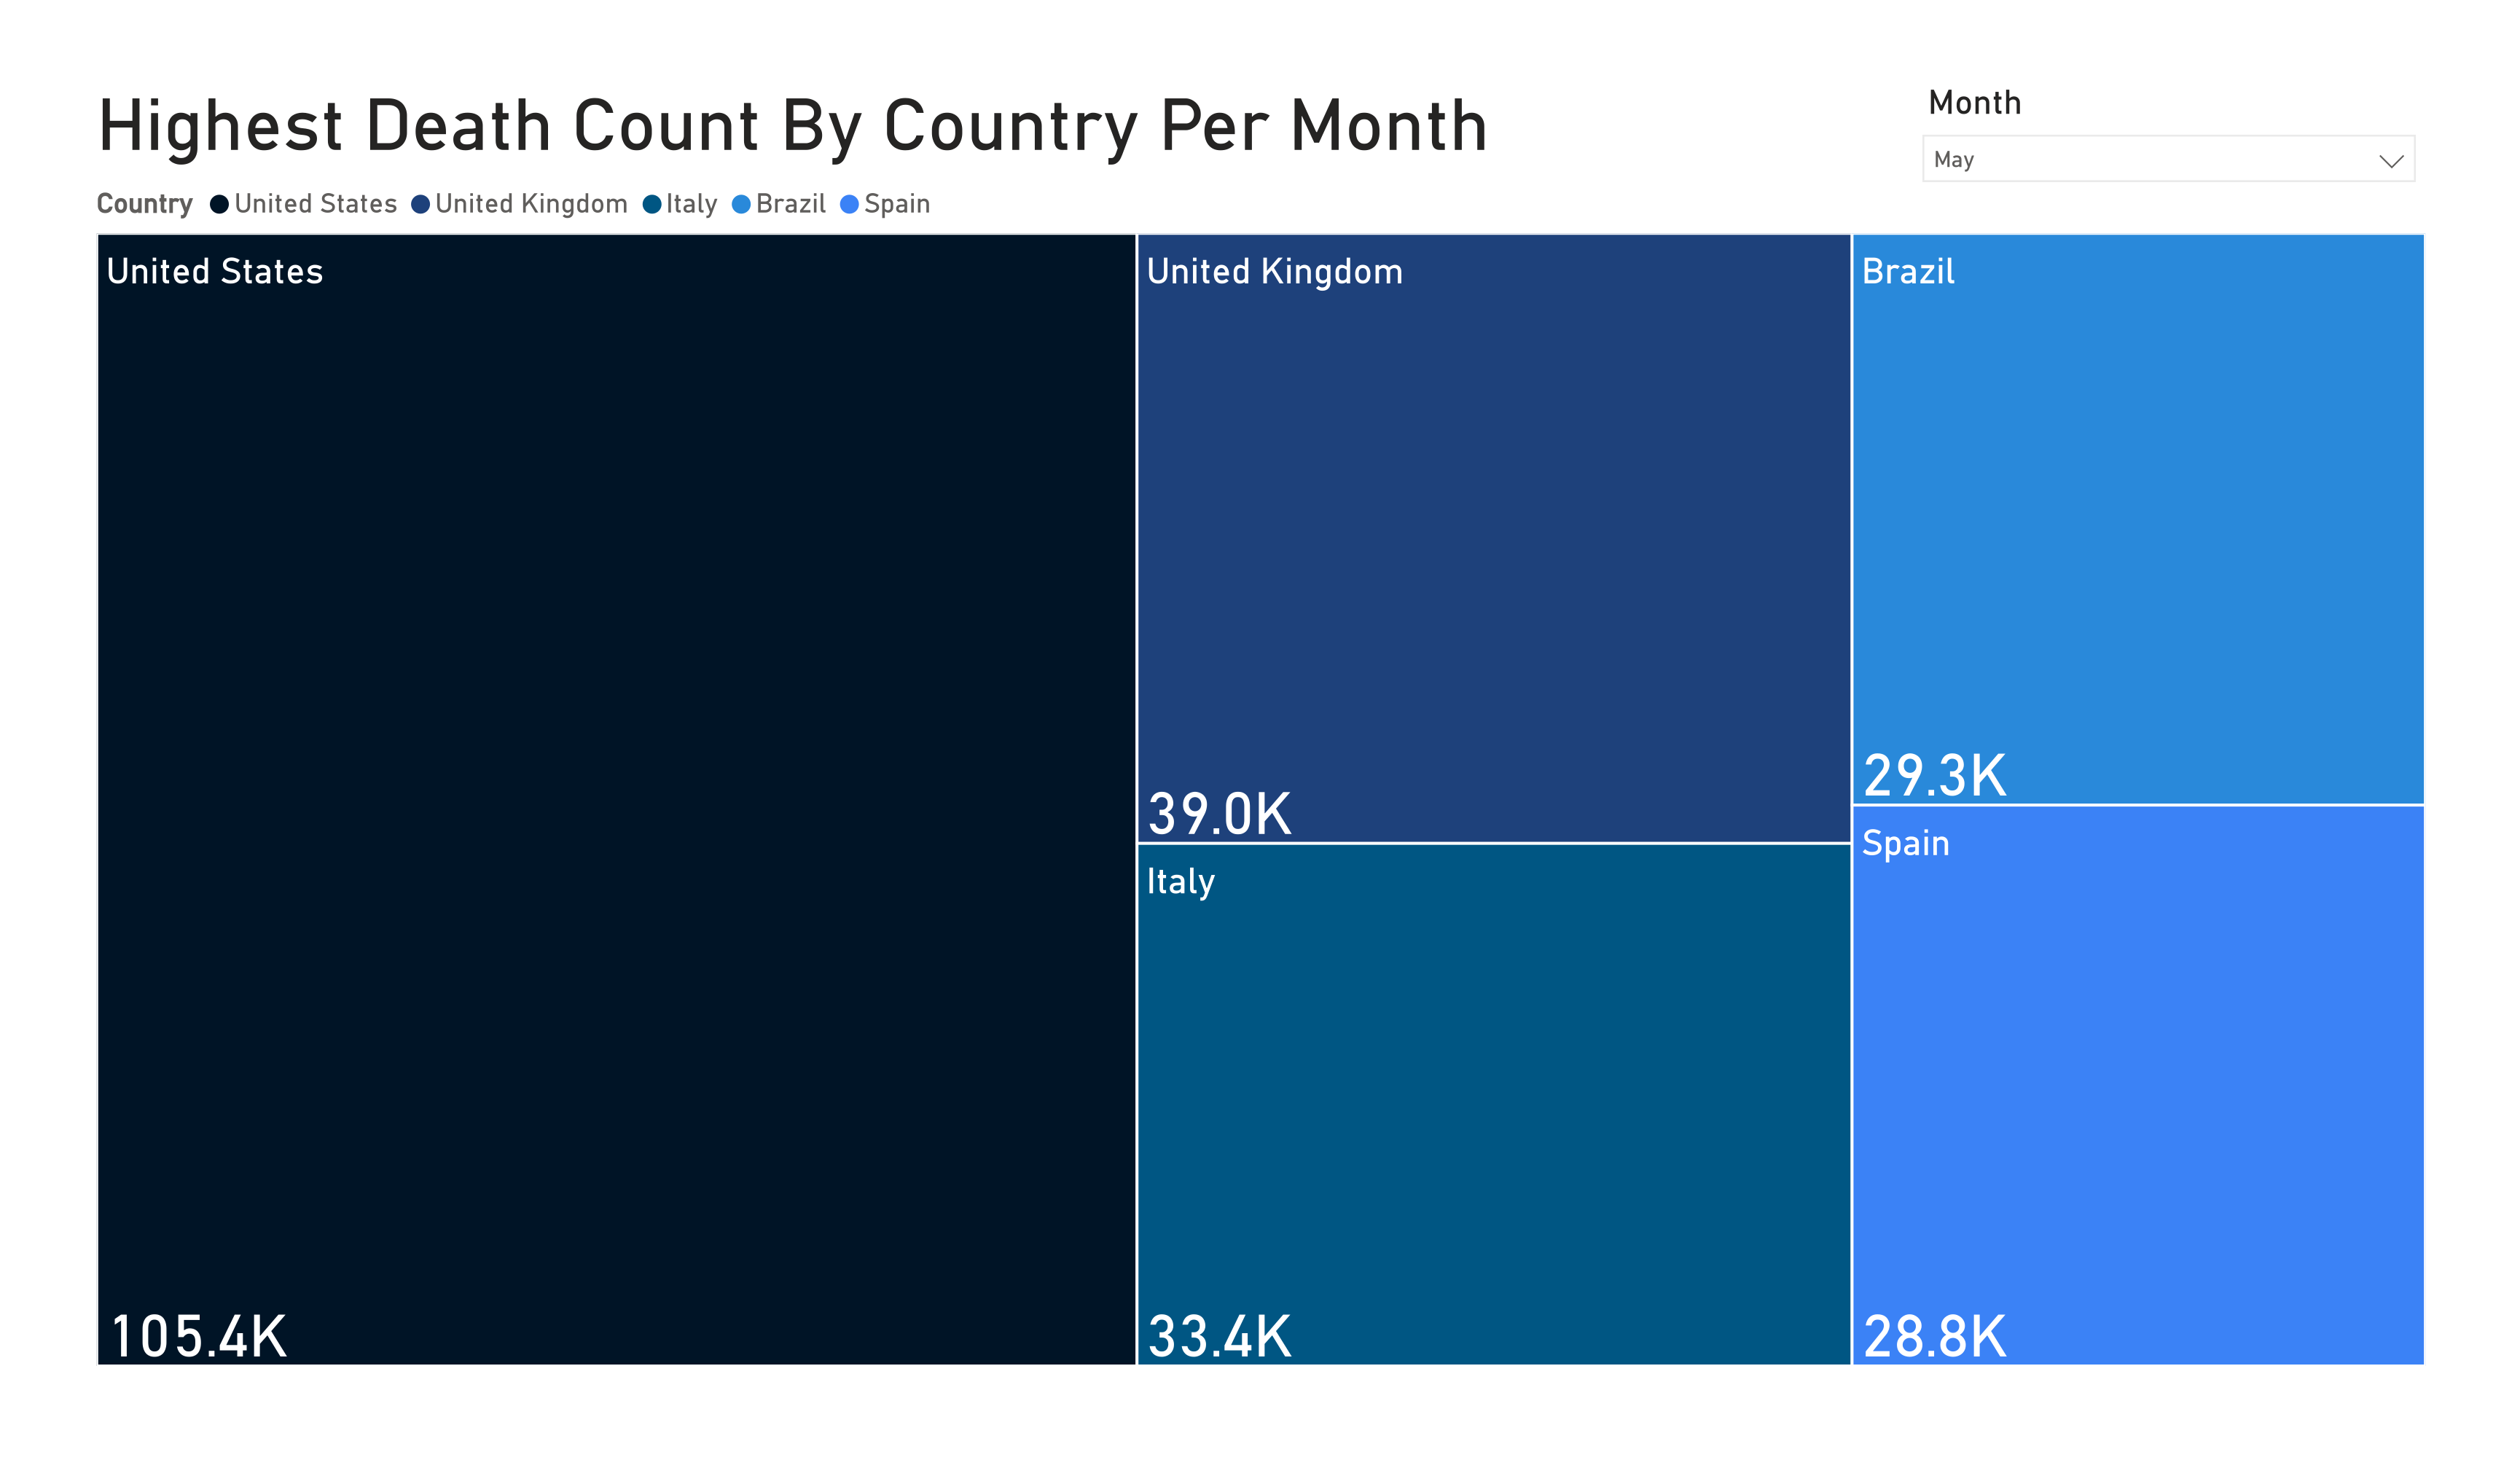
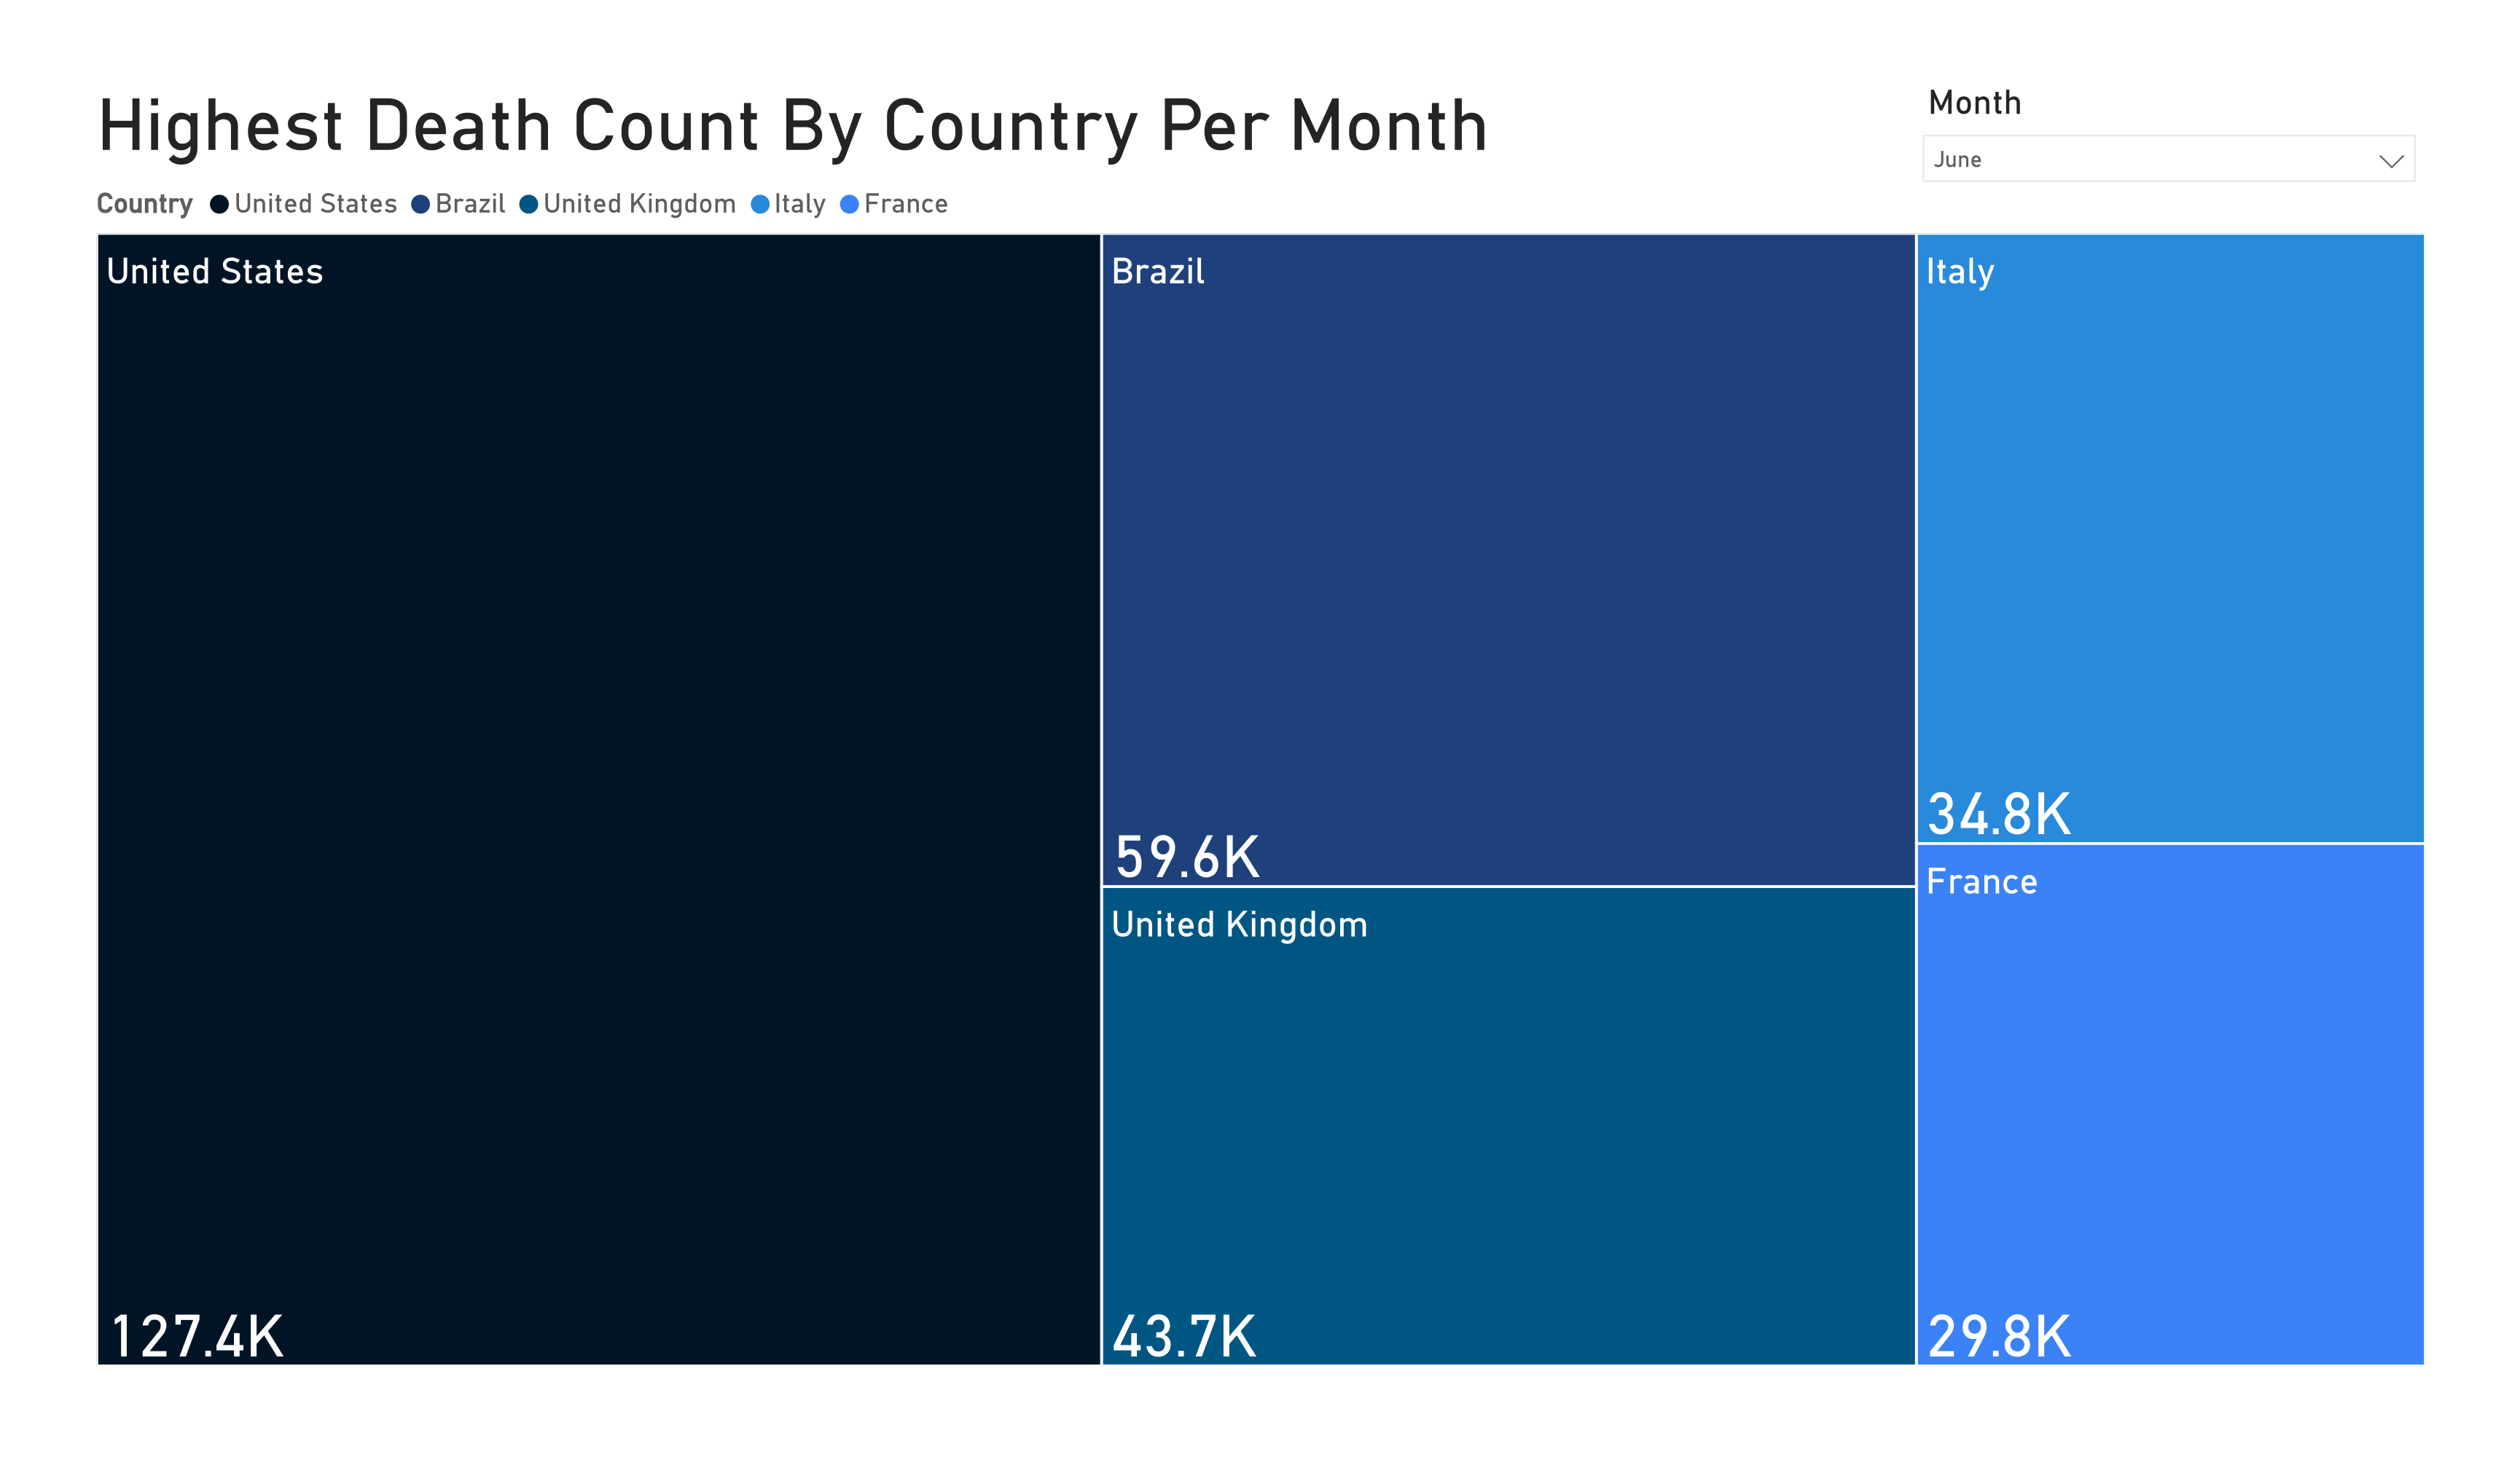
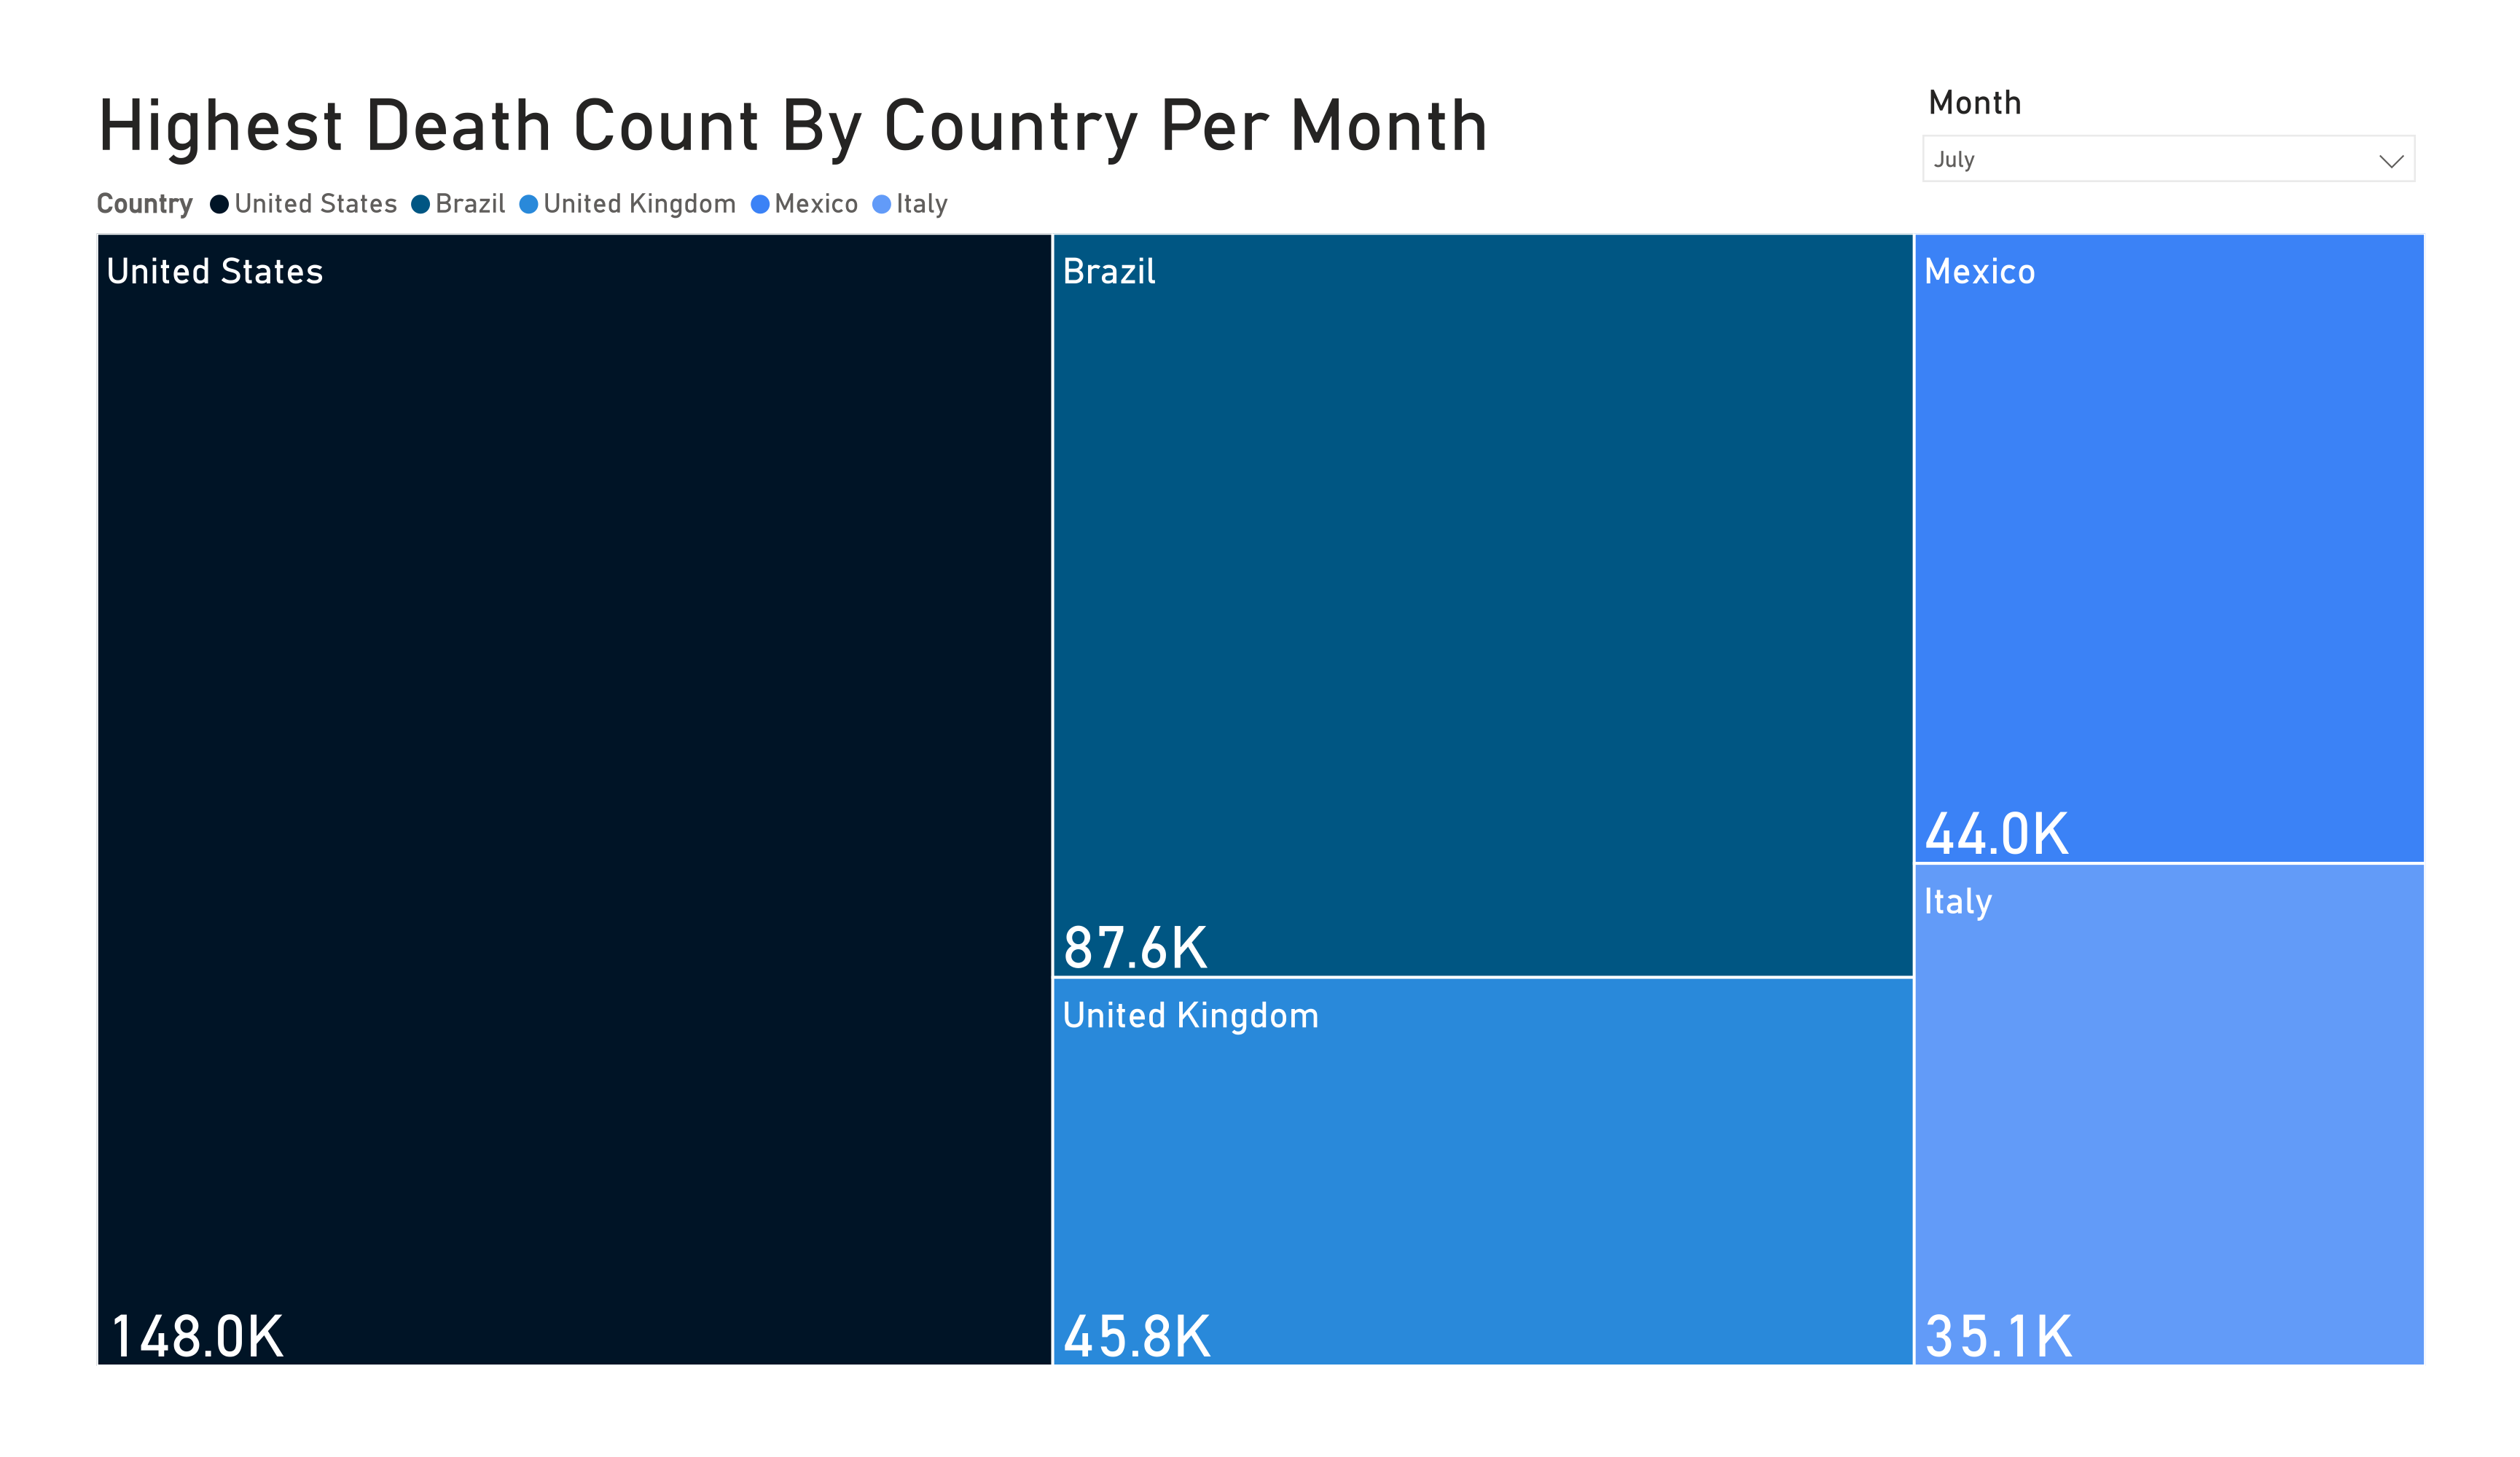
Lorem ipsum dolor sit amet, consectetur adipiscing elit, sed do eiusmod tempor incididunt ut labore et dolore magna aliqua. Ut enim ad minim veniam, quis nostrud exercitation ullamco laboris nisi ut aliquip ex ea commodo consequat. Duis aute irure dolor in reprehenderit in voluptate velit esse cillum dolore eu fugiat nulla pariatur. Excepteur sint occaecat cupidatat non proident, sunt in culpa qui officia deserunt mollit anim id est laborum.
What are the top 5 countries with the highest recovery count?
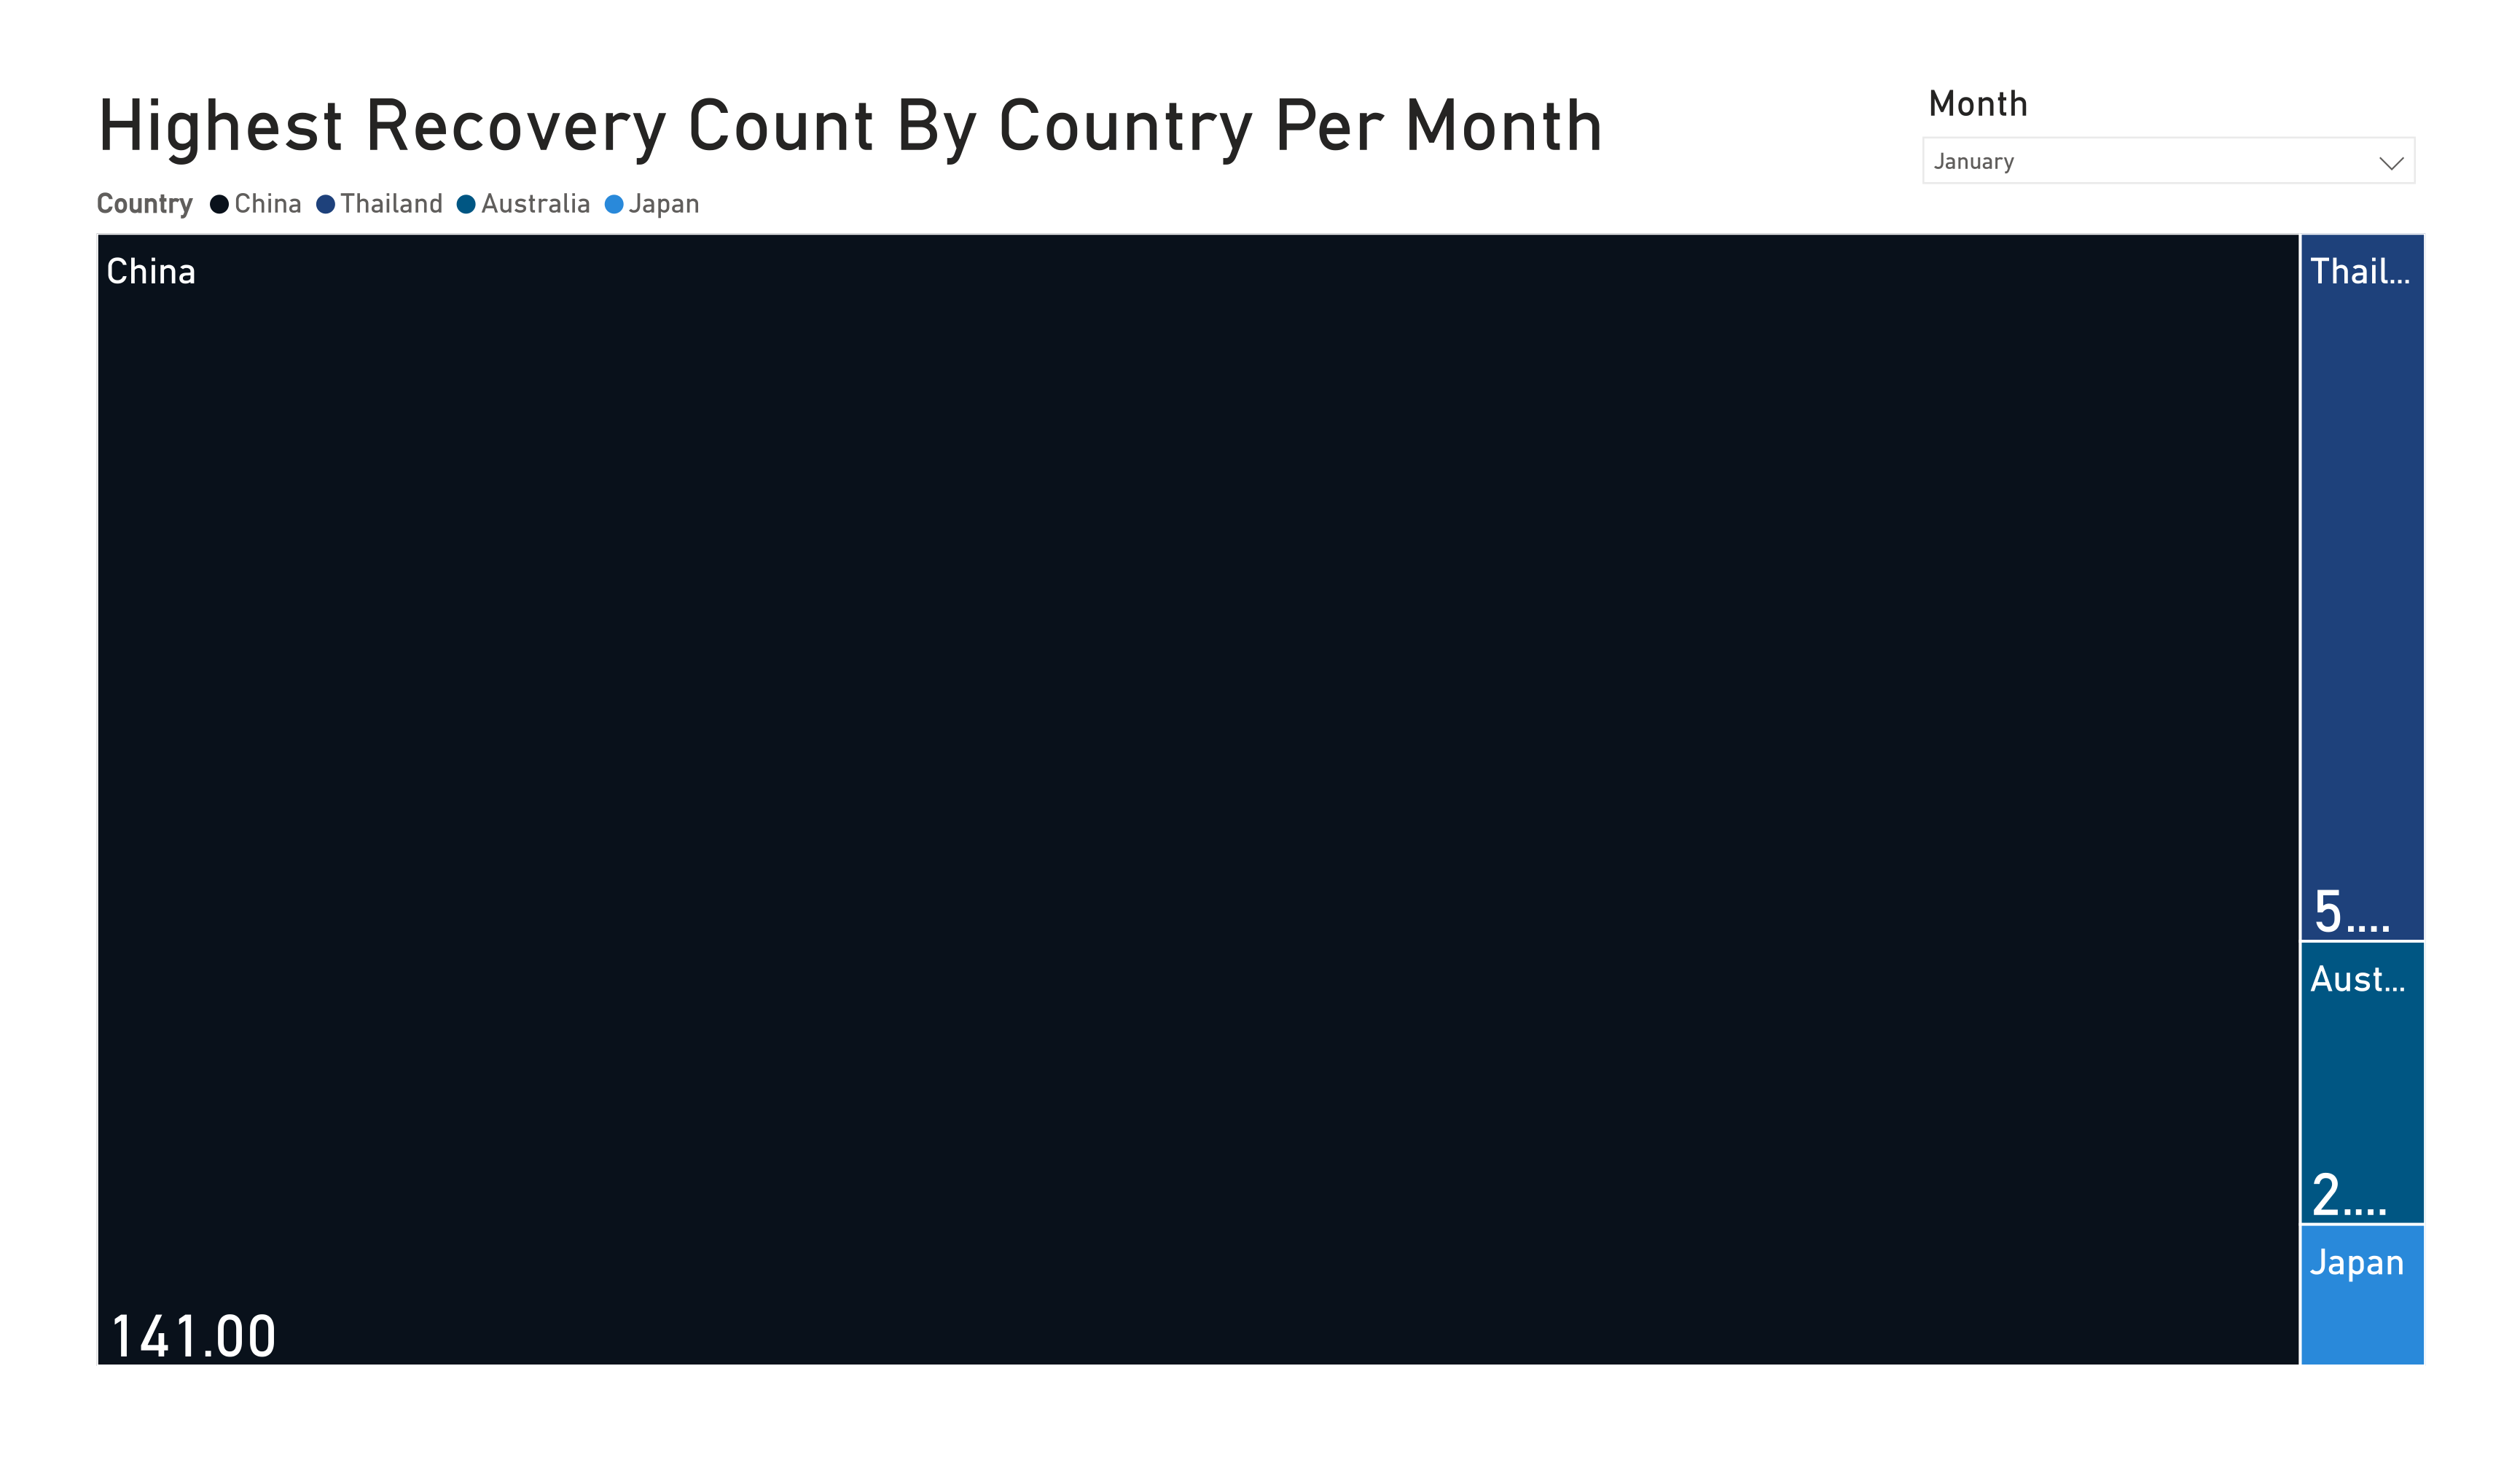
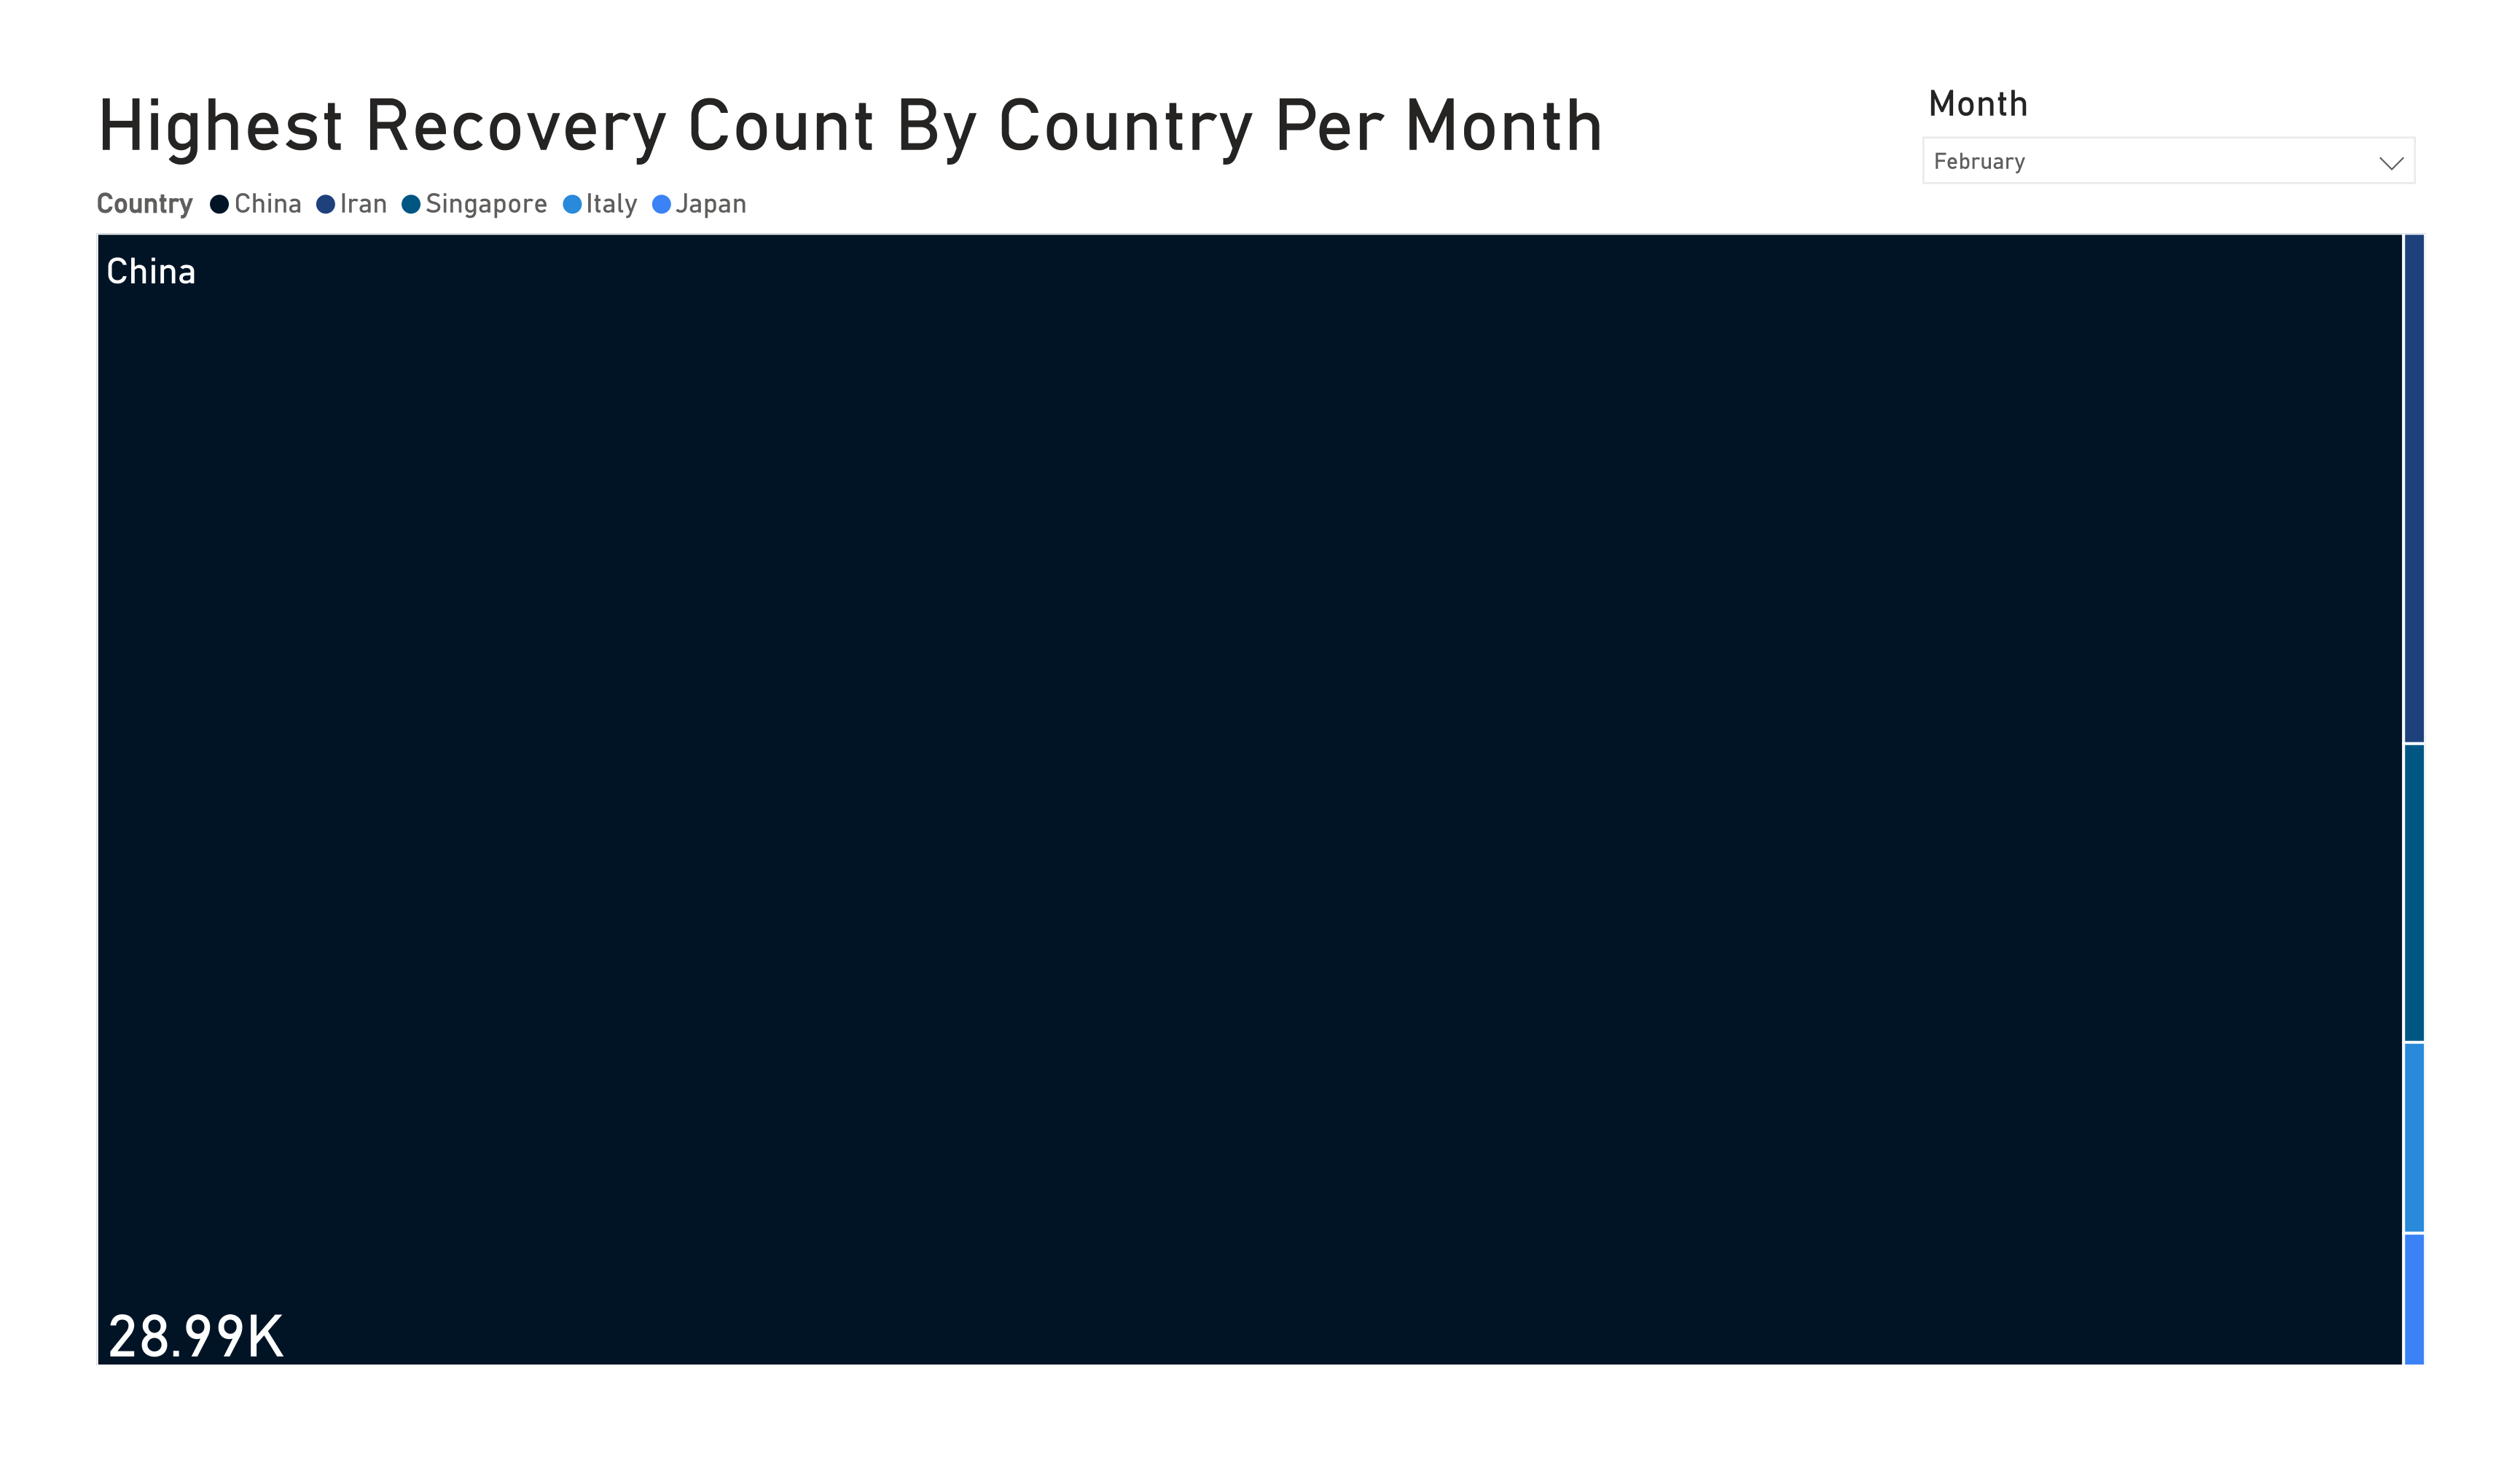
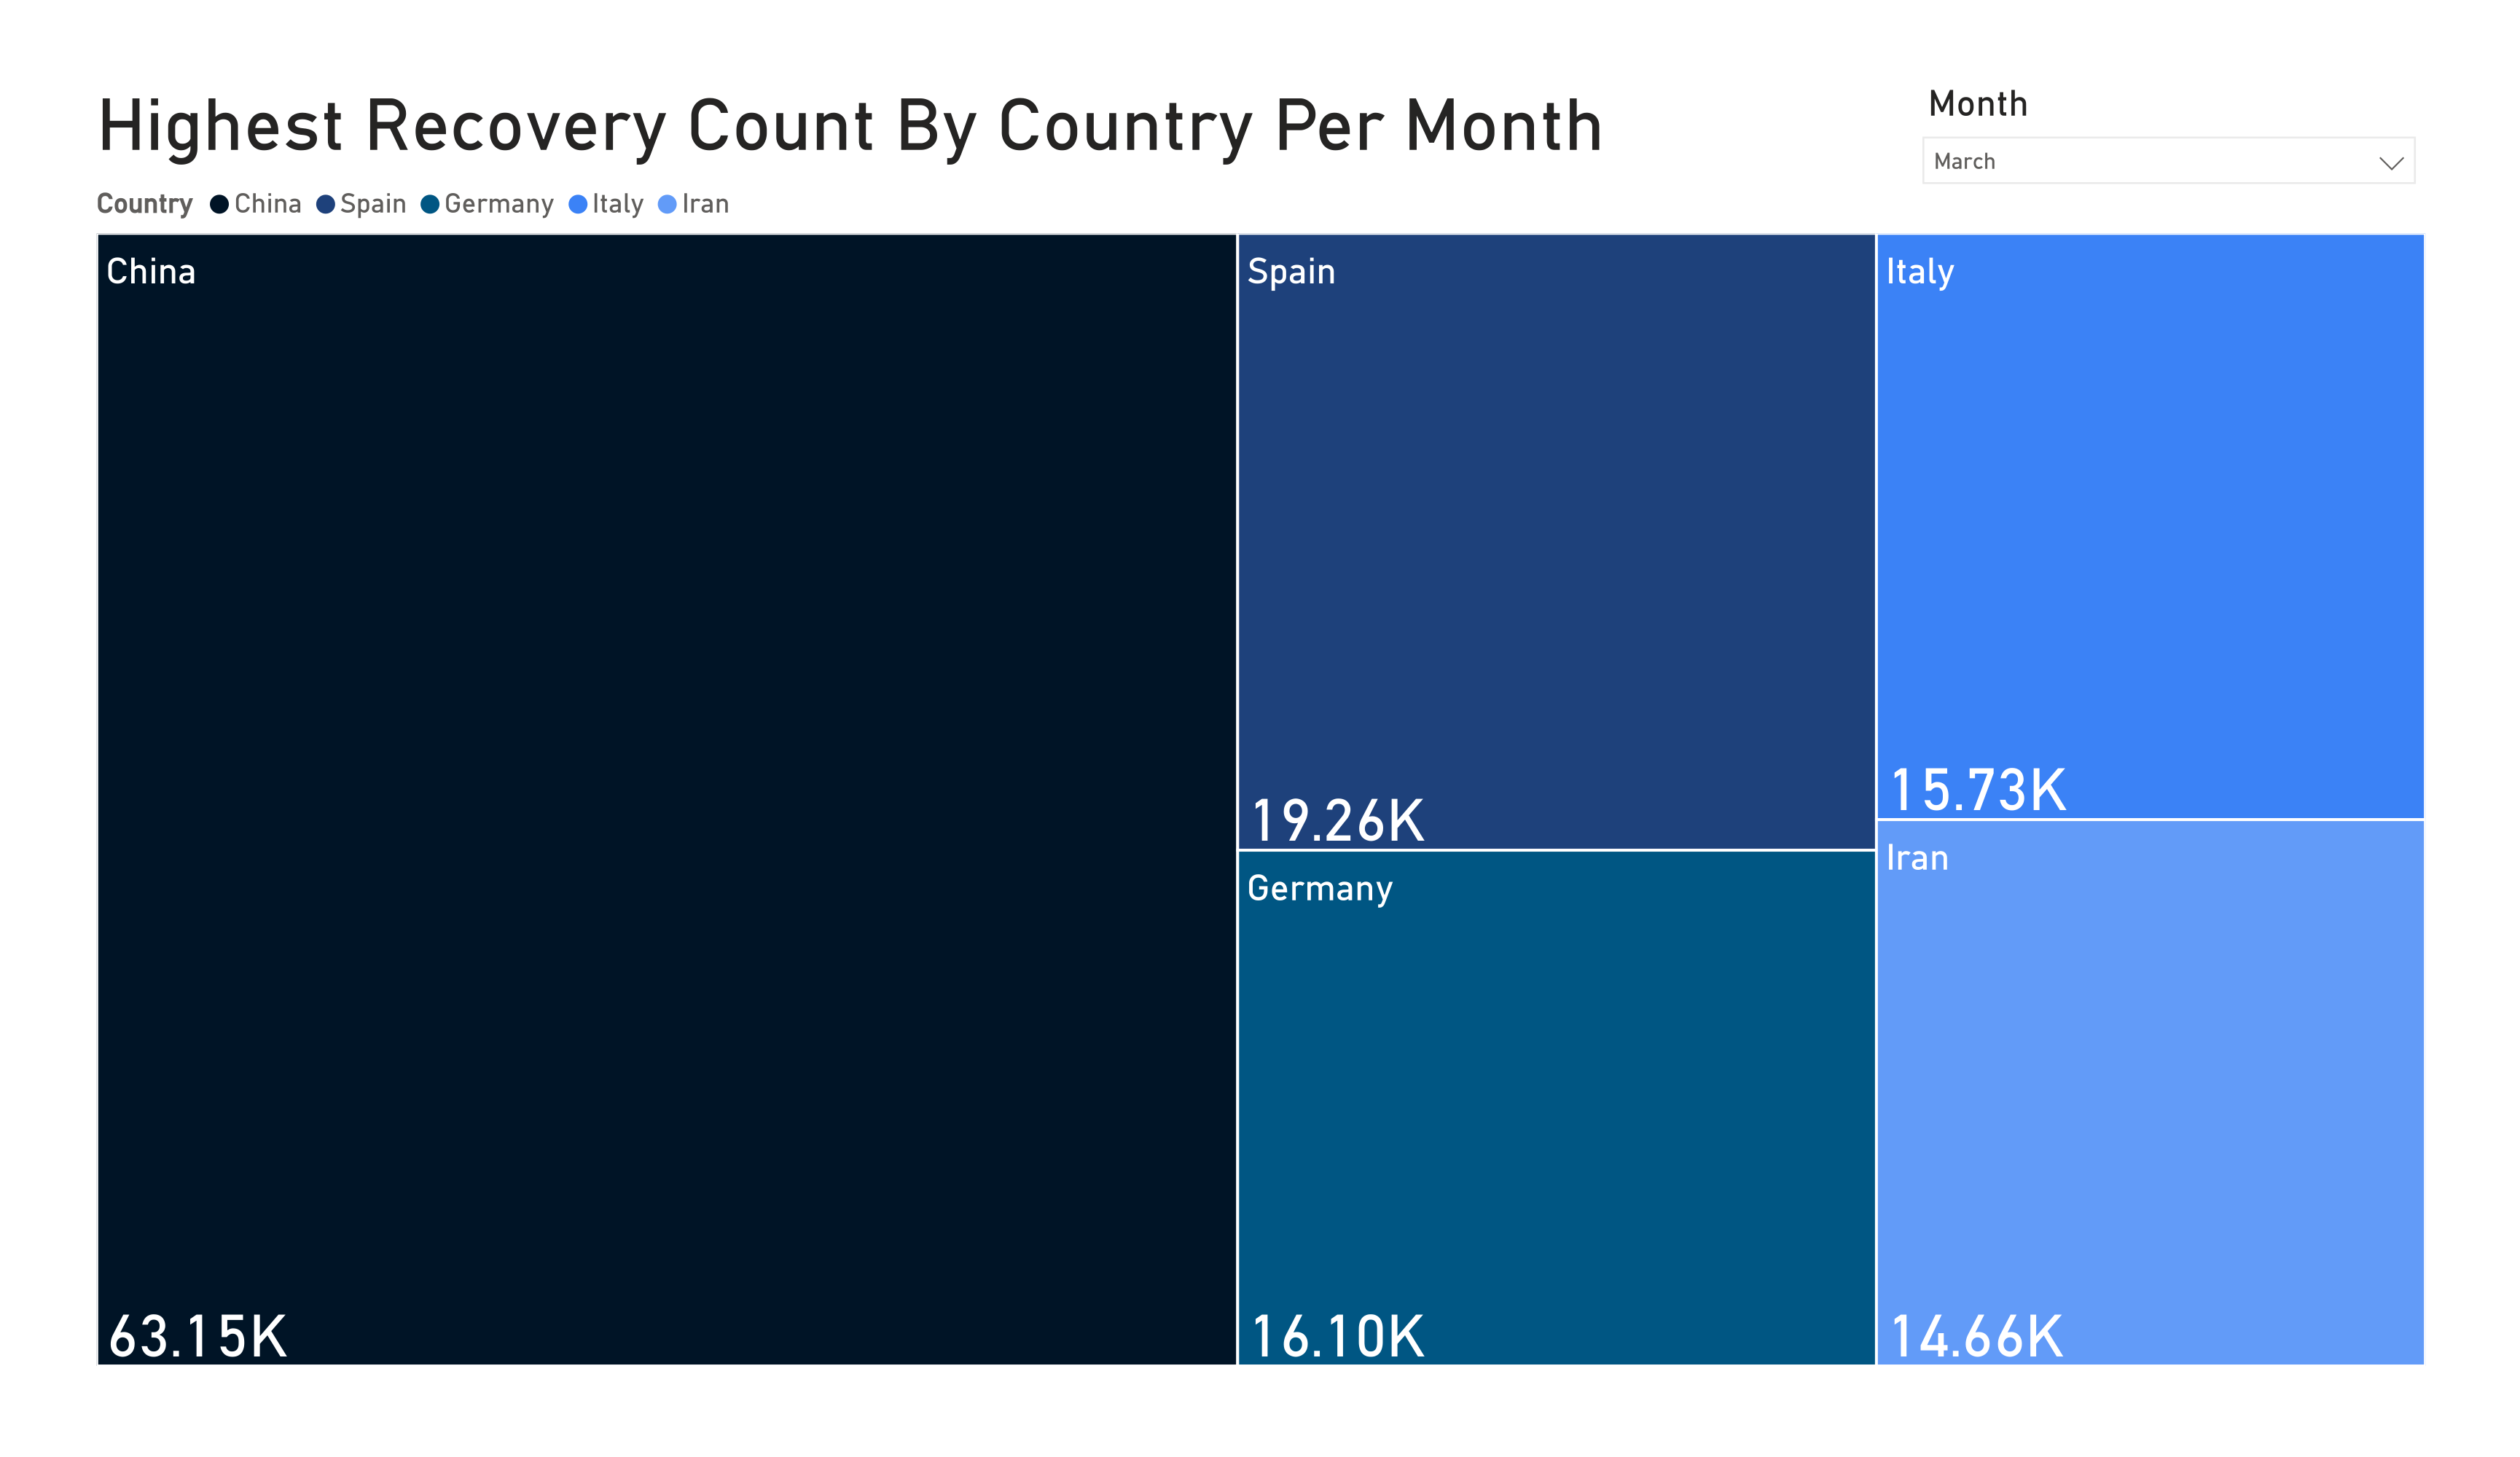
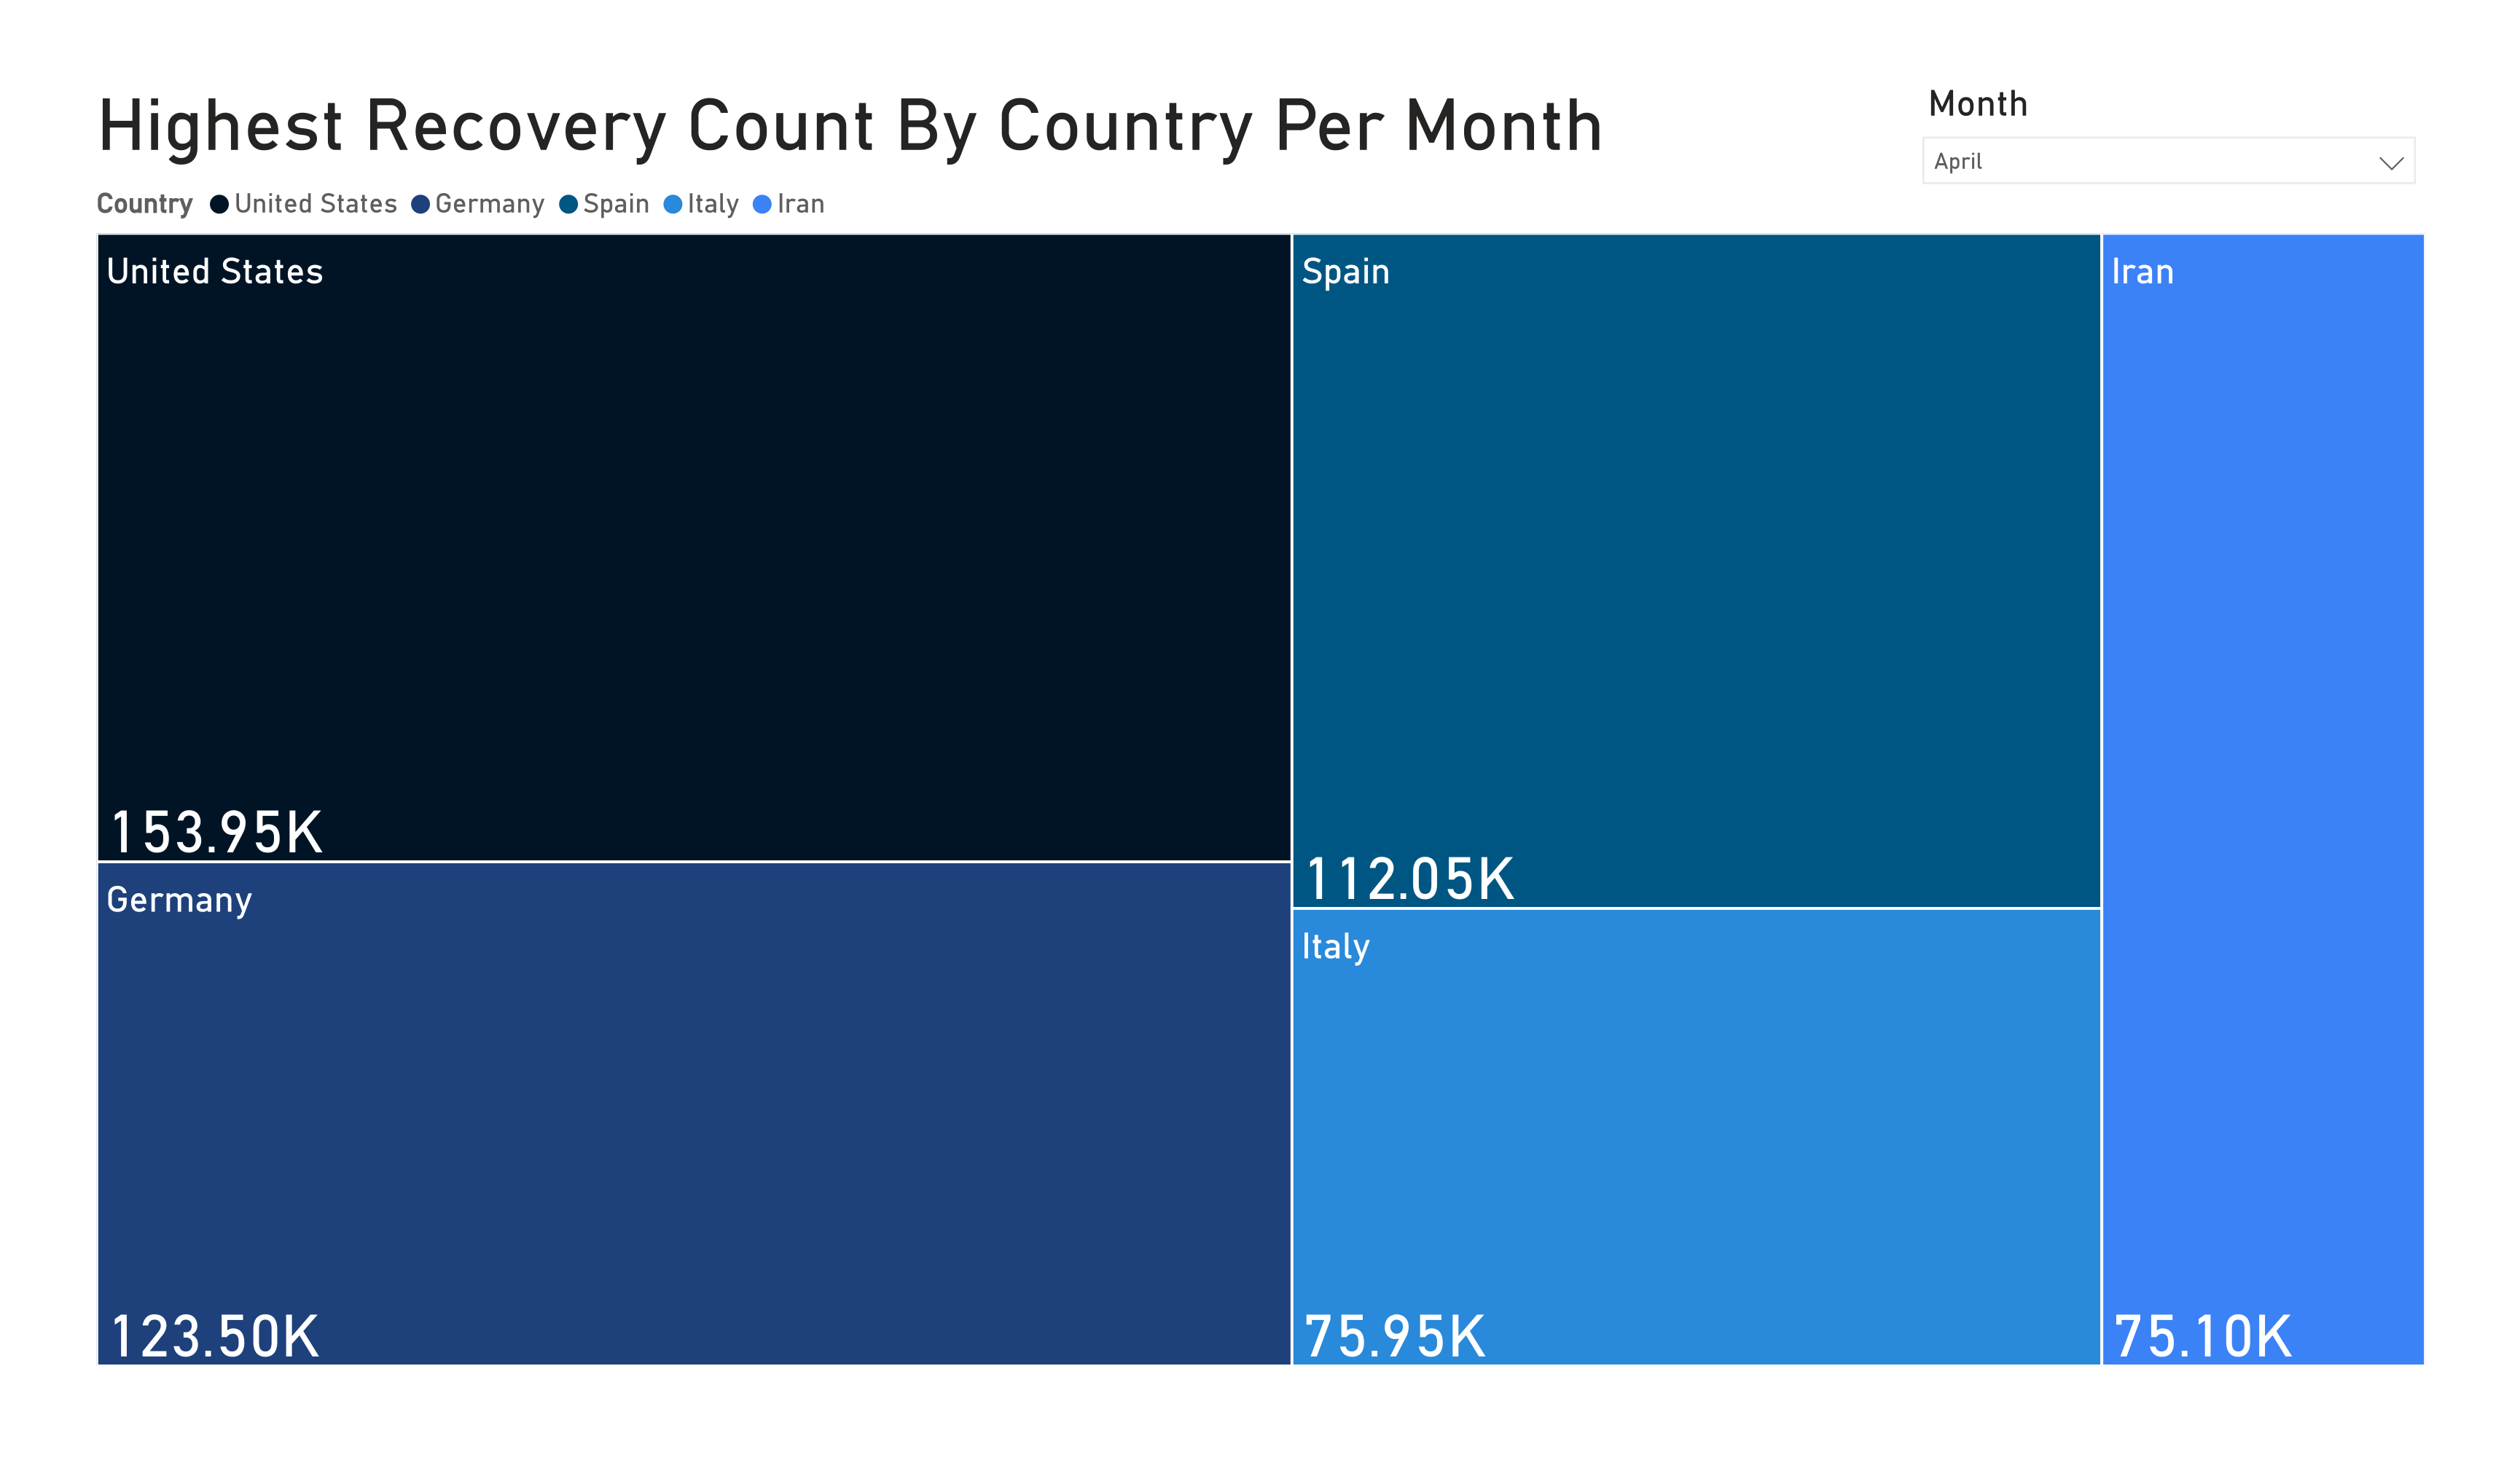
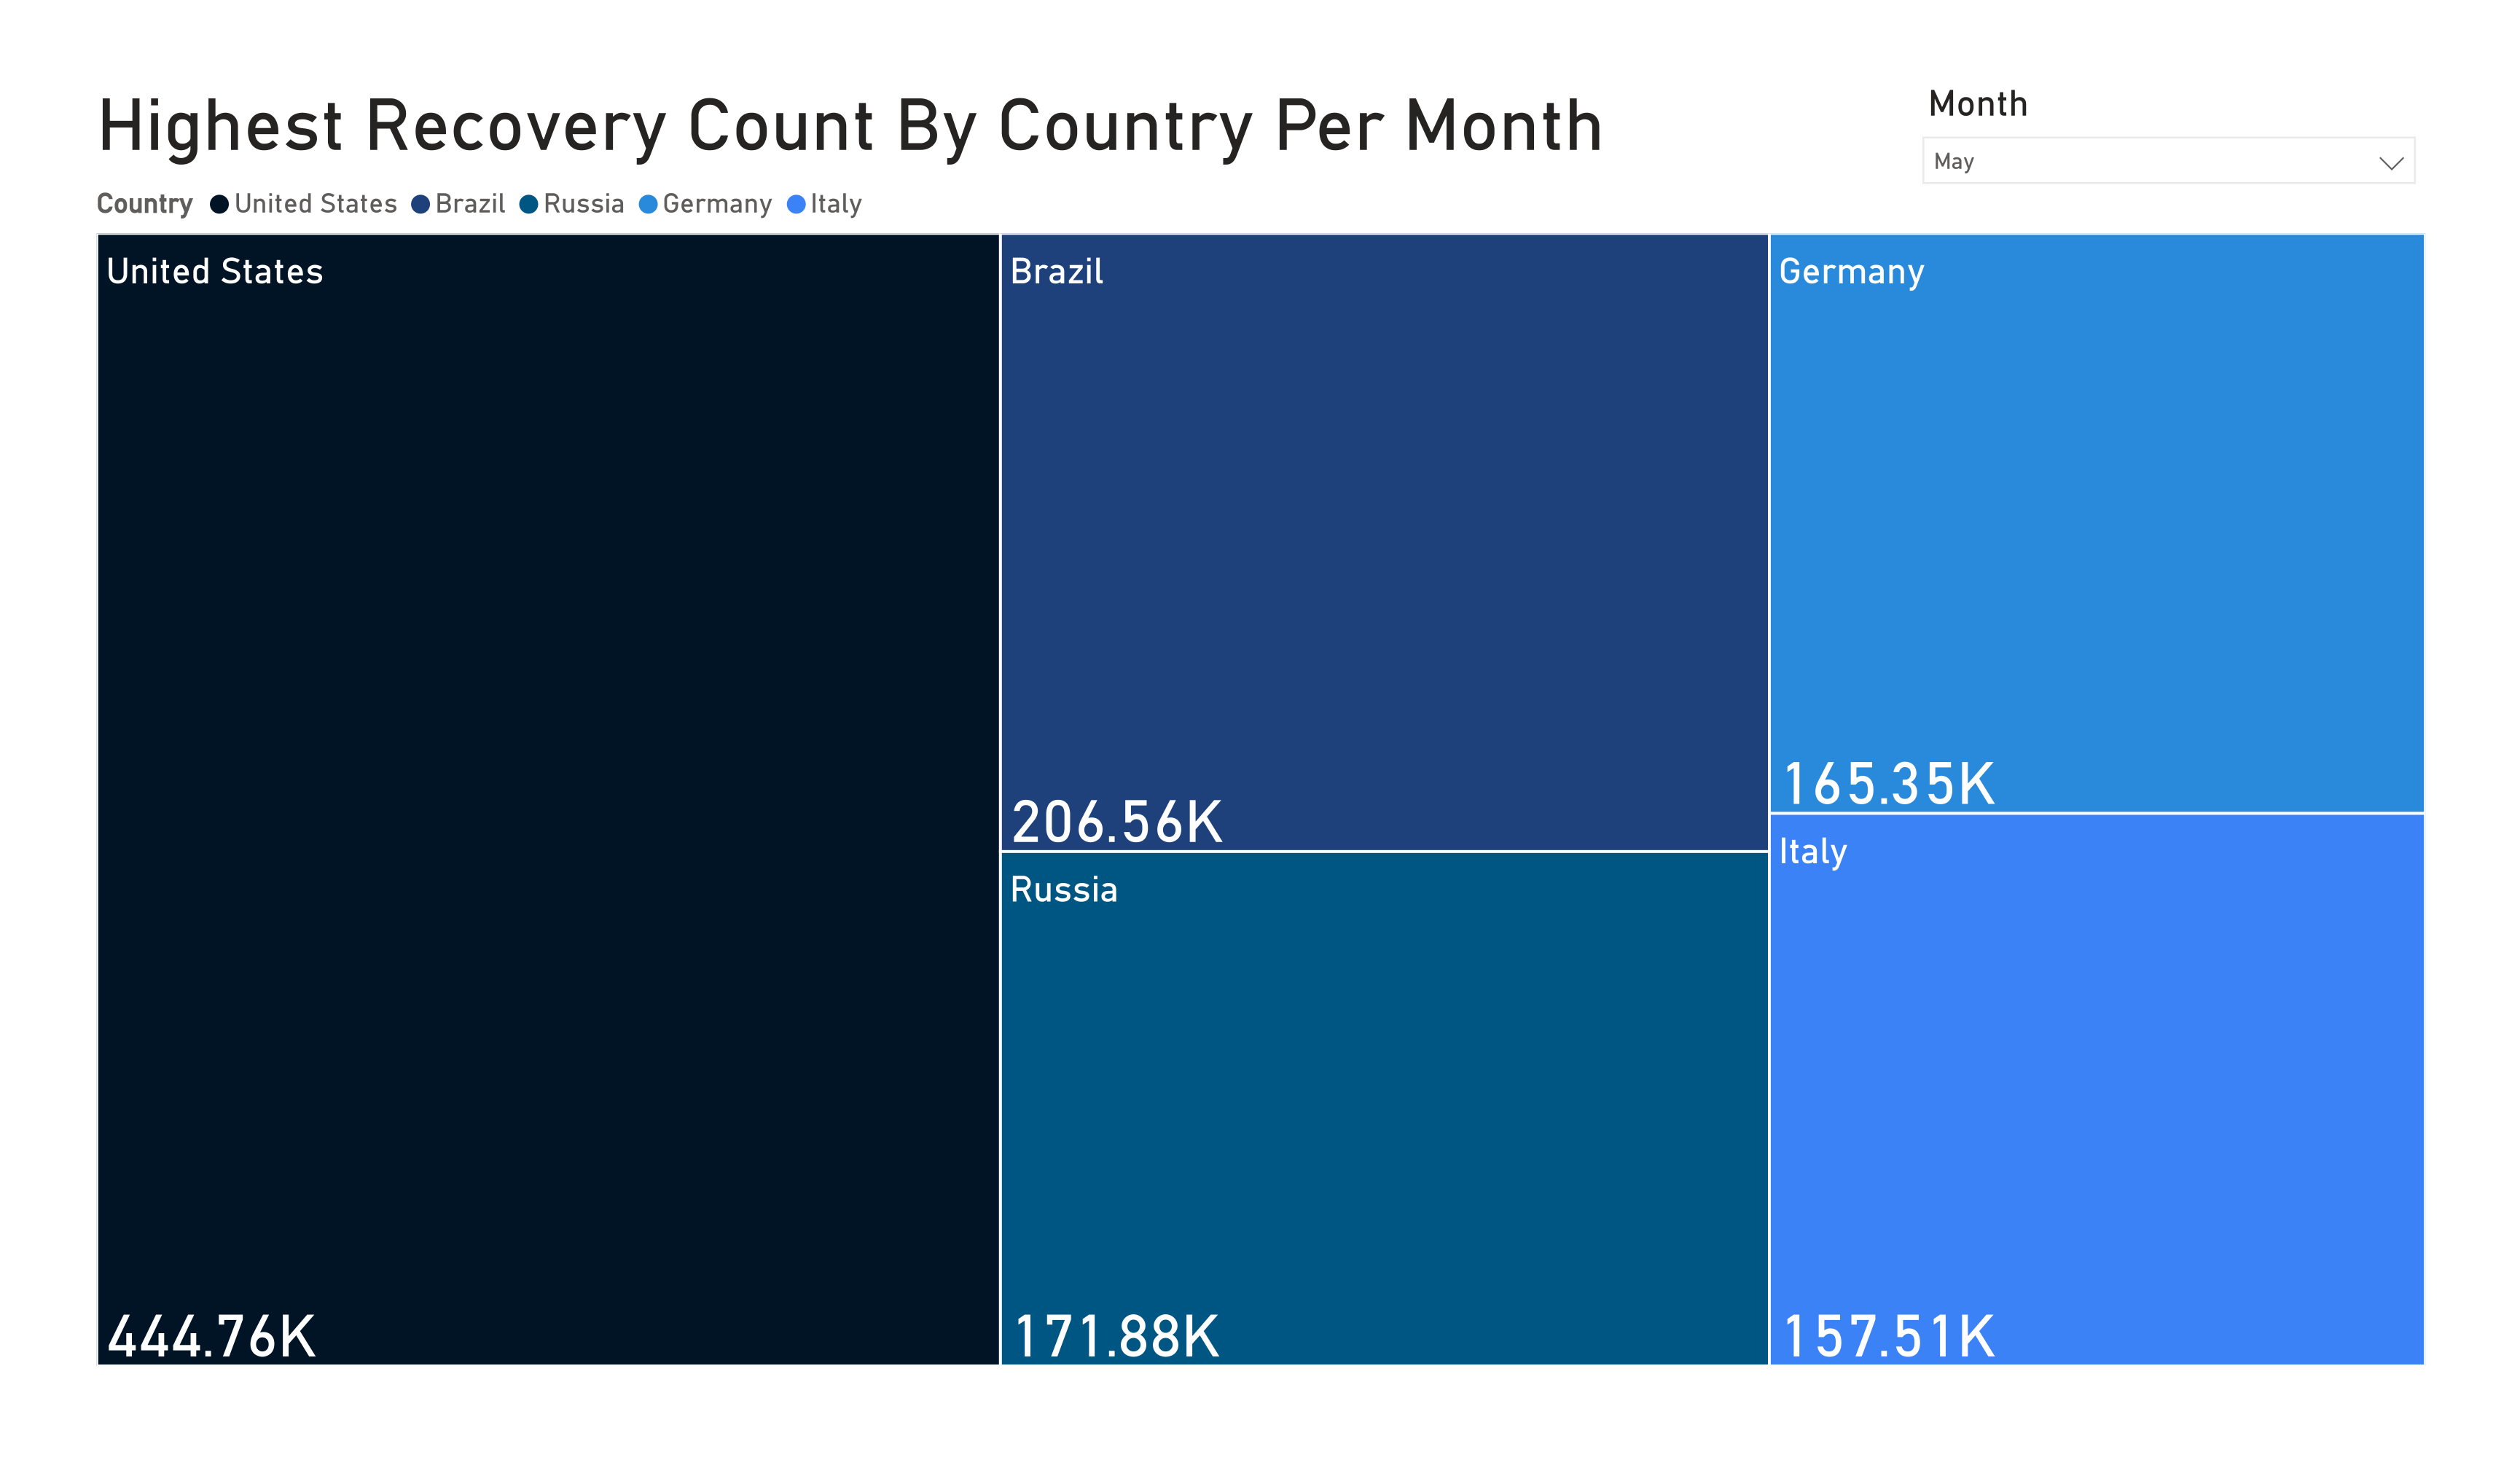
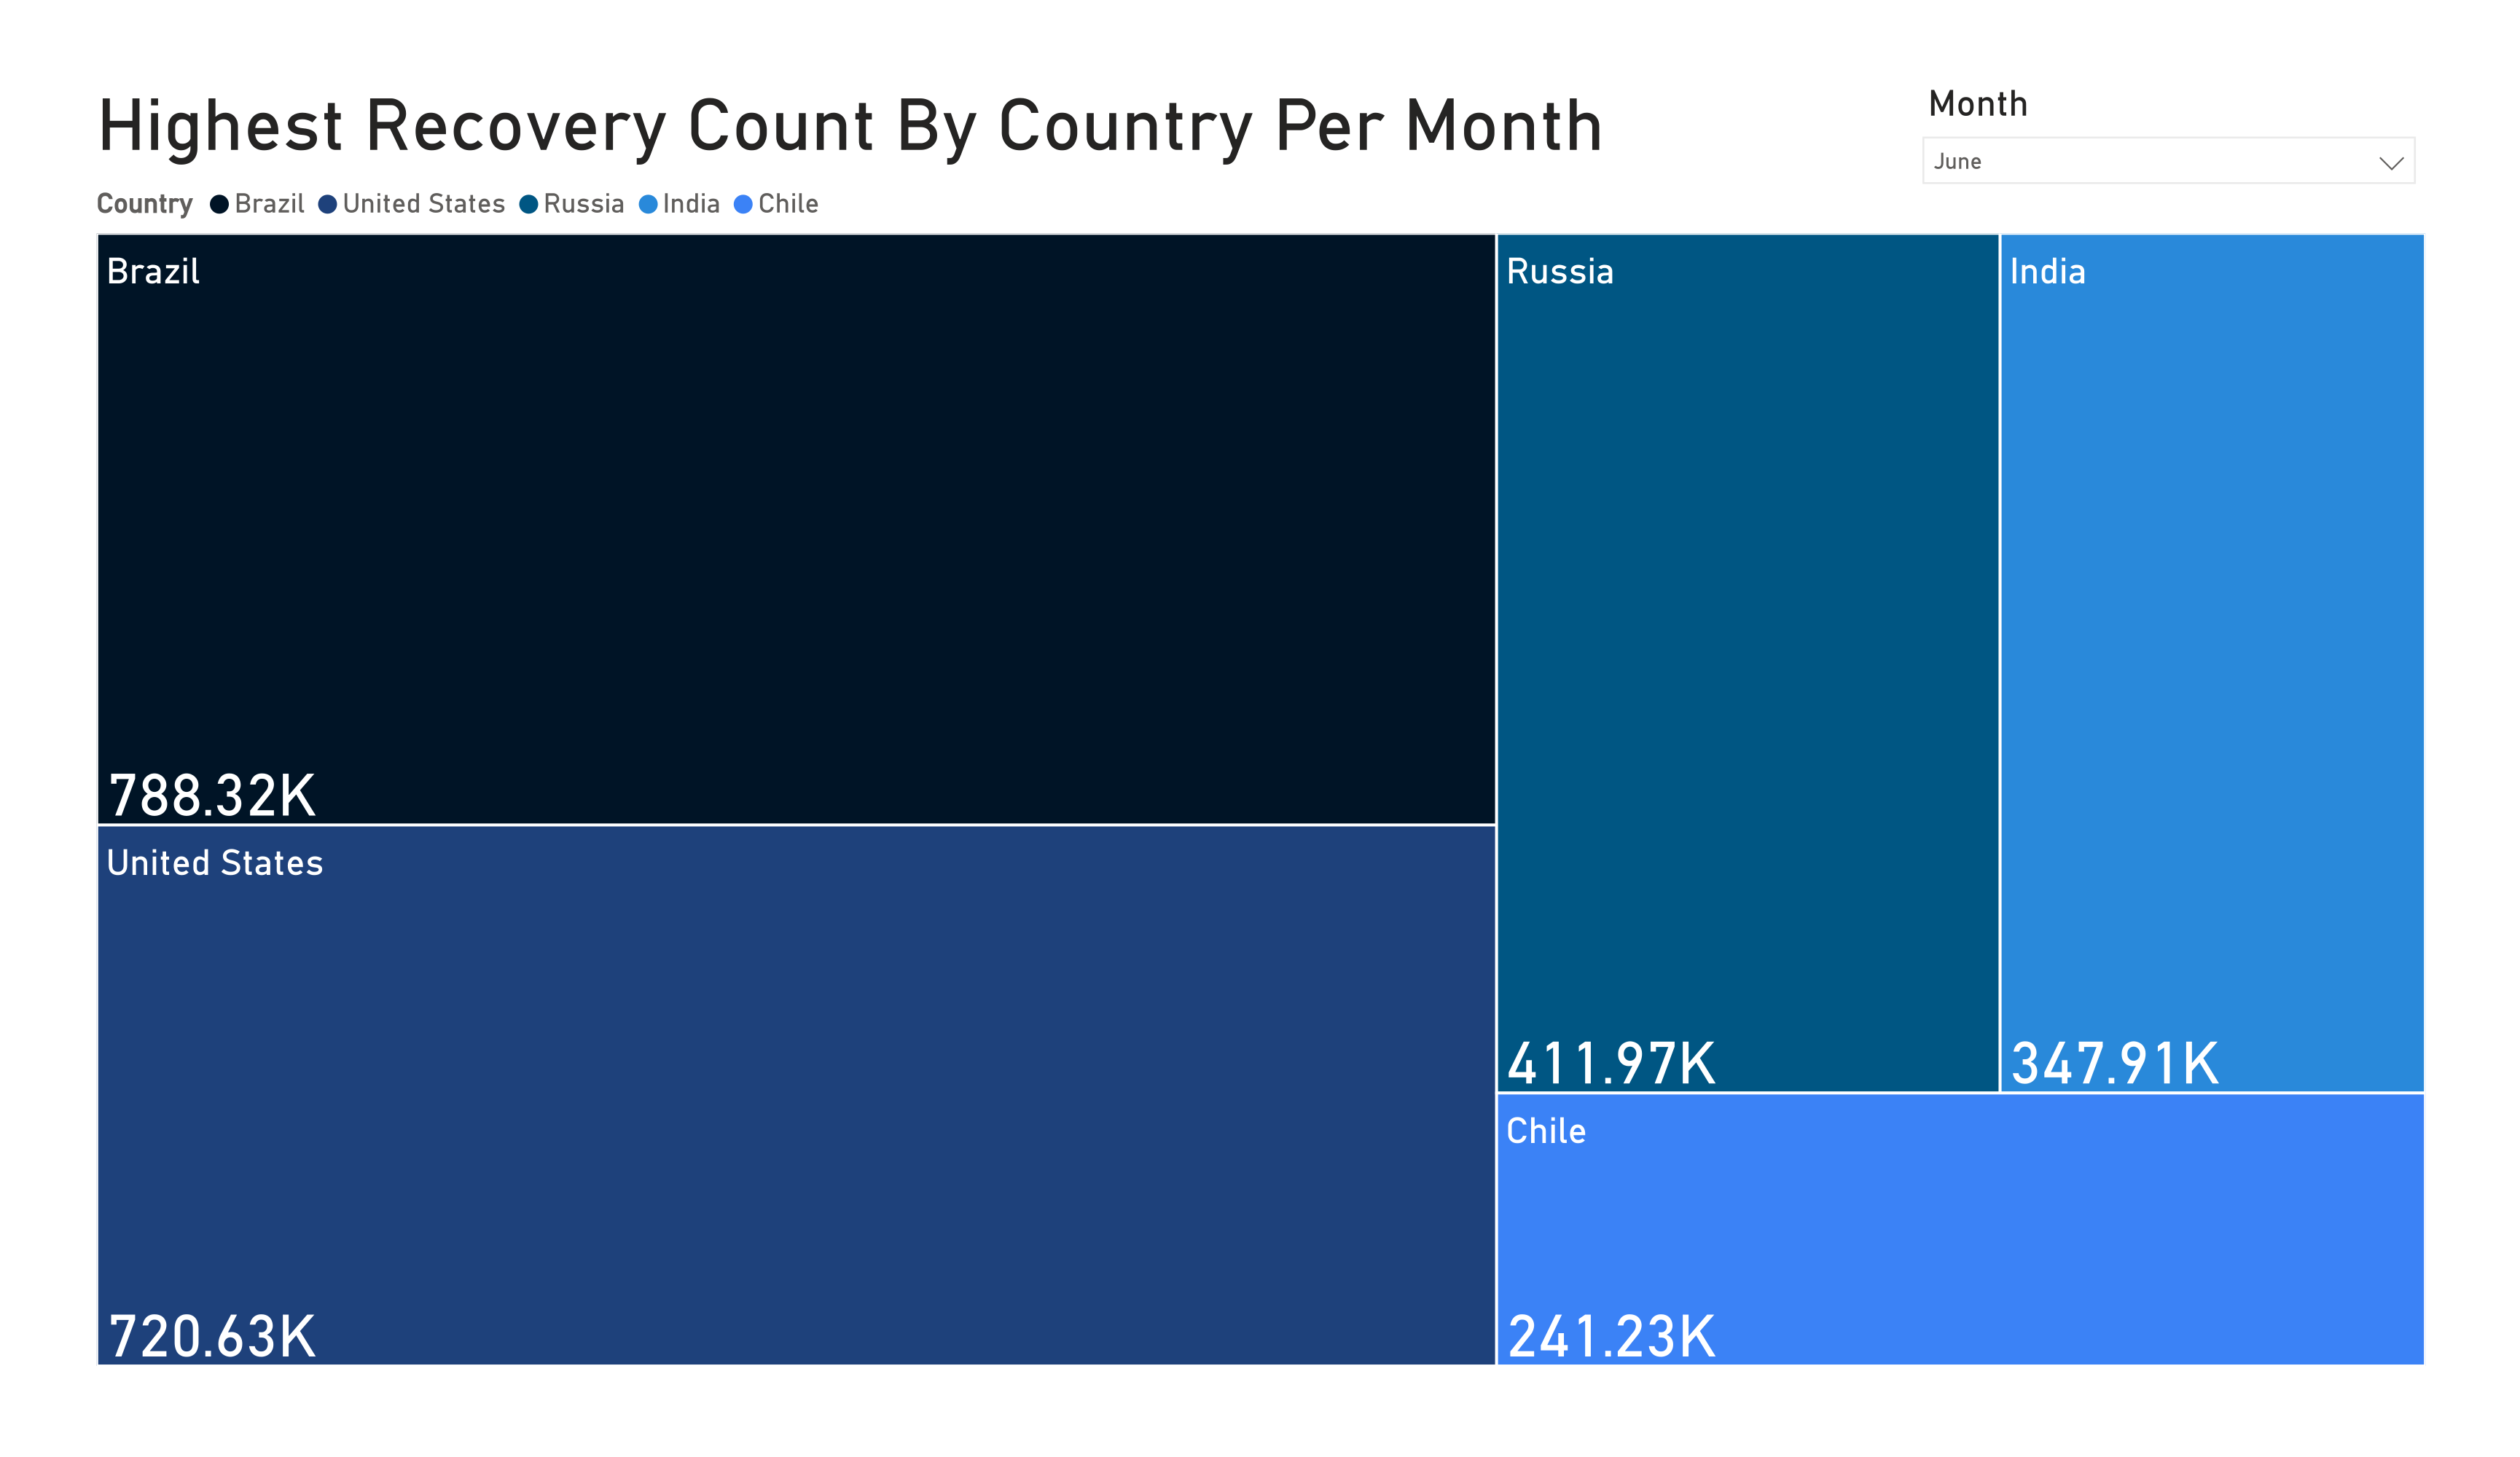
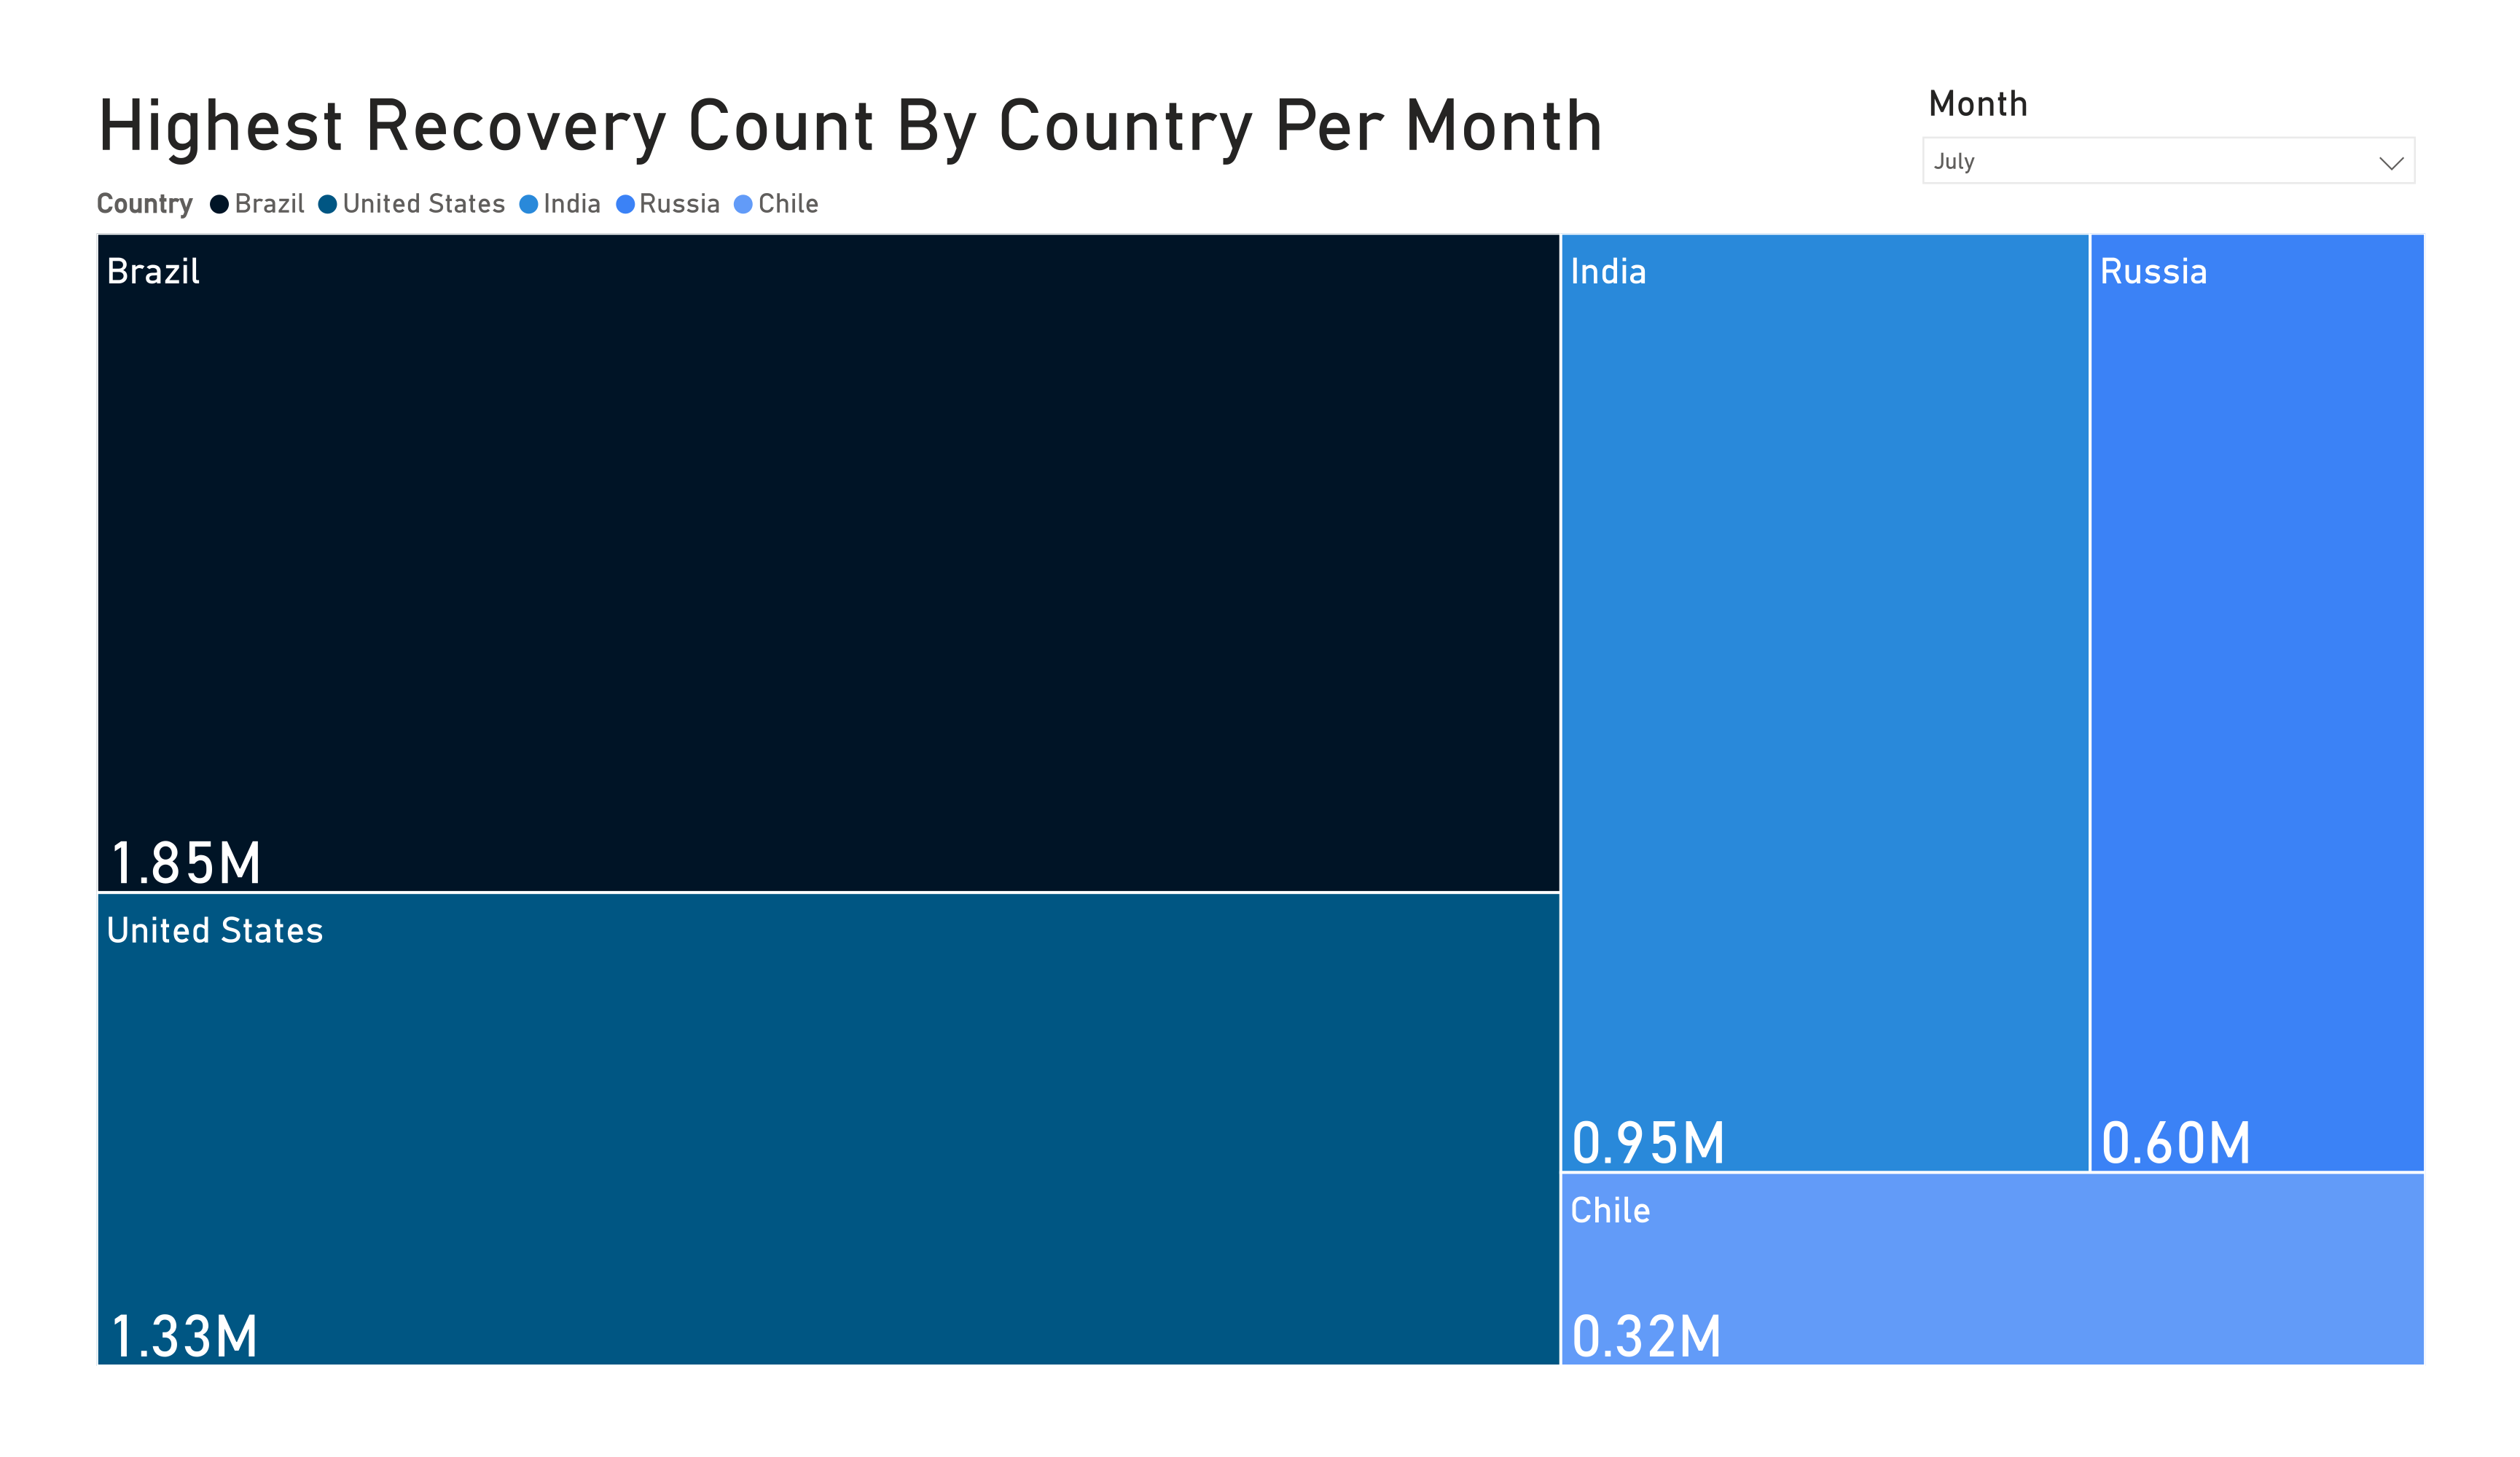
Lorem ipsum dolor sit amet, consectetur adipiscing elit, sed do eiusmod tempor incididunt ut labore et dolore magna aliqua. Ut enim ad minim veniam, quis nostrud exercitation ullamco laboris nisi ut aliquip ex ea commodo consequat. Duis aute irure dolor in reprehenderit in voluptate velit esse cillum dolore eu fugiat nulla pariatur. Excepteur sint occaecat cupidatat non proident, sunt in culpa qui officia deserunt mollit anim id est laborum.
Regional Percentages
What are the percentages of cumulative death counts among the different WHO regions?

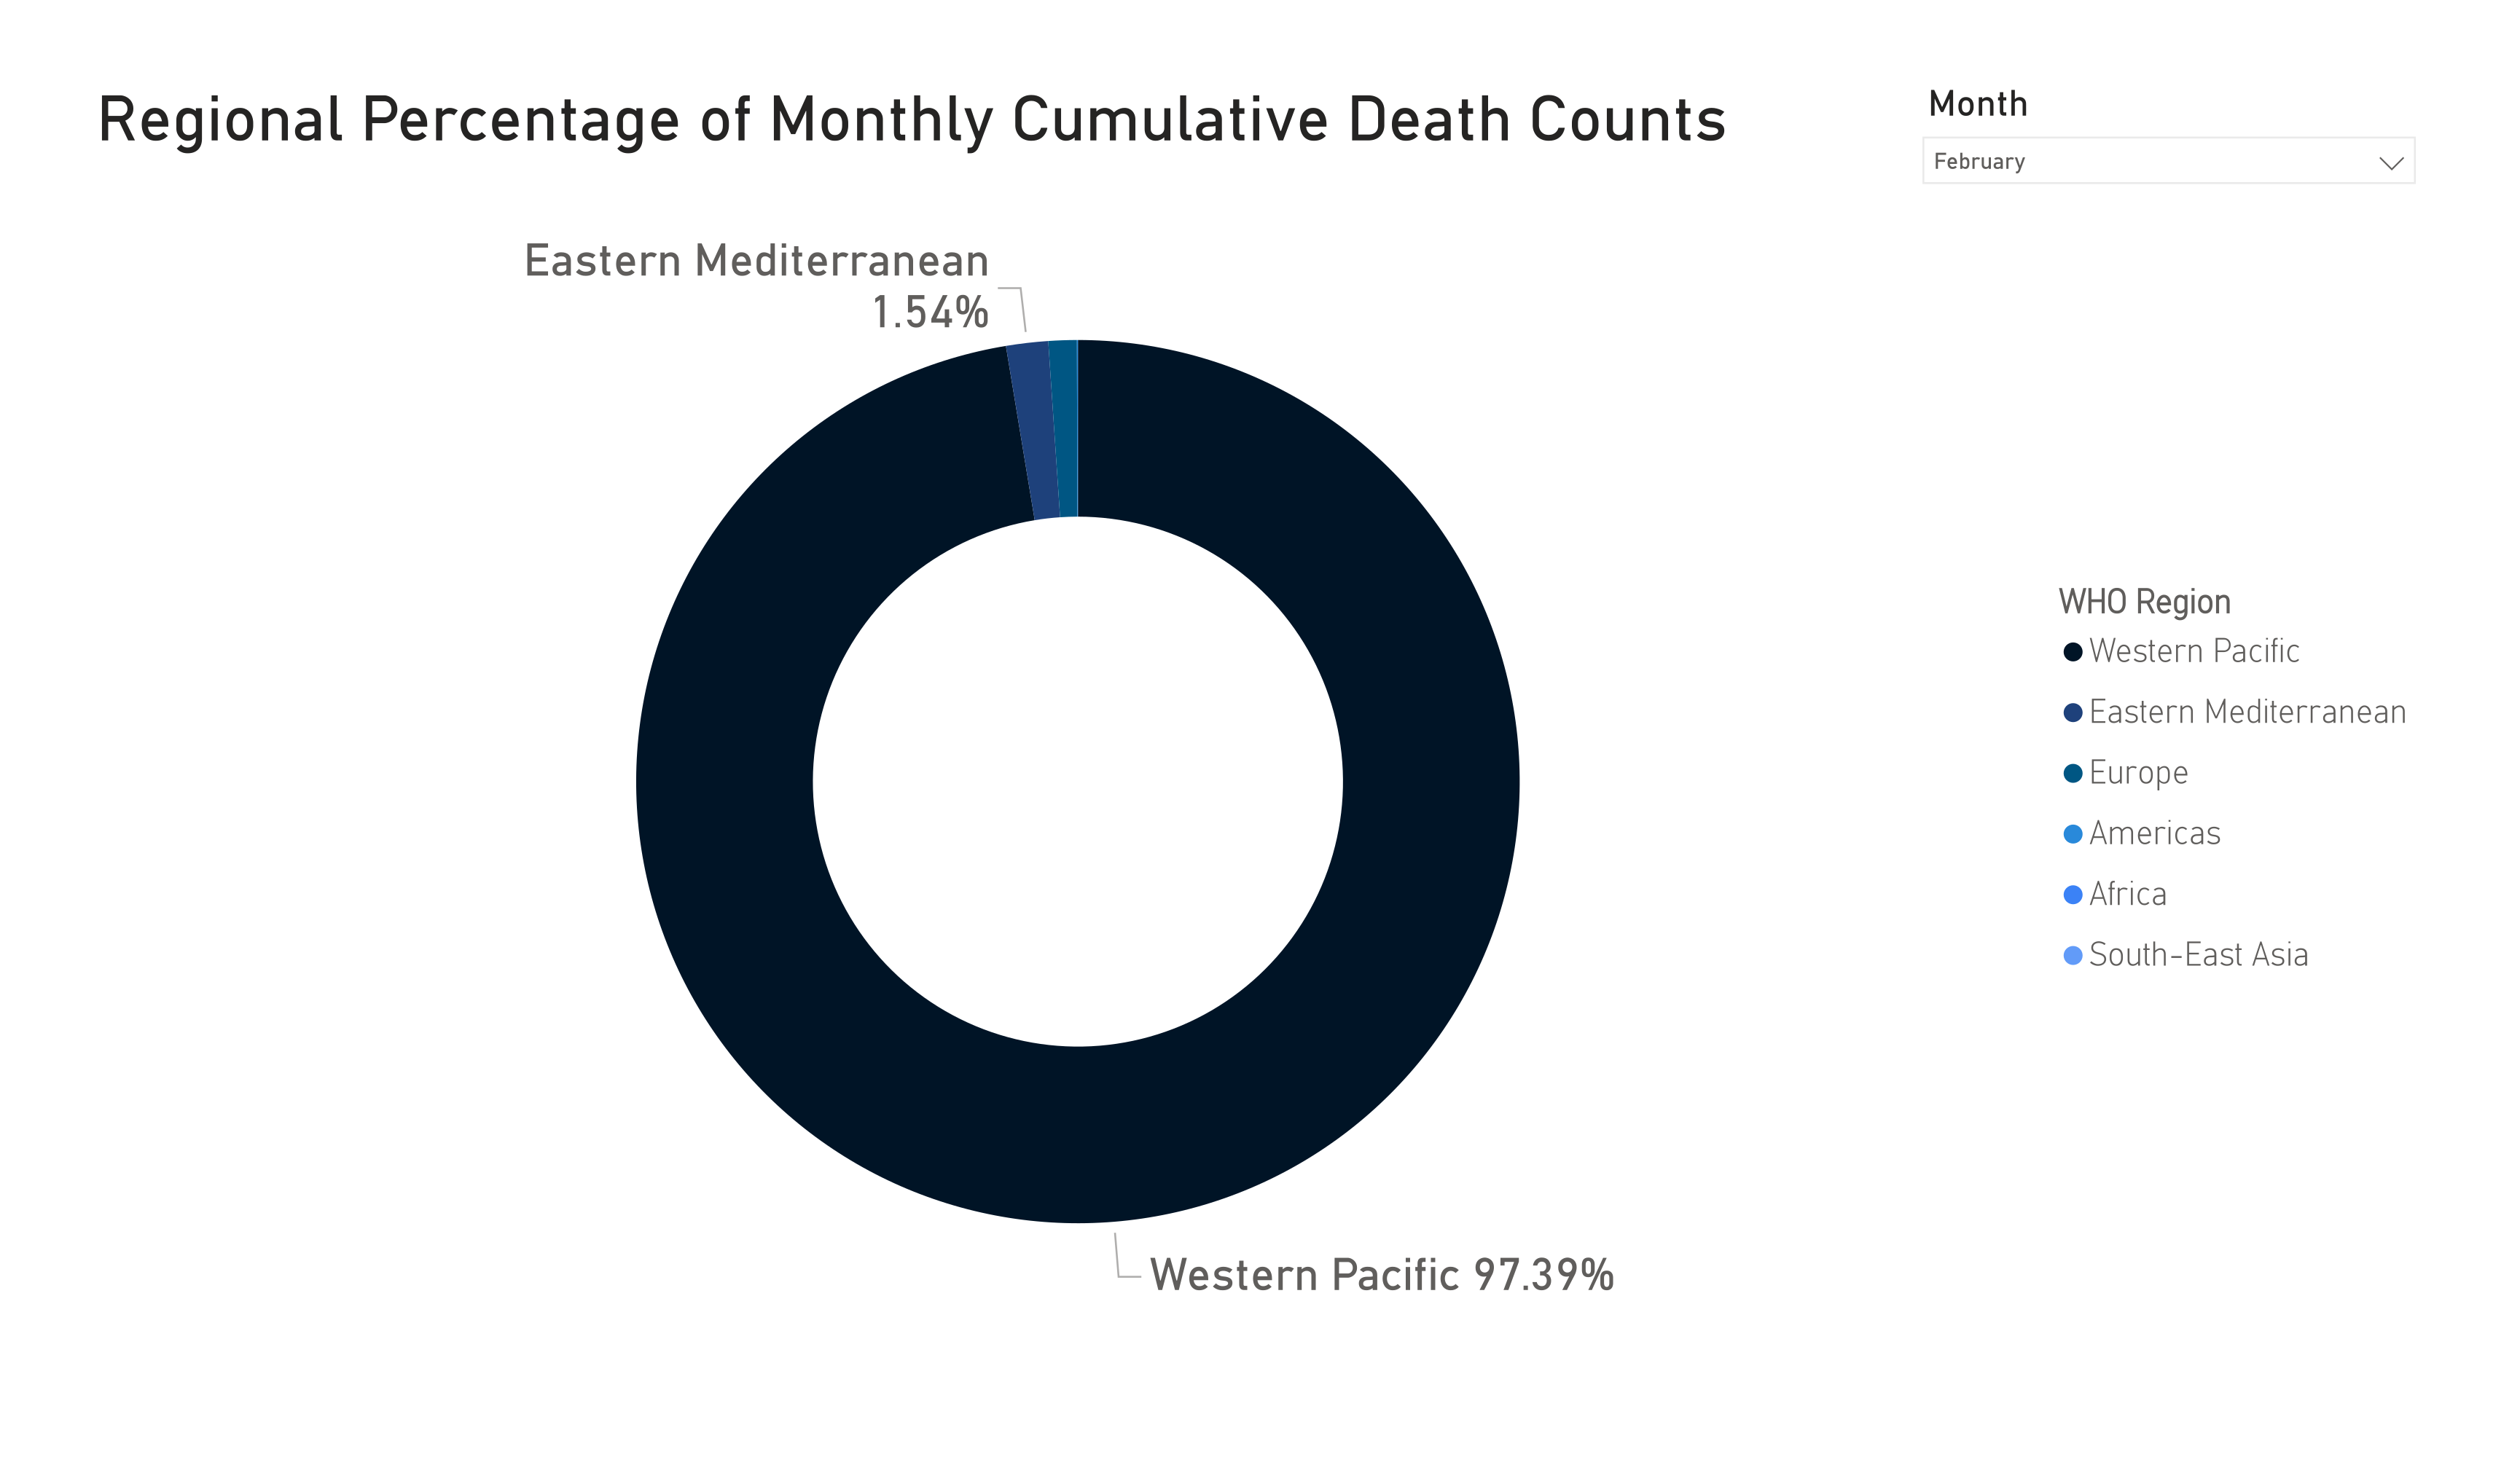


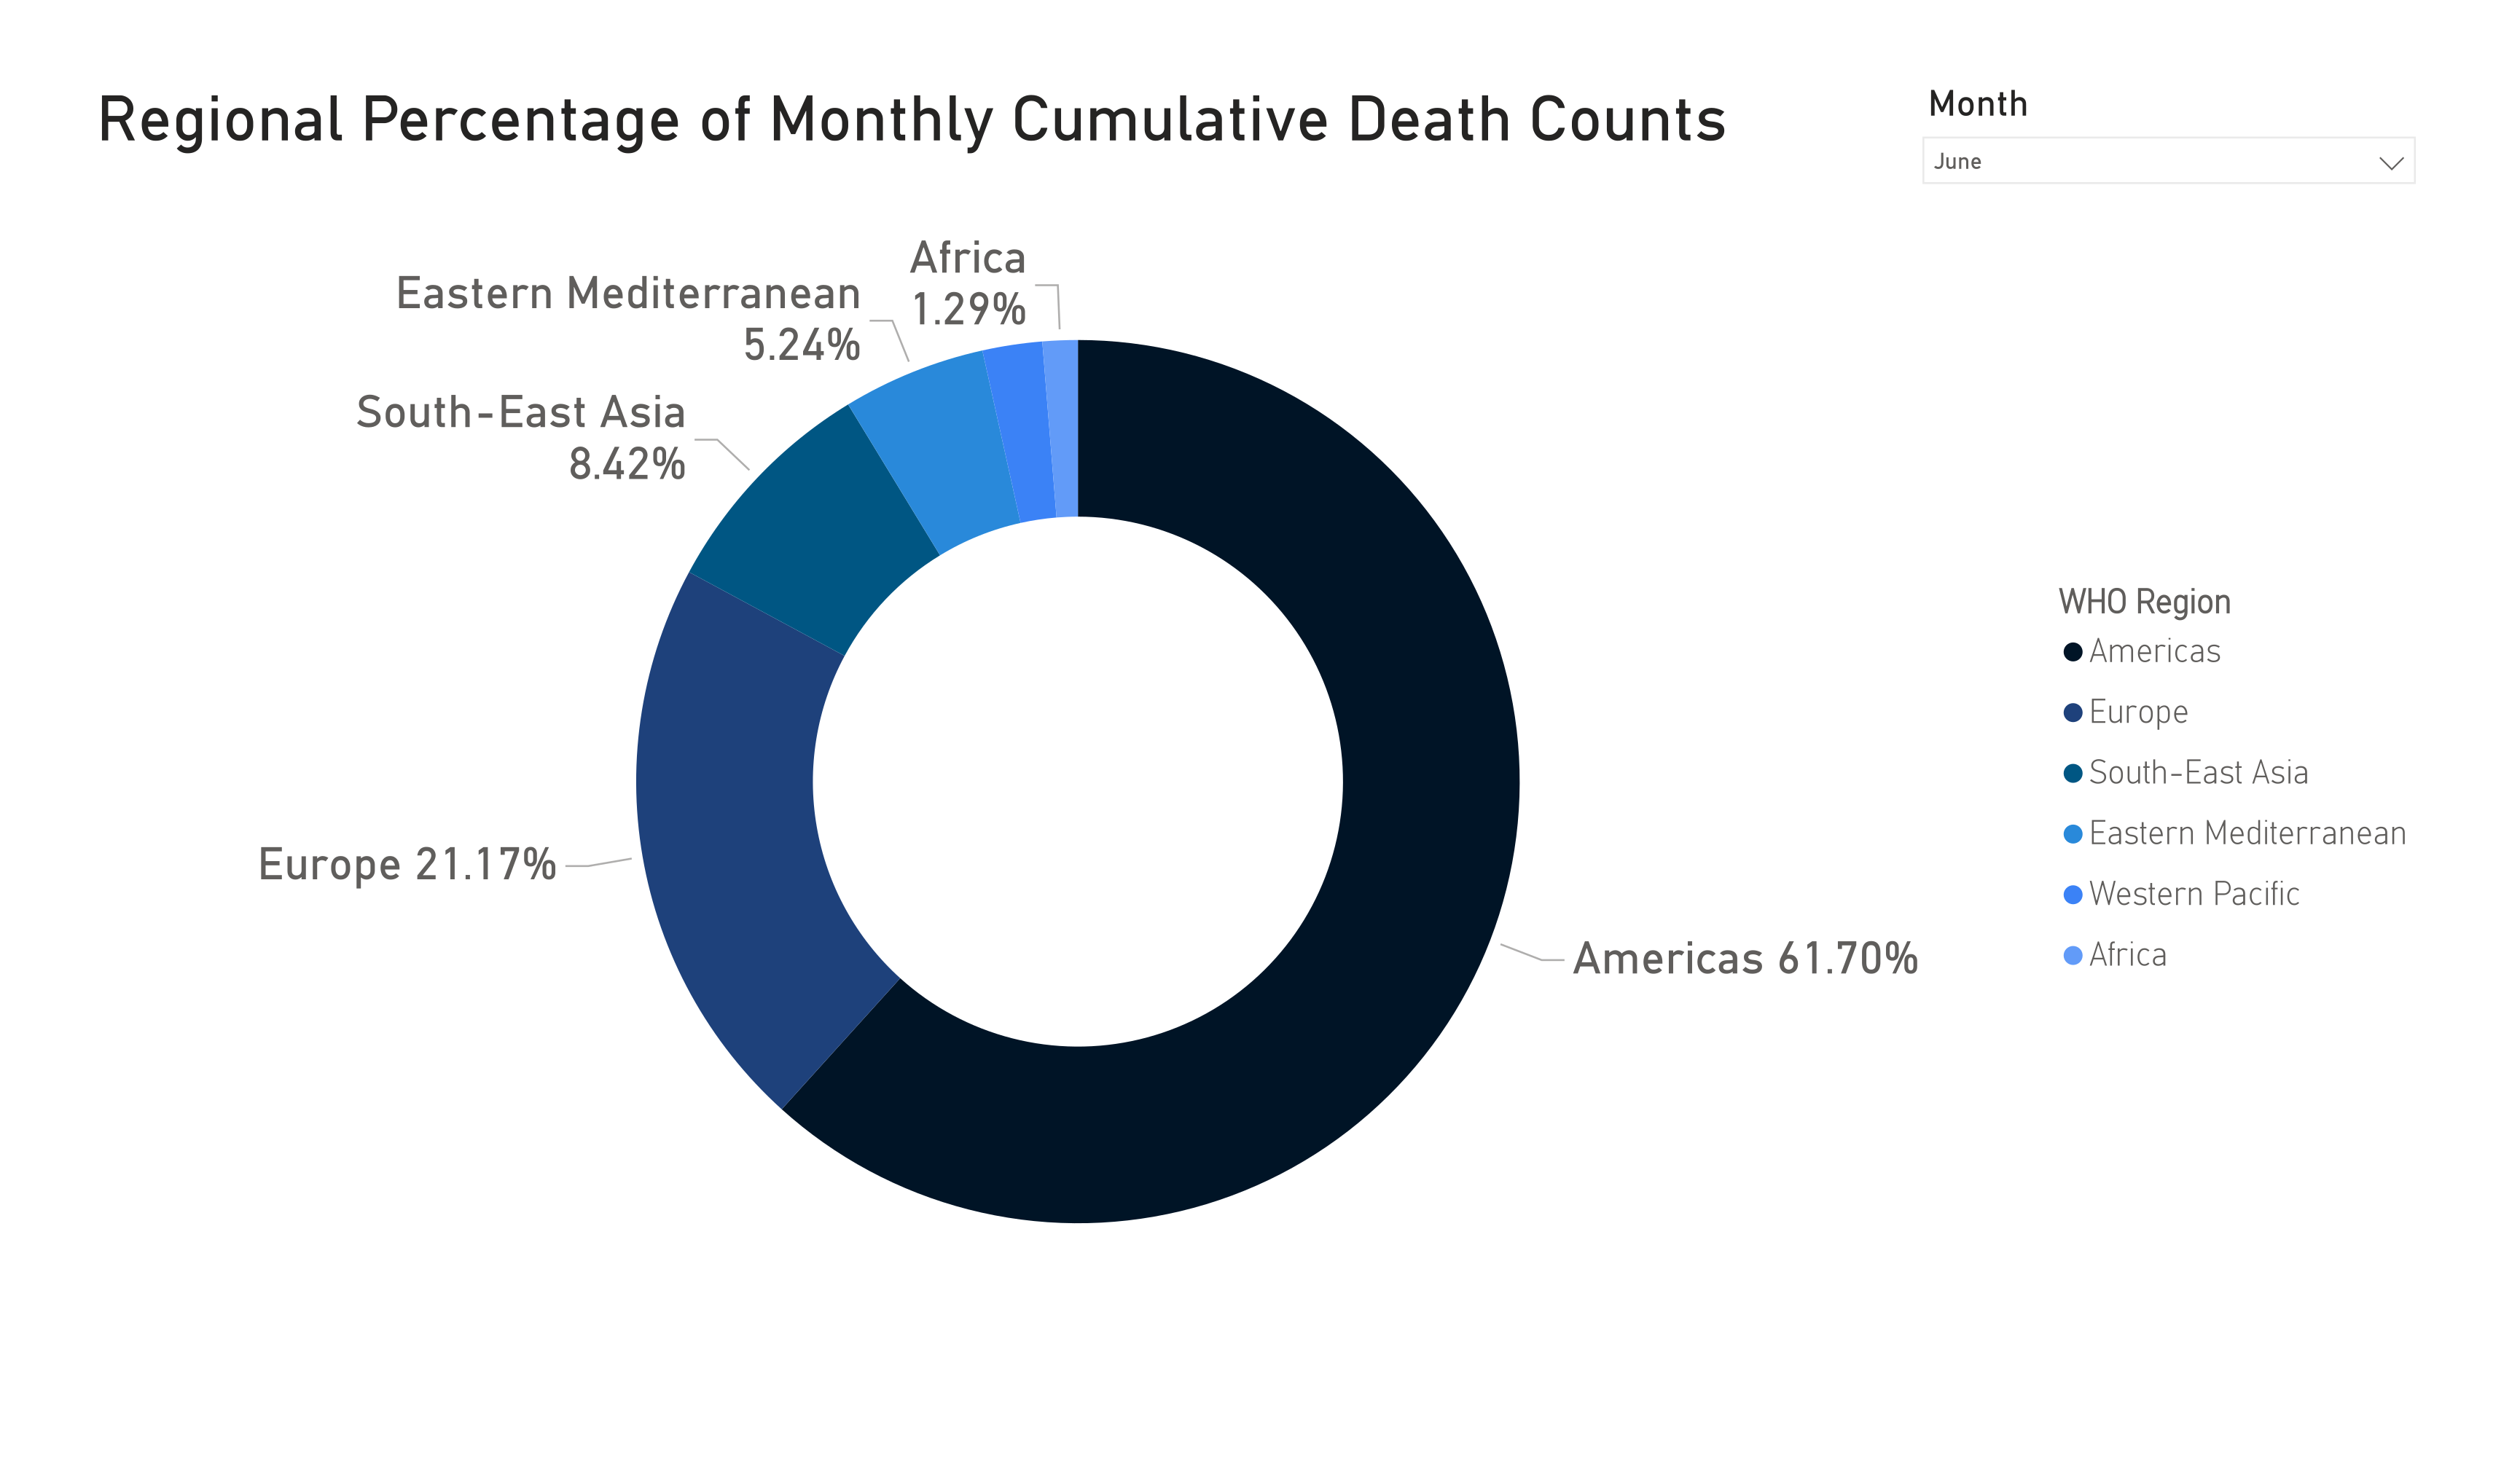

Lorem ipsum dolor sit amet, consectetur adipiscing elit, sed do eiusmod tempor incididunt ut labore et dolore magna aliqua. Ut enim ad minim veniam, quis nostrud exercitation ullamco laboris nisi ut aliquip ex ea commodo consequat. Duis aute irure dolor in reprehenderit in voluptate velit esse cillum dolore eu fugiat nulla pariatur. Excepteur sint occaecat cupidatat non proident, sunt in culpa qui officia deserunt mollit anim id est laborum.
What are the percentages of cumulative recovery counts among the different WHO regions?
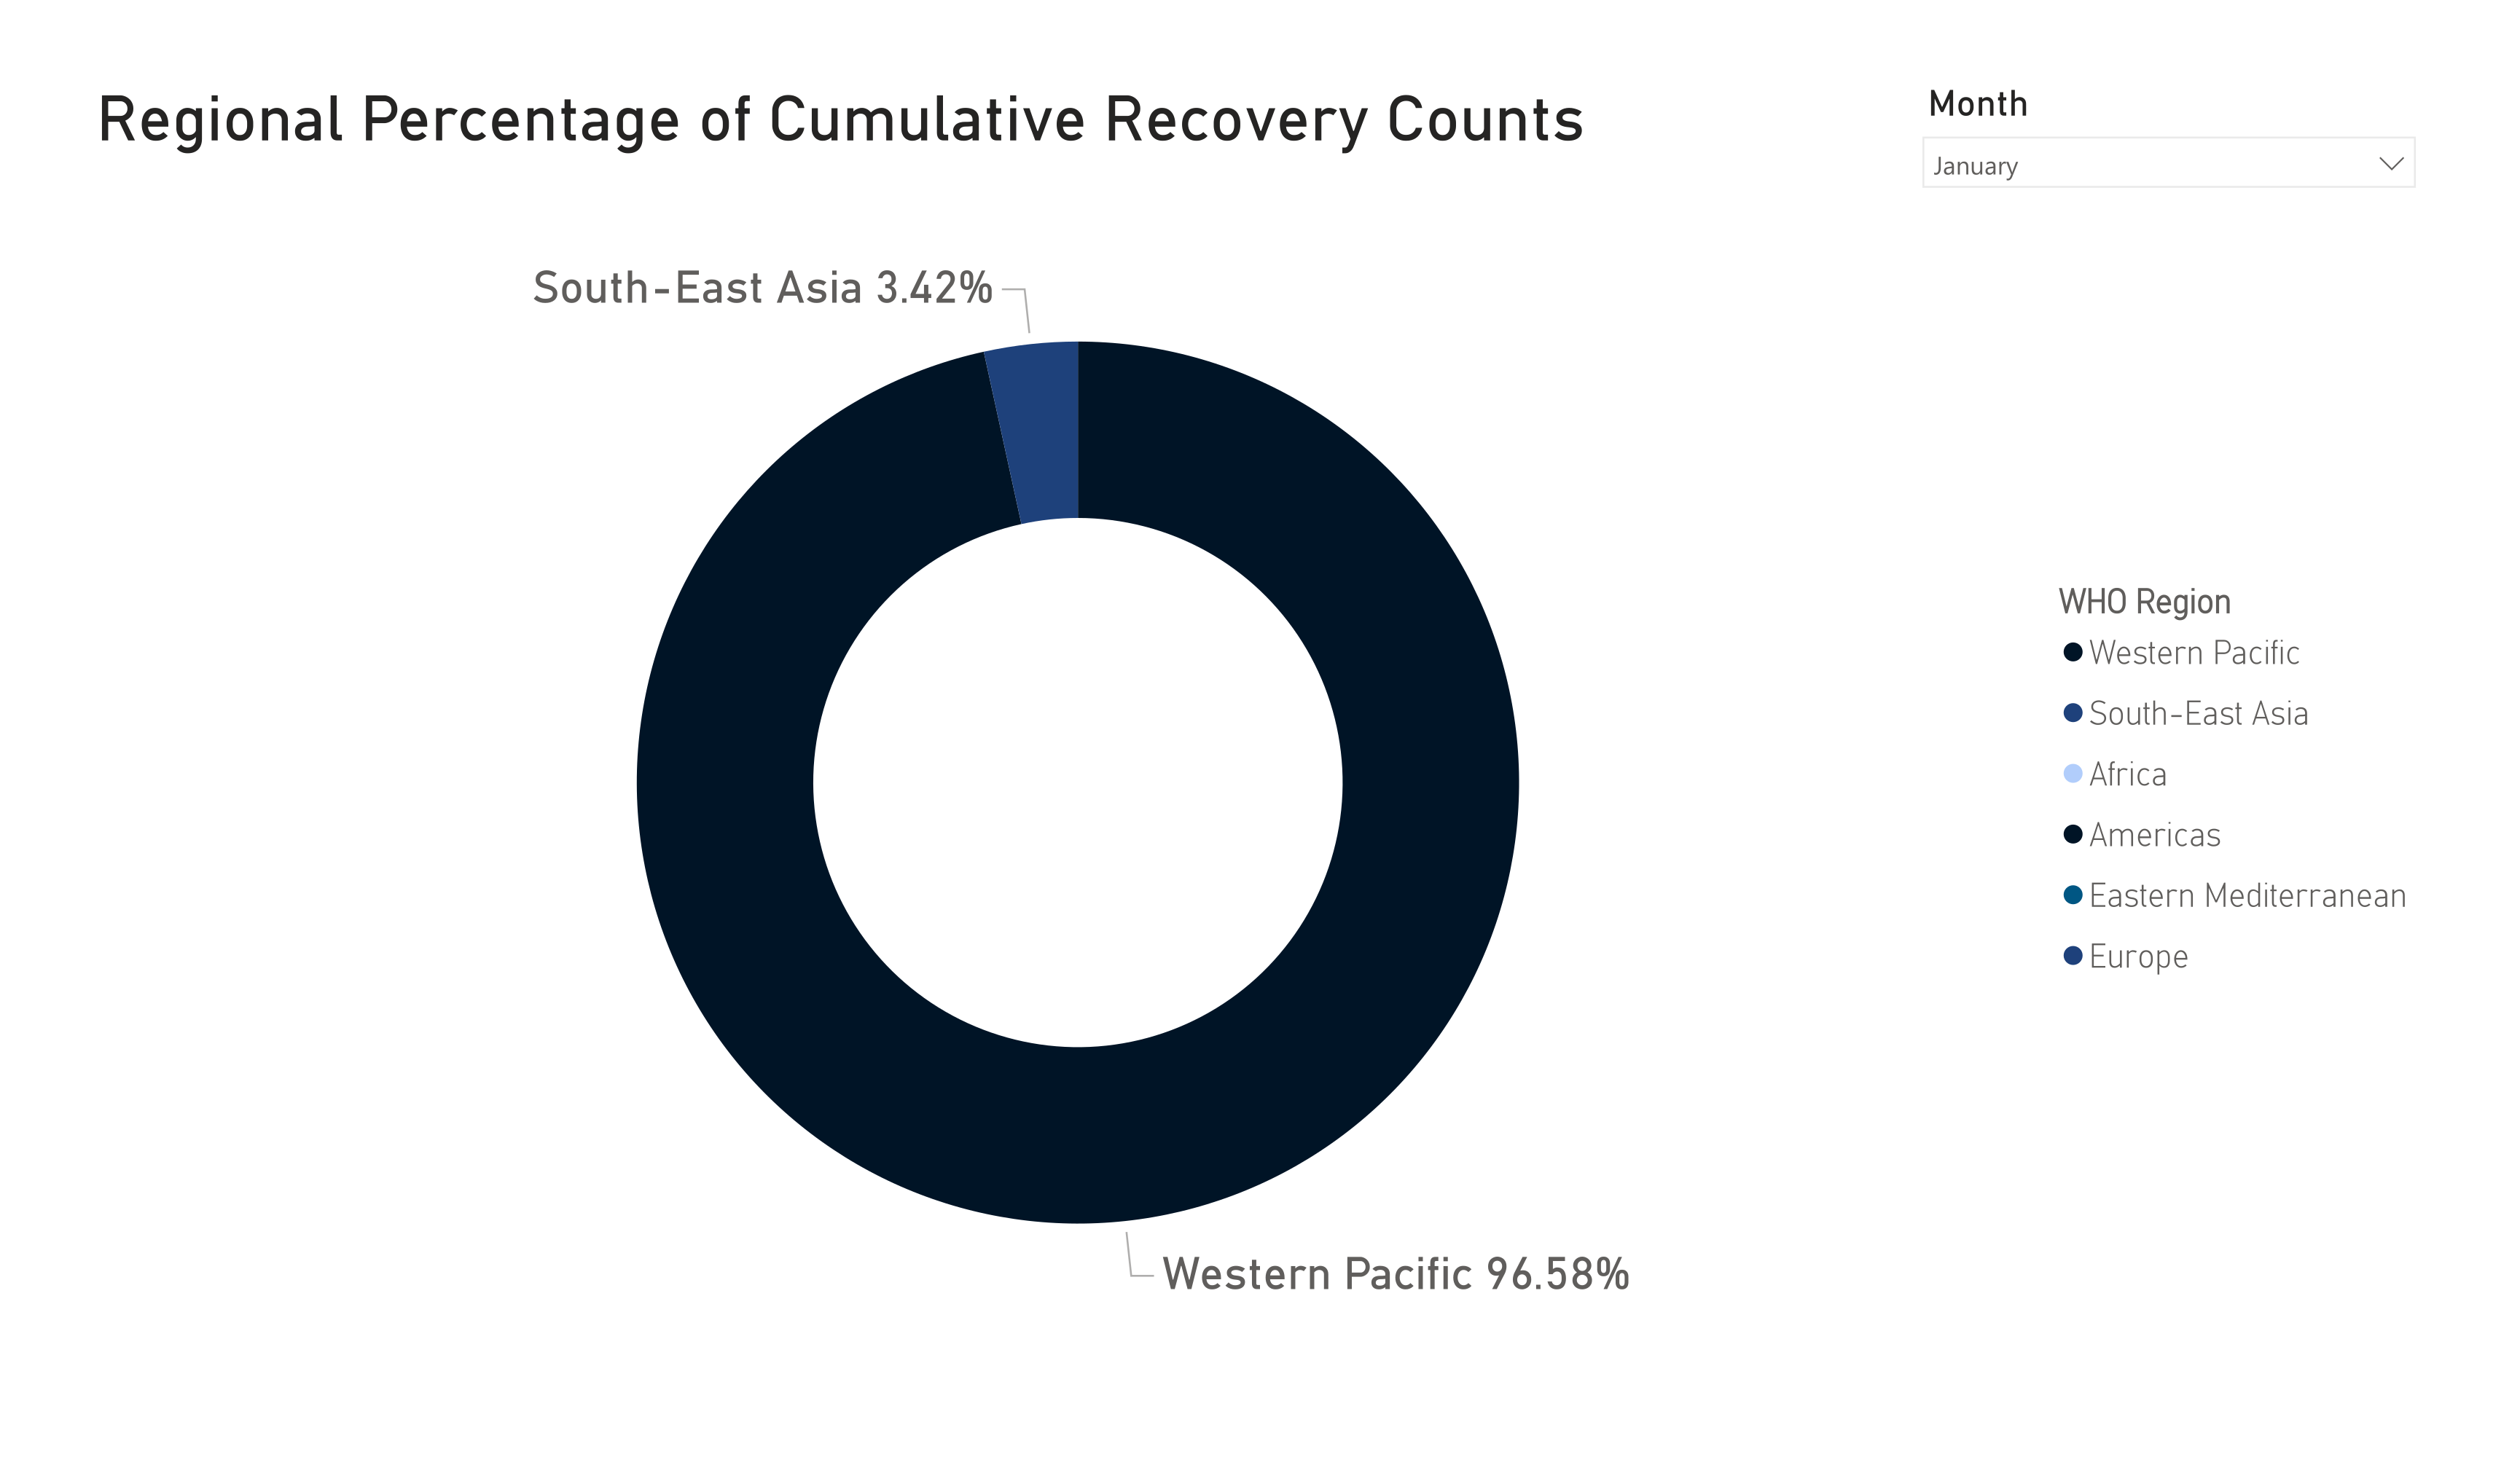
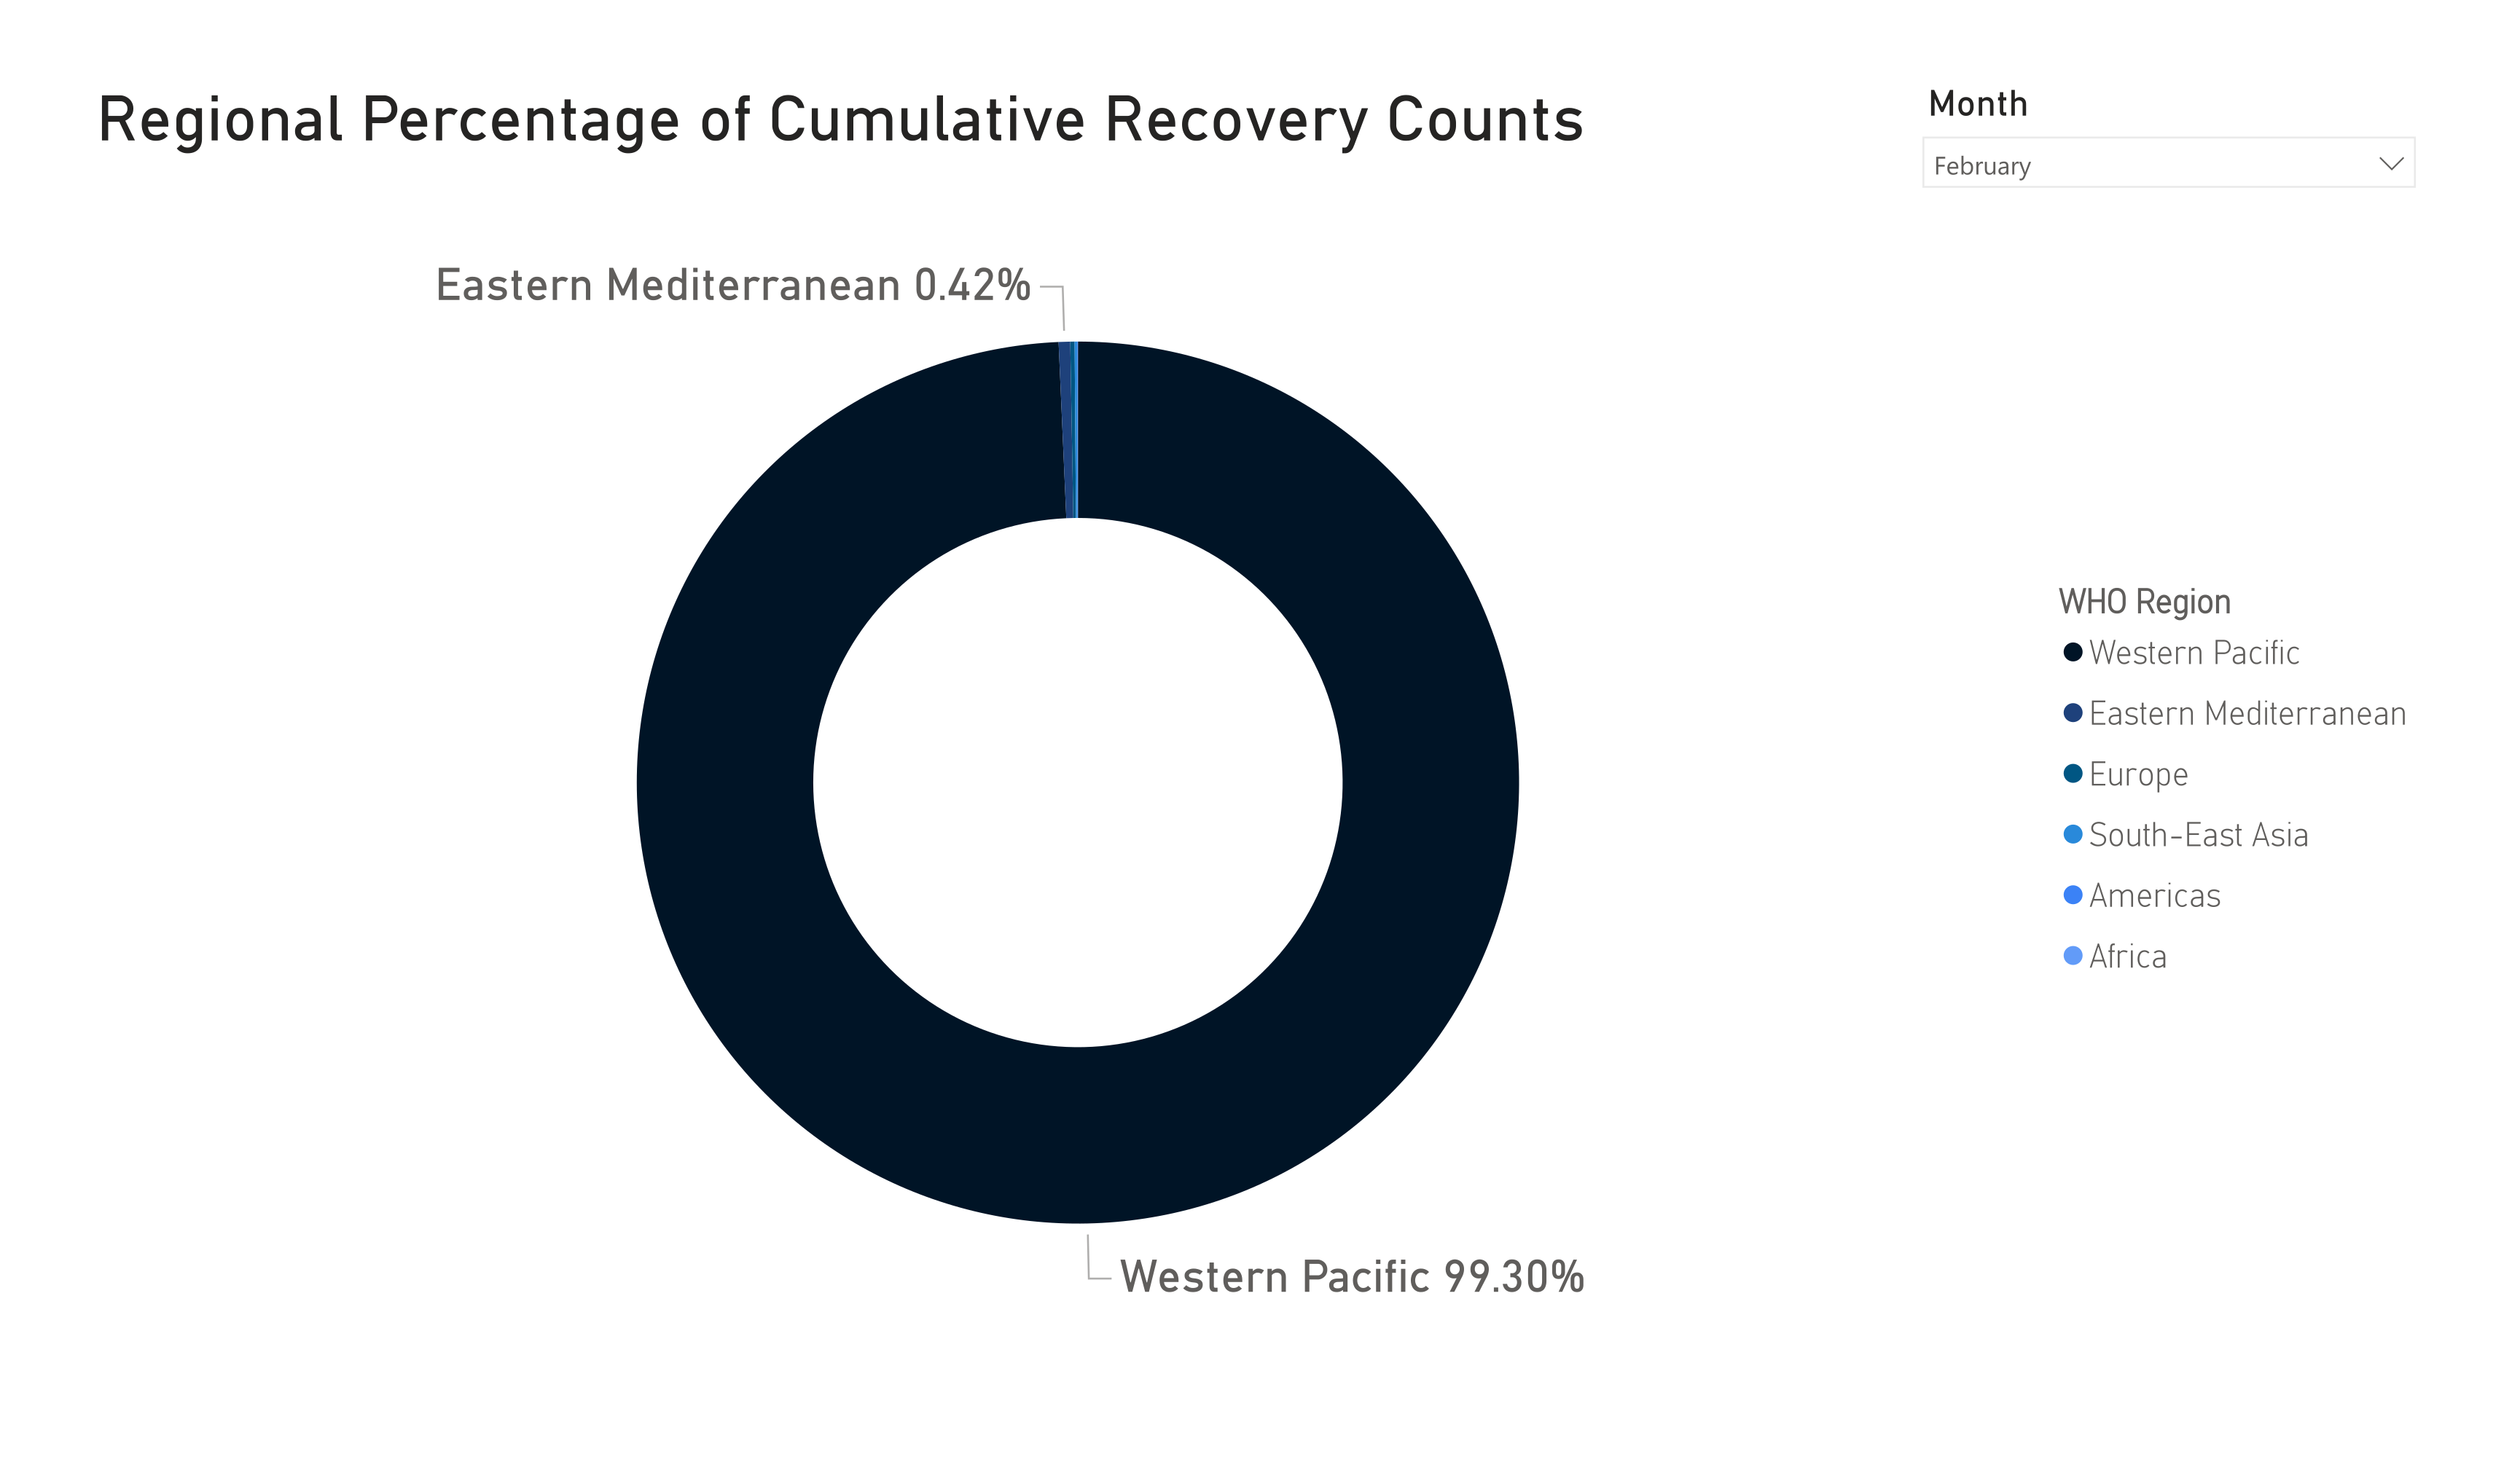

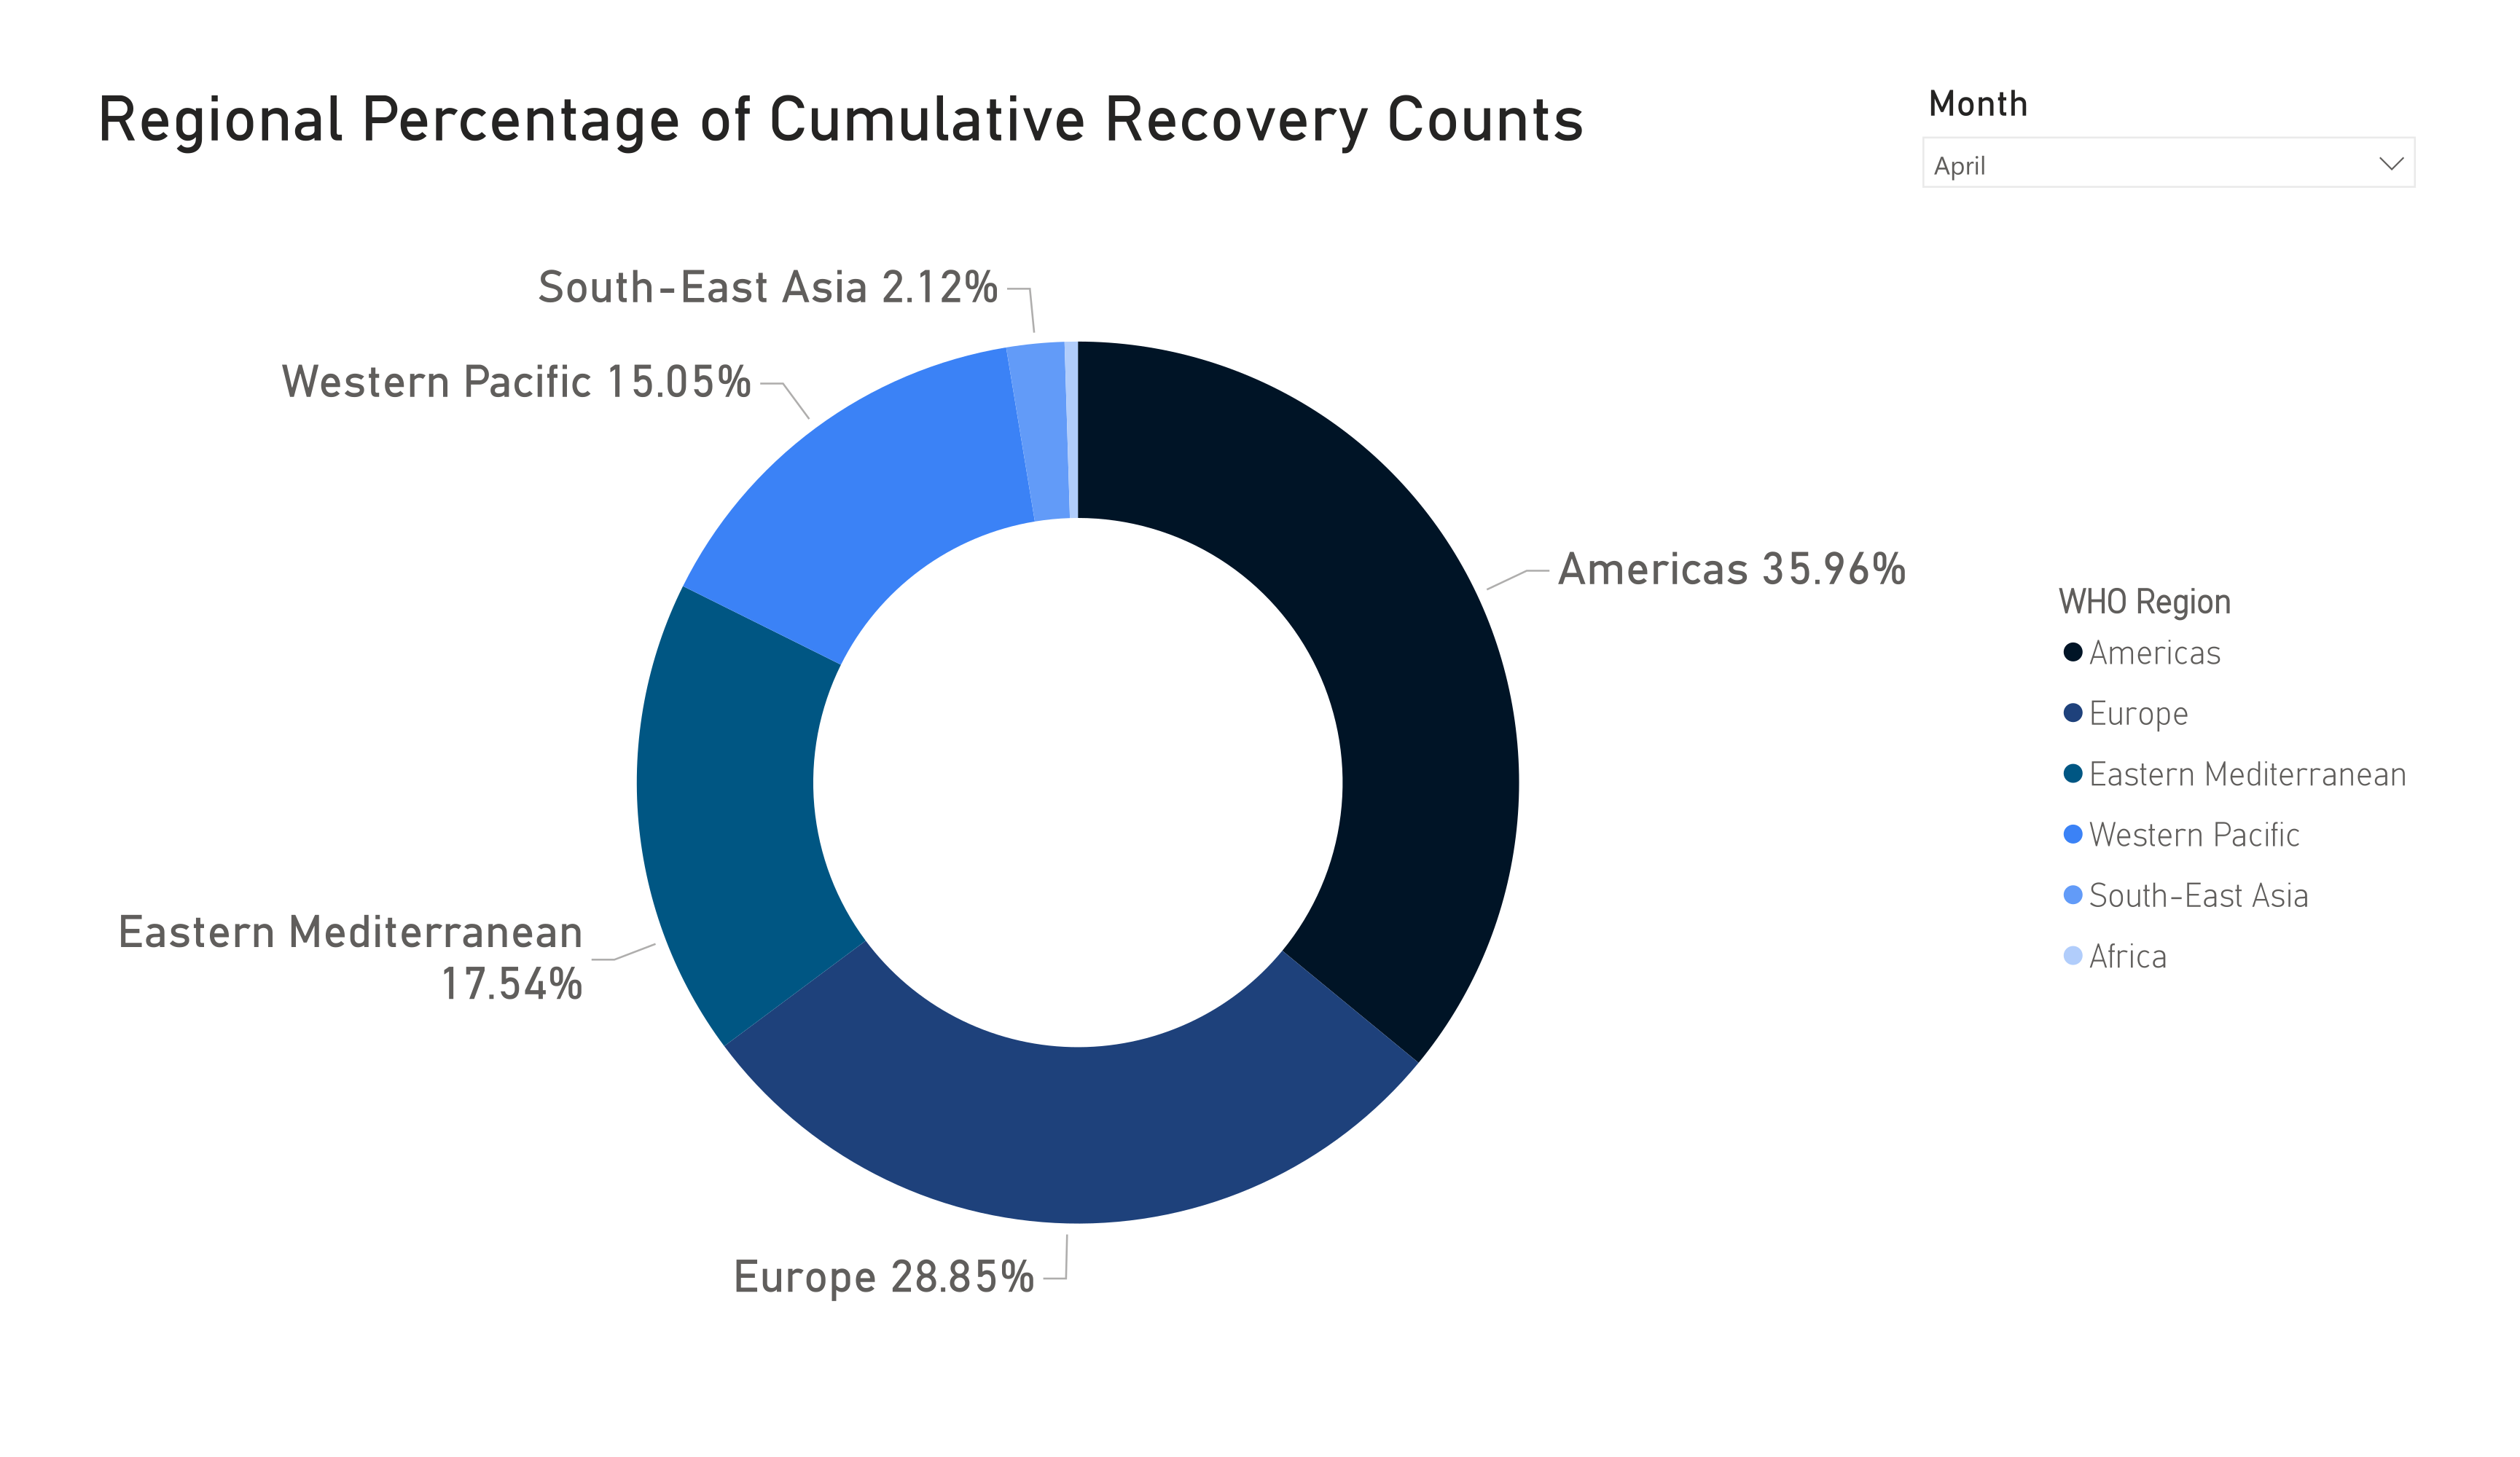
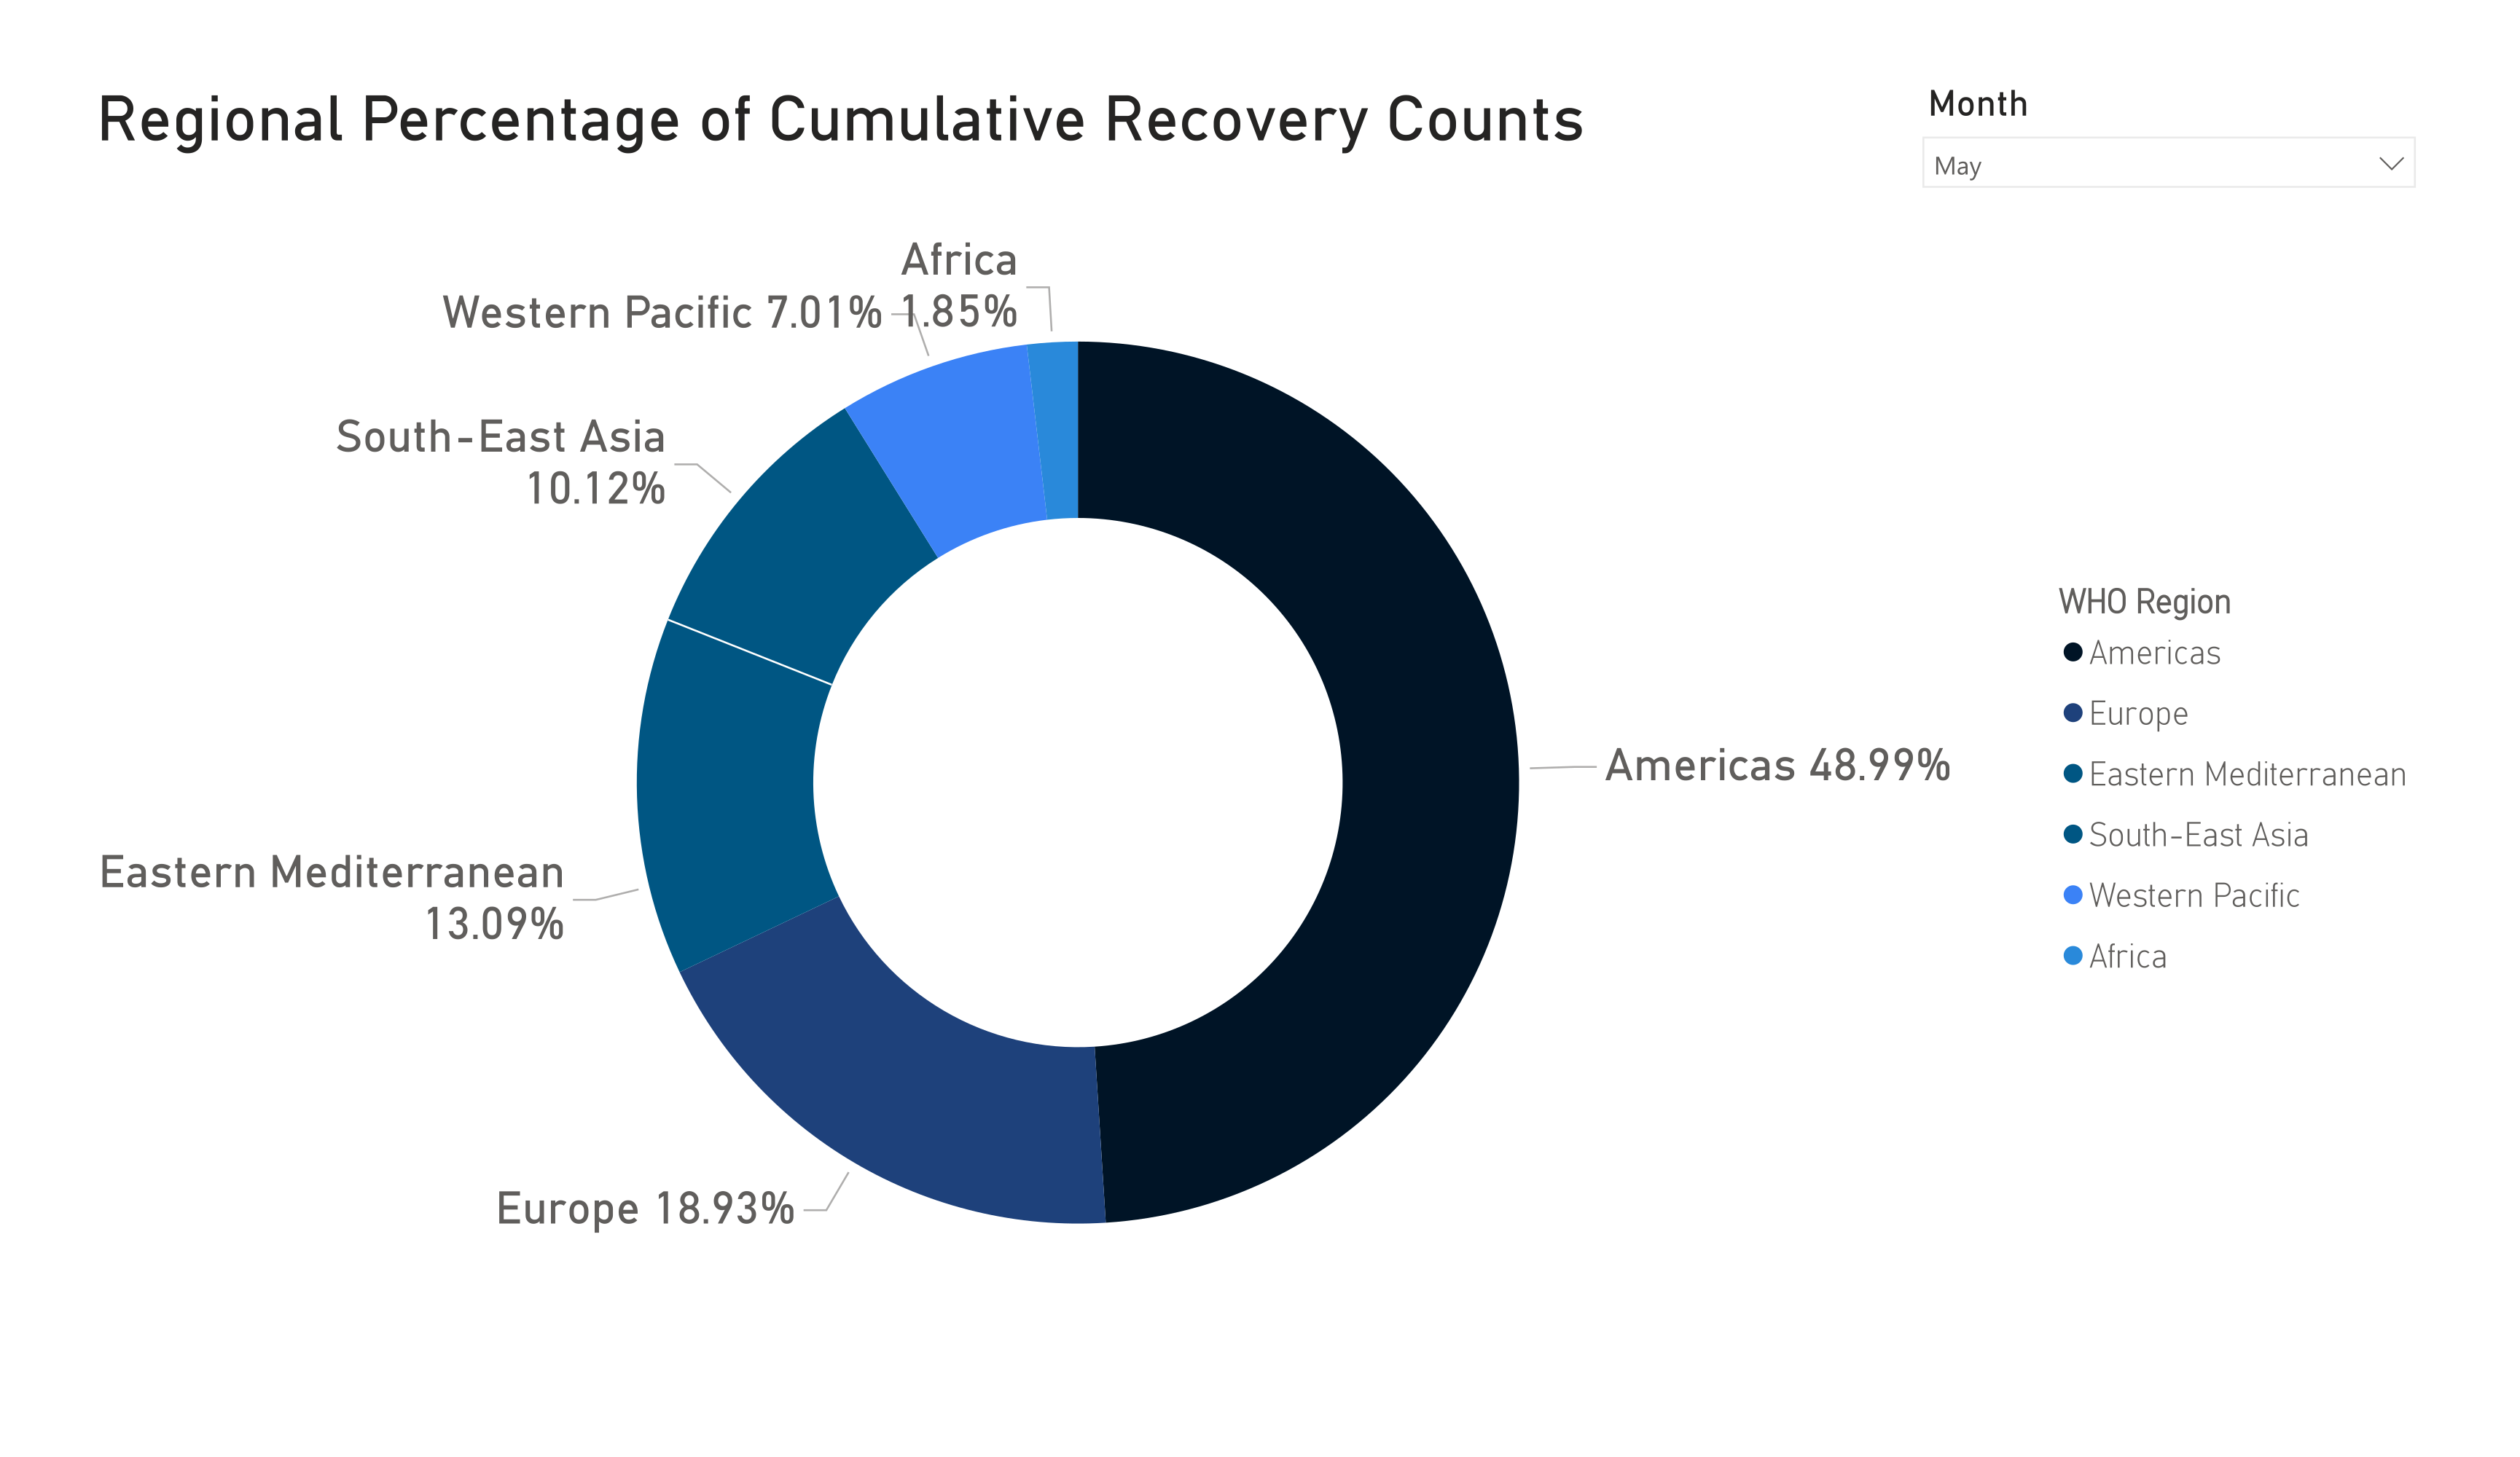
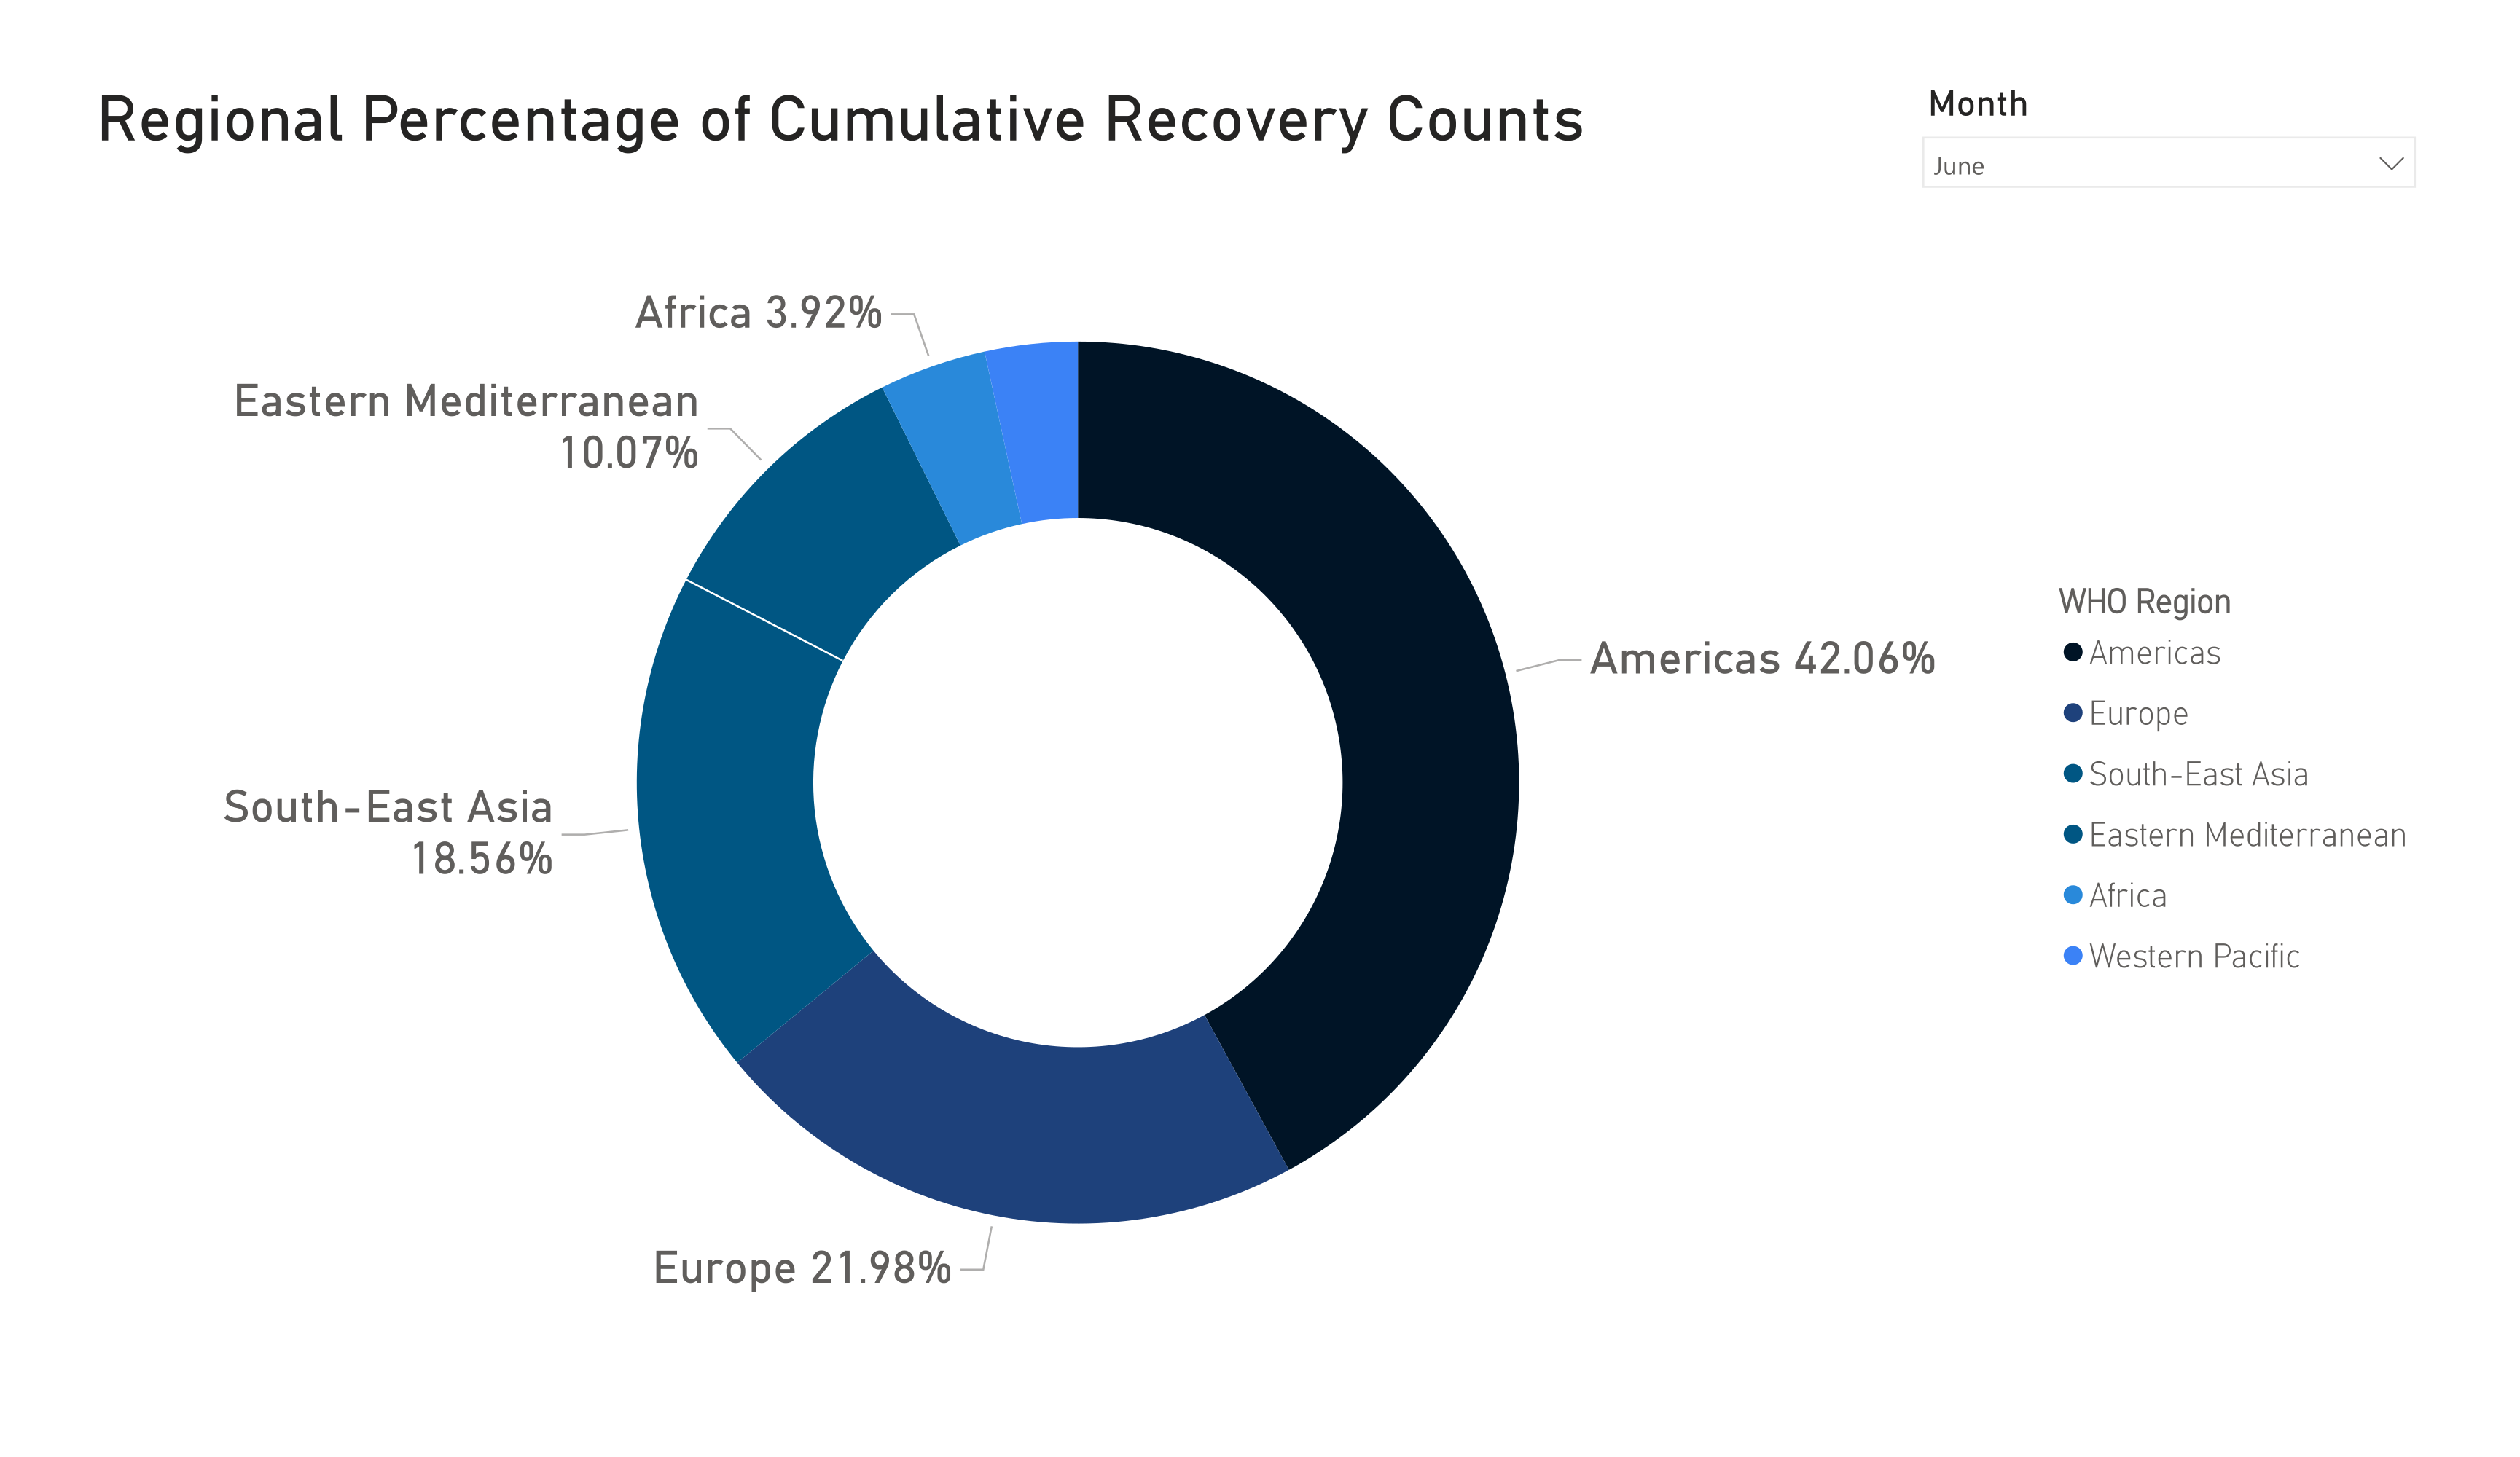
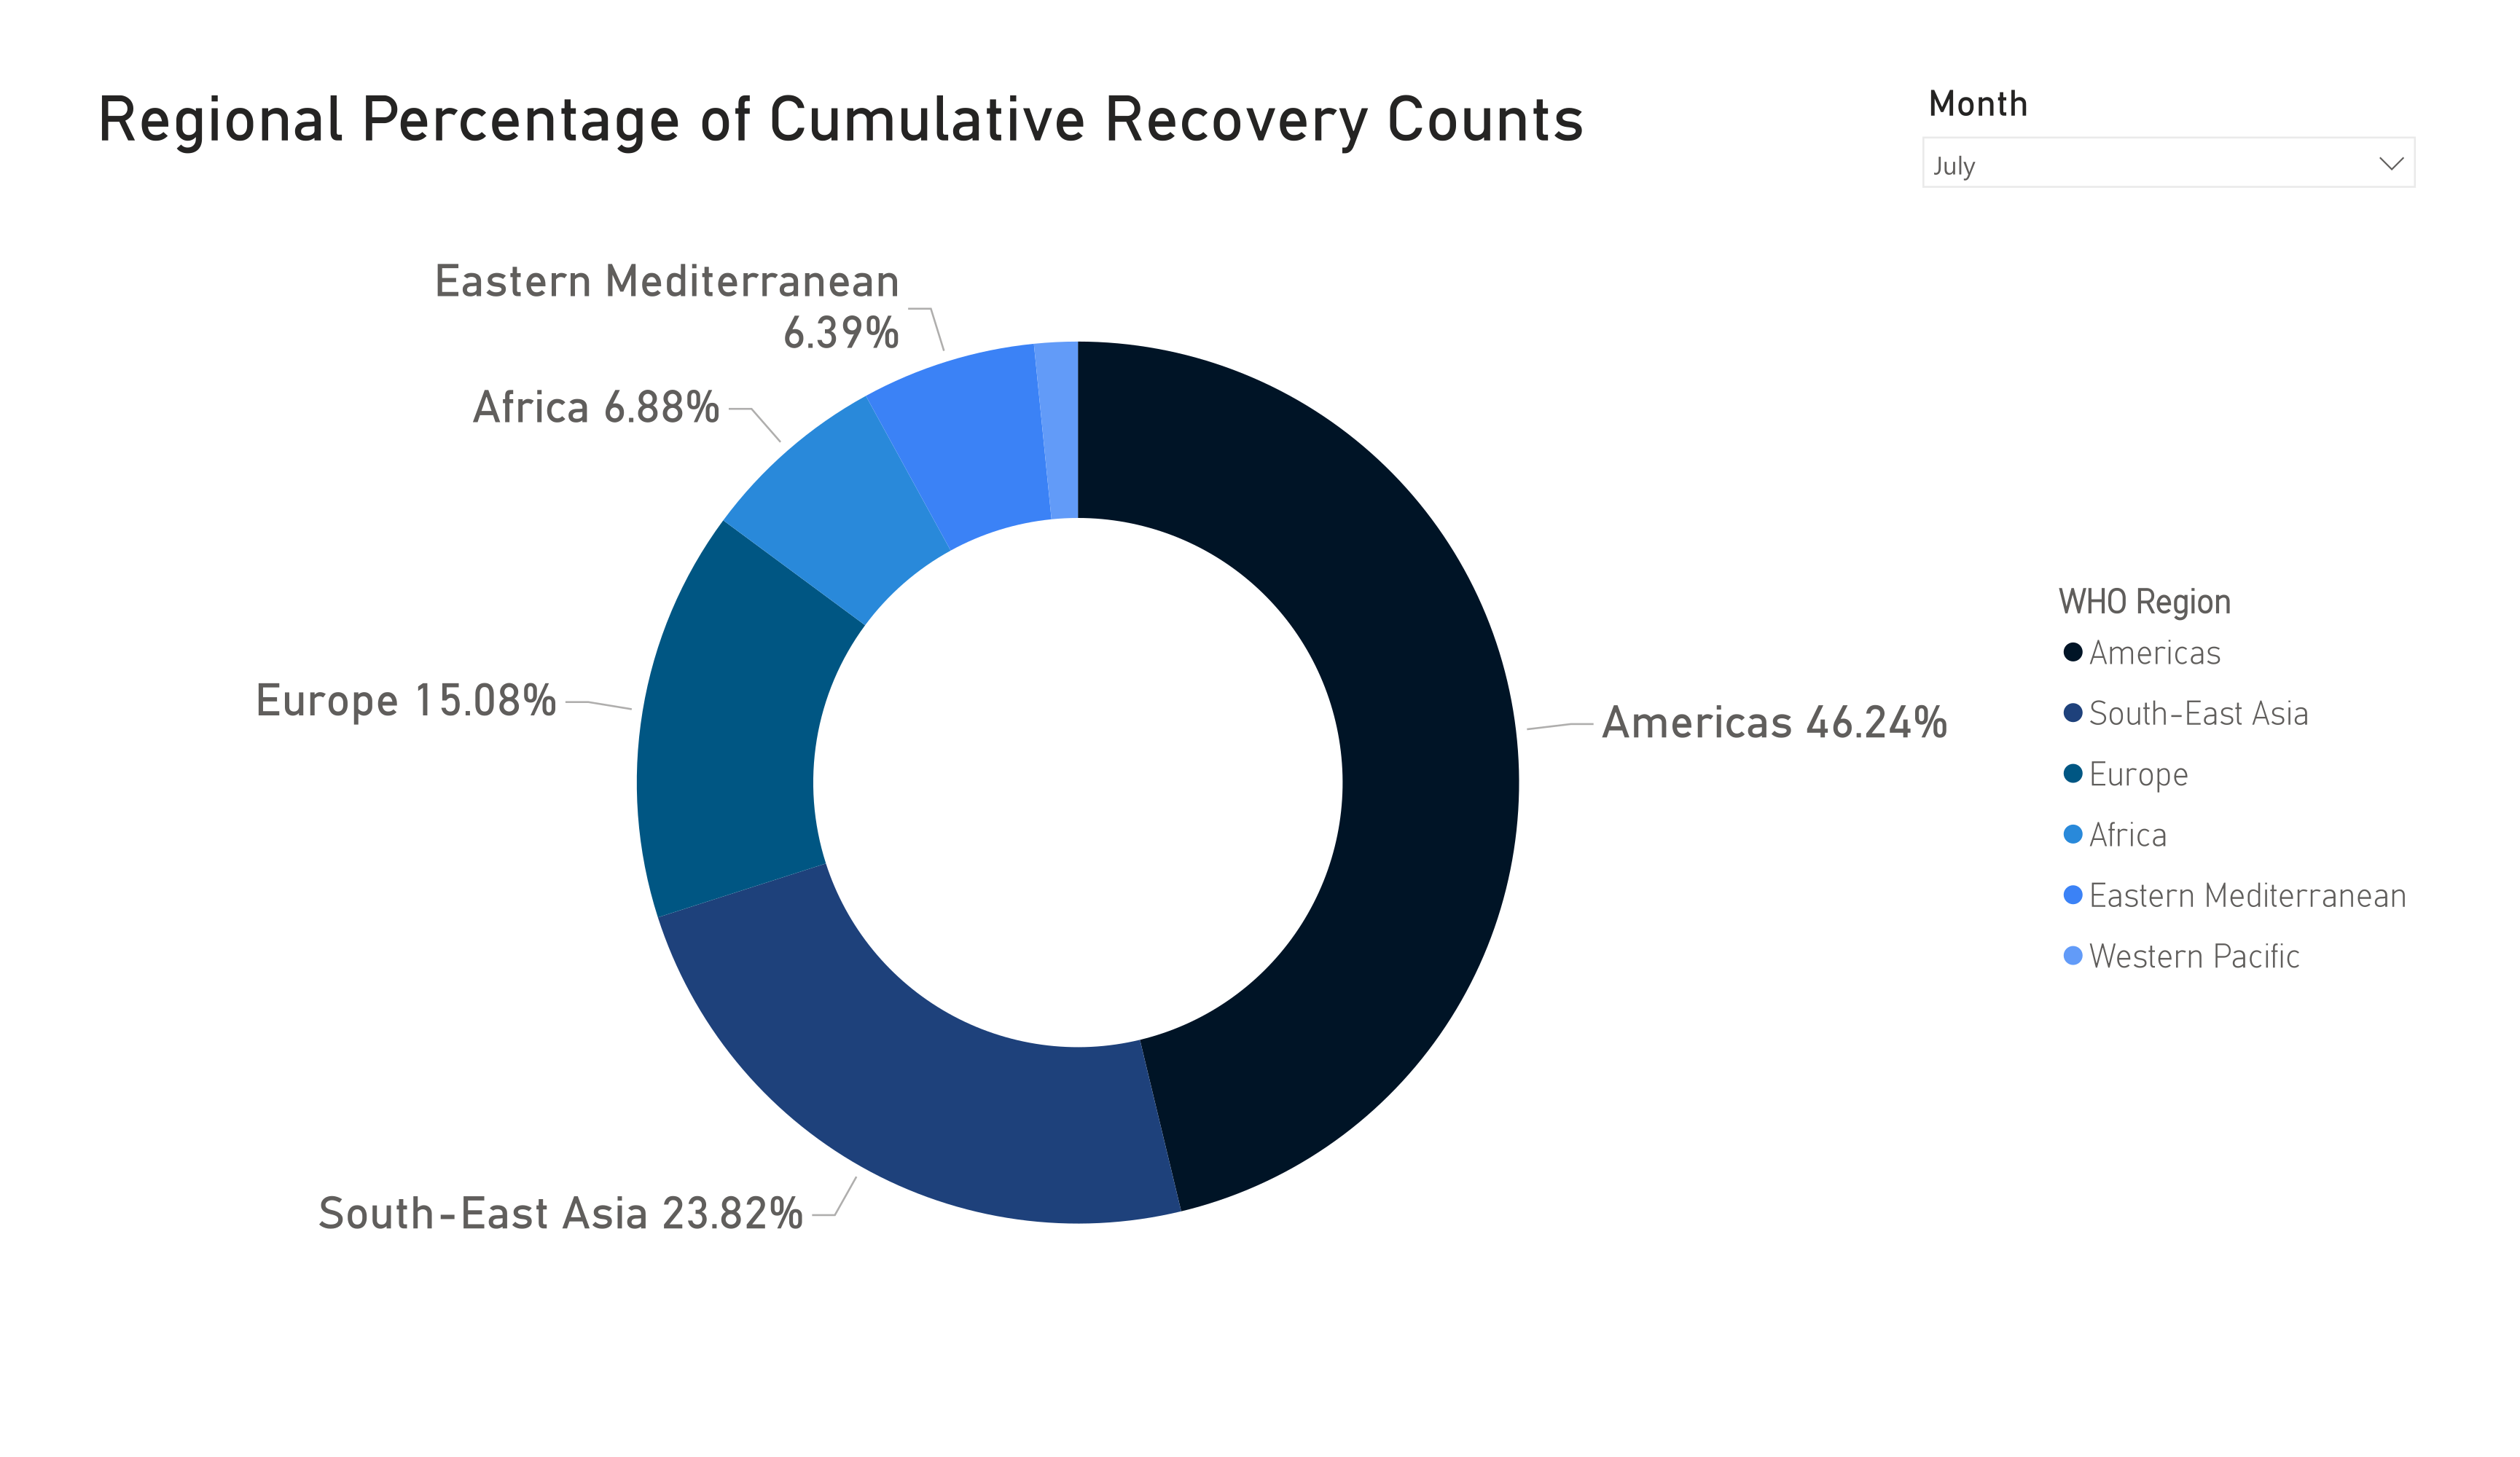
Lorem ipsum dolor sit amet, consectetur adipiscing elit, sed do eiusmod tempor incididunt ut labore et dolore magna aliqua. Ut enim ad minim veniam, quis nostrud exercitation ullamco laboris nisi ut aliquip ex ea commodo consequat. Duis aute irure dolor in reprehenderit in voluptate velit esse cillum dolore eu fugiat nulla pariatur. Excepteur sint occaecat cupidatat non proident, sunt in culpa qui officia deserunt mollit anim id est laborum.
Other Results
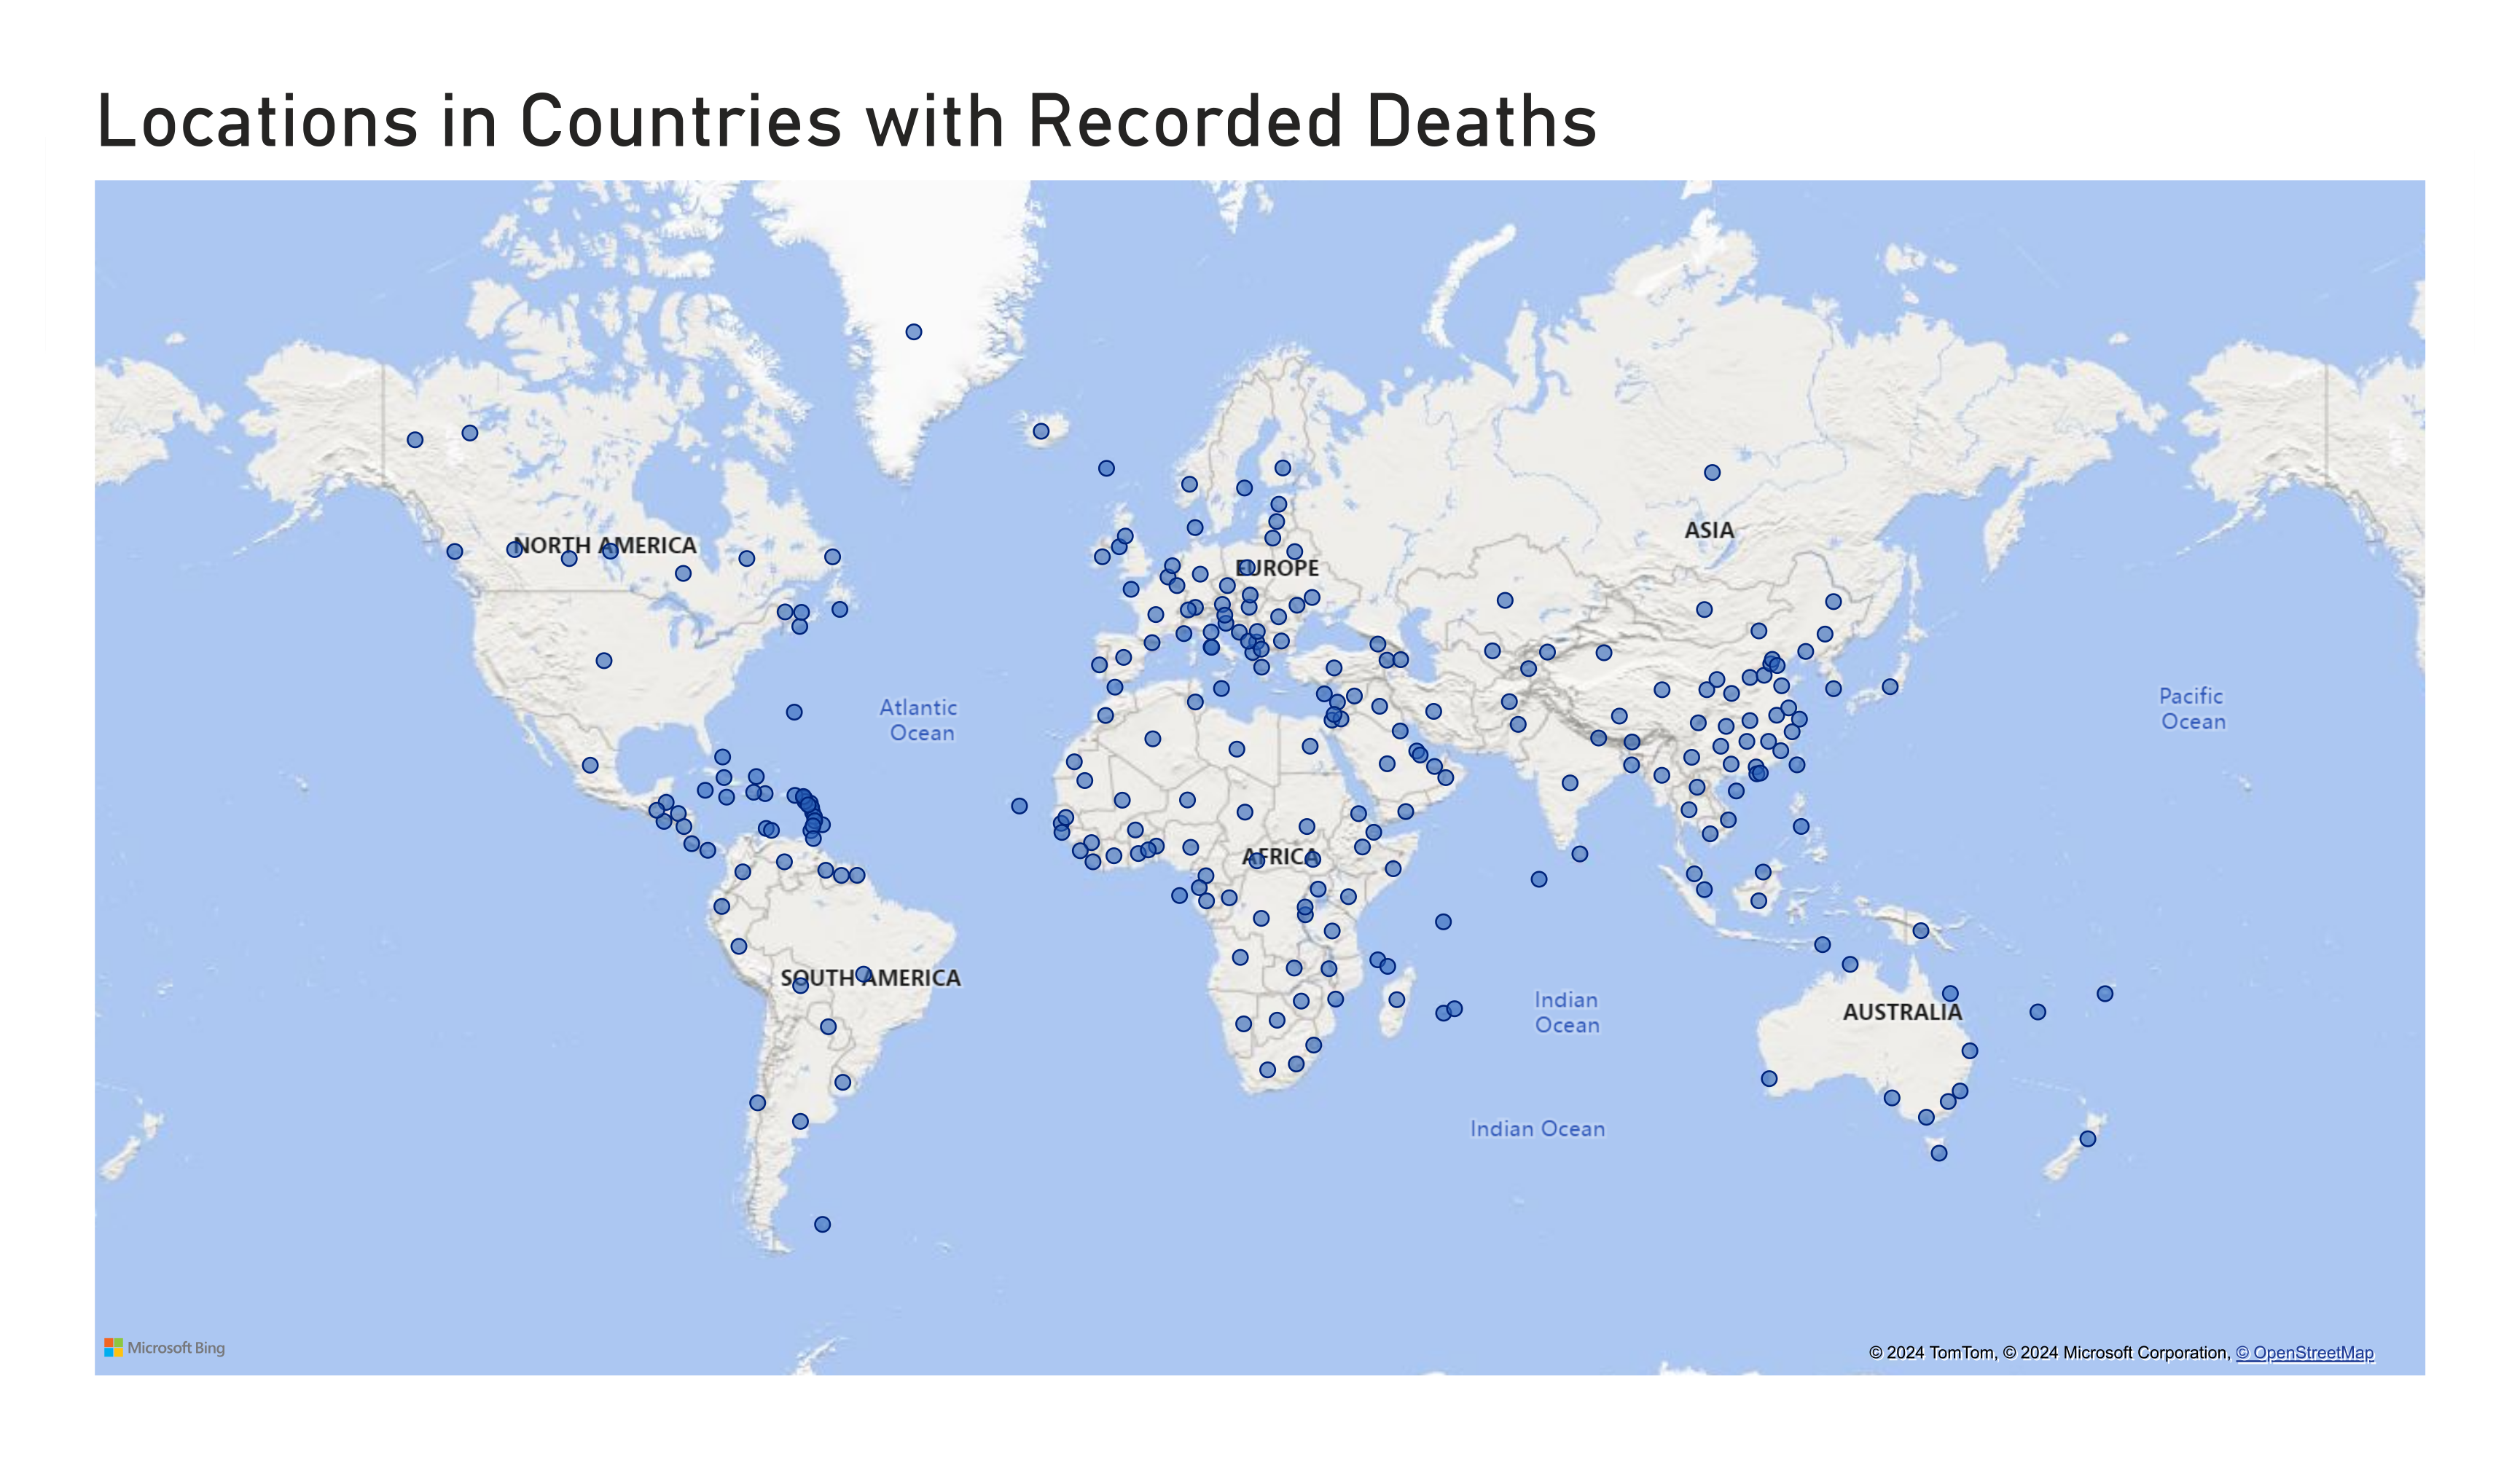
Geographical locations in countries with recorded deaths