Grafana InfluxDB and Telegraf
Last updated on Jun 23 2019 - using latest Ubuntu 16.04 LTS and dependent software.
Here is quick setup - I was just curious what it is all about.
I started reading very nice guide Using Telegraf, InfluxDB and Grafana to Monitor Network Statistics but soon tailored it to my needs (no need for SNMP/network statistics - just to see how these things work).
Quick overview of components:
- InfluxDB is time-series database
- Telegraf stores system data (CPU usage, disk usage...) into InfluxDB
- Grafana is web UI to visualize data from InfluxDB
Tested operating system:
-
Ubuntu 16.04.6 LTS xenial,20190617,amd64running on AWS, AMI-ID:ami-06e5b20beb4497111using my Run Ubuntu on AWS m1.small as spot instance guide
- update OS:
sudo apt-get update -y
sudo apt-get upgrade -yTested version:
||/ Name           Version      Architecture Description
+++-==============-============-============-=================================
ii  influxdb       1.7.6-1      amd64        Distributed time-series database.
To install InfluxDB OSS v1.7 we will use instructions from Installing InfluxDB OSS:
curl -sL https://repos.influxdata.com/influxdb.key | sudo apt-key add -
source /etc/lsb-release
# btw, we can't use just redirect '>' instead of 'tee' because it will be evaluated BEFORE sudo...
echo "deb https://repos.influxdata.com/${DISTRIB_ID,,} ${DISTRIB_CODENAME} stable" | \
     sudo tee /etc/apt/sources.list.d/influxdb.list
# should produce line like:
#    deb https://repos.influxdata.com/ubuntu xenial stable
sudo apt-get update -y && sudo apt-get install -y influxdb
sudo systemctl start influxdb
Try this command to verify that InfluxDB OSS is really running:
curl -I http://localhost:8086/ping

HTTP/1.1 204 No Content
Content-Type: application/json
Request-Id: 0a001b35-958c-11e9-8001-22000a8e479f
X-Influxdb-Build: OSS
X-Influxdb-Version: 1.7.6
X-Request-Id: 0a001b35-958c-11e9-8001-22000a8e479f
Date: Sun, 23 Jun 2019 07:53:50 GMTTested version:
||/ Name           Version      Architecture Description
+++-==============-============-============-=================================
ii  telegraf       1.11.0-1     amd64        Plugin-driven server agent for re
The install is much simpler because it uses same repository:
sudo apt-get install -y telegraf
sudo systemctl stop telegraf
WARNING! Ensure that Telegraf is stopped as soon as possible (using above commands) - otherwise there will be missing metrics in target
InfluxDB.
Uncomment few additional metrics to be collected for our Telegraf system overview Dashboard.
Edit file /etc/telegraf/telegraf.conf and uncomment:
[[inputs.net]]
interfaces = ["eth0"]

[[inputs.netstat]]

[[inputs.interrupts]]

[[inputs.linux_sysctl_fs]]

[[inputs.nstat]]
When finished we can start Telegraf:
sudo systemctl start telegrafAfter start wait at least 10s (which is sample interval) and then
verify that Telegraf is putting data to InfluxDB database named telegraf - use this command:
influx

Connected to http://localhost:8086 version 1.7.6
InfluxDB shell version: 1.7.6
Enter an InfluxQL query

> show databases

name: databases
name
----
_internal
telegraf

> quit
There should be telegraf database listed.
Also you may try this command to see latest data:
influx -database telegraf -precision rfc3339

Connected to http://localhost:8086 version 1.7.6
InfluxDB shell version: 1.7.6
Enter an InfluxQL query

> show measurements

name: measurements
name
----
cpu
disk
diskio
interrupts
kernel
linux_sysctl_fs
mem
net
netstat
nstat
processes
soft_interrupts
swap
system

> select * from system order by time desc limit 1

name: system
time                 host       load1 load15 load5 n_cpus n_users uptime uptime_format
----                 ----       ----- ------ ----- ------ ------- ------ -------------
2019-06-23T08:12:10Z ip-X-X-X-X 0.01  0.08   0.02  1      1       1863    0:31

> quit
Tested version:
|/ Name                  Version         Architecture    Description
+++-=====================-===============-===============-===============================================
ii  grafana               6.2.4           amd64           Grafana
WARNING!
Grafana repository recently moved from
packagecloud.iotopackages.grafana.comas noted in https://grafana.com/blog/2019/01/05/movin g-to-packages.grafana.com/
We will use setup instructions from Installing Grafana Debian/Ubuntu:
sudo add-apt-repository "deb https://packages.grafana.com/oss/deb stable main"NOTE: Please do not overlook that Debian packages are used even for Ubuntu Xenial (there are no specific Ubuntu packages)
And then:
# must produce "OK" at then end of output
curl https://packages.grafana.com/gpg.key | sudo apt-key add -
sudo apt-get update -y && sudo apt-get install -y grafana
Enable and start Grafana as hinted by notes from install:
sudo systemctl daemon-reload
sudo systemctl enable grafana-server
sudo systemctl start grafana-server
WARNING!
We use plain insecure (not-encrypted)
httpconnection on port3000. Such setup may be used for temporary testing purpose only.It is strongly recommended to use frontend
ApacheorNginxfor https support.
Now we need to login to Grafana and import dashboard for Telegraf using:
-
open your Grafana page at
http://YOUR_SERVER_IP:3000NOTE: If you are using AWS, ensure that your AWS Security Group allows access to tcp port 3000 (Grafana Web UI)
-
login using default login/password:
admin/admin -
you will be asked to change this password
-
Define data source to our InfluxDB:
- click on Configuration -> Data Sources
- click on Add data source and fill in at least:
- Name:
telegraf - Type:
InfluxDB - URL:
http://localhost:8086(Warning! The url must be written in white color - greyed is just placeholder!) - keep Access:
Server (Default) - Database:
telegraf
- Name:
- click on Save & Test
- you should see notice Data Source is Working
-
Now import Dashboard for Telegraf:
- click on + -> Dashboard Import
- enter
914to Grafana.com Dashboard field - be sure to select
telegrafdatabase in InfluxDB Telegraf field - click on Import
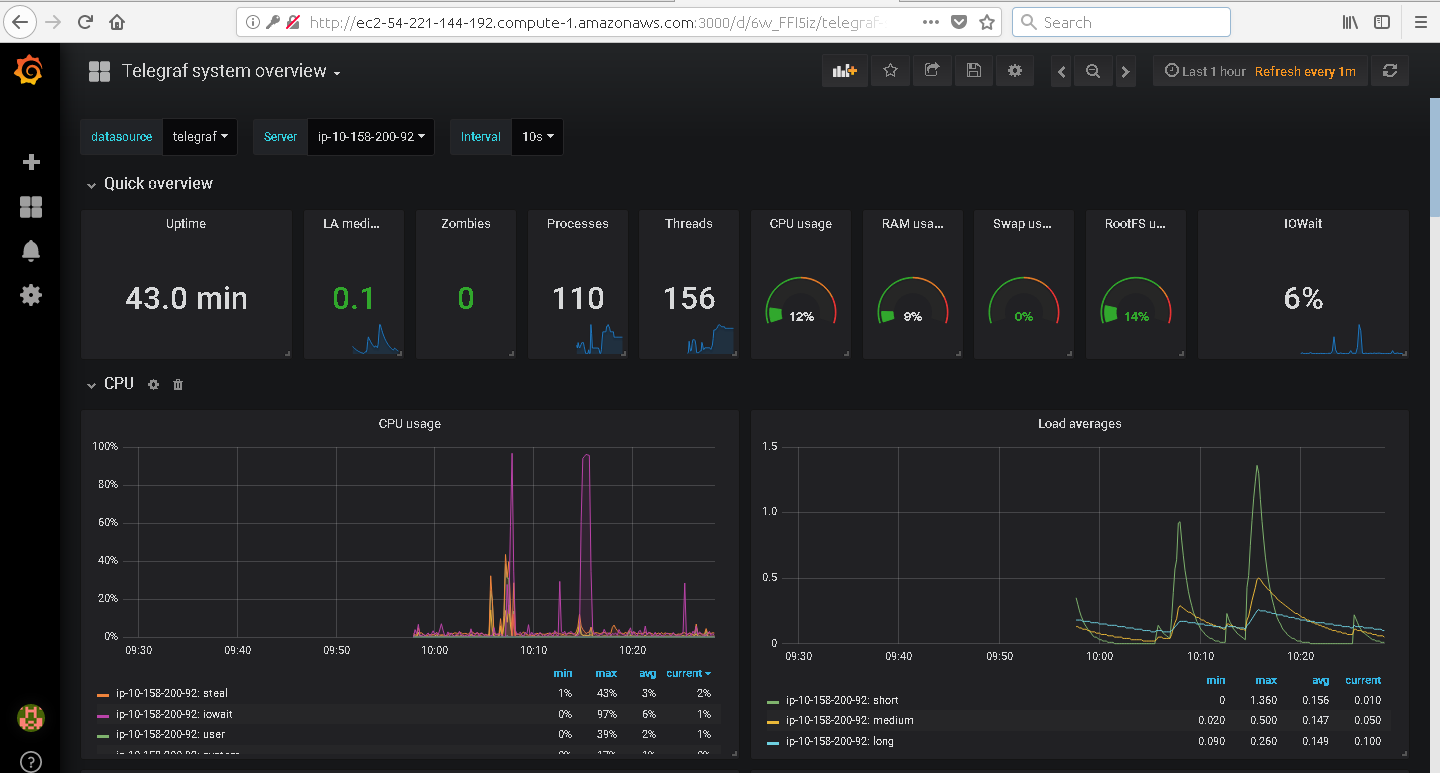
Now you should see picture like this bellow:
Let's look into influxDB what disk names are collected:
influx -database telegraf -precision rfc3339

> show tag values from diskio with key="name"

name: diskio
key  value
---  -----
name loop0
name loop1
name xvda1
name xvda2
name xvda3

> quit
Now go to your Grafana Dashboard and:
-
click on title of graph
Disk I/O requests -
click on
Edit... -
in query
SELECT non_negative_derivative(mean(reads),1s) as "read" FROM "diskio" WHERE "host" =~ /$server$/ AND "name" =~ /(v|s)d[a-z]$/ AND $timeFilter GROUP BY time($interval), * -
replace expression on
name(obvious problem - Ubuntu/AWS numbers disks like partitions and also there is additionalxbefore disk name):AND "name" =~ /xvda[0-9]$/ -
click on chart - it should immediately update with data (no longer
missing data) -
now press
Save(floppy disk icon at the top of page) -
confirm
Save -
and then click on Left arrow
<-at the left top of page to return to dashboard.
Same solution could be used for these graphs:
Disk I/O bytesDisk I/O time
Copyright © Henryk Paluch. All rights reserved.
