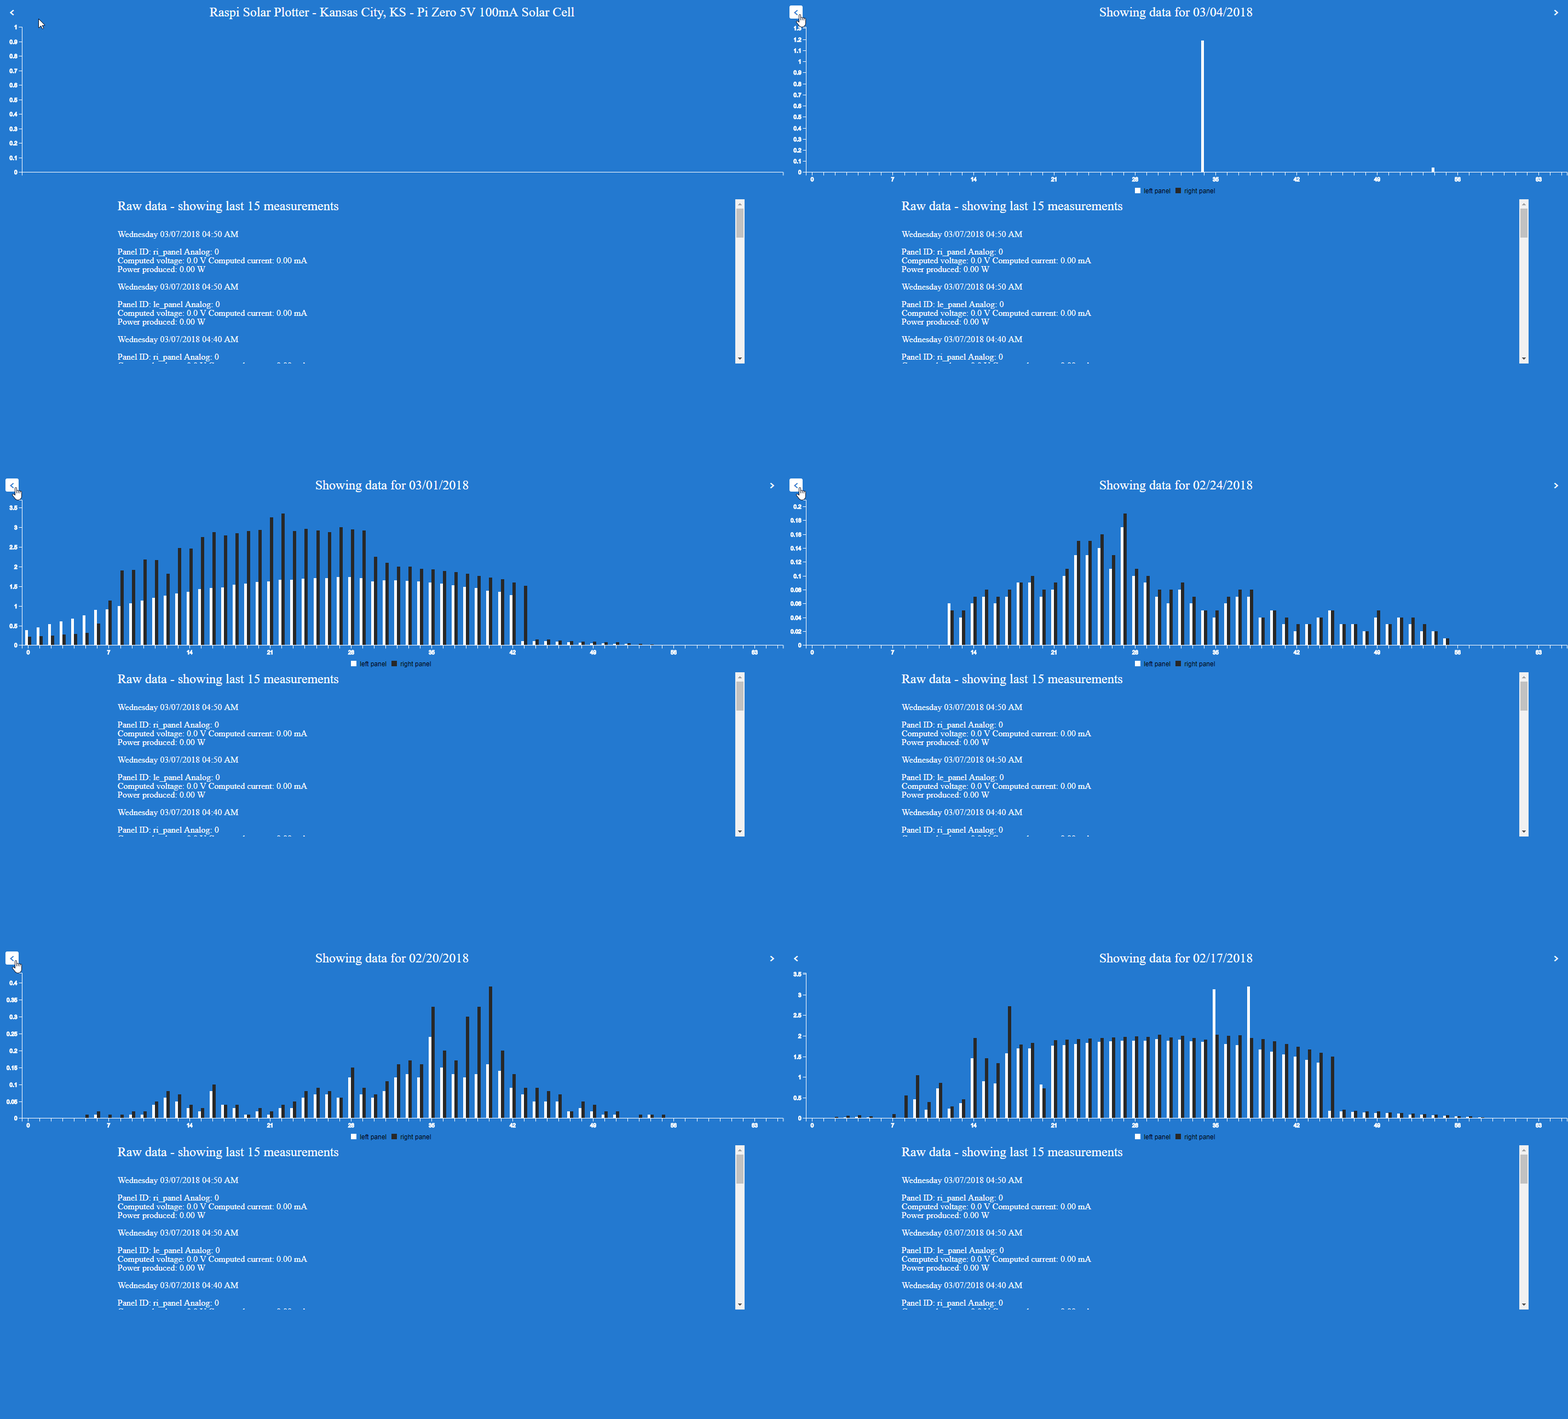
A basic raspberry pi solar plotter uploader and display on a remote server
This website shows the last 15 measurements from both of the 100mA 5V solar cells taped to my apartment window and also the day's current plot between 8AM and 7PM
- remote/client (front end with chart/database) - LAMP stack
- chart is using c3.js
- PhantomJs for taking screenshots
- local (Raspberry Pi) Python and code to interface with ADC (I used a tutorial by Adafruit)
You will need:
- Raspberry Pi
- Solar Cell(s)
- Load - Resistors
- ADC - I used an MCP3008
- Breadboard and wires
I'm using C3.js no particular reason, was just looking for something quick/easy to setup. I did modify it to have a "slider" if you can call it that. So you can load previous charts. It seems to me to be more efficient to re-render old data points than loading old screenshots.
This isn't technically an API, I can write a POST endpoint now to receive the data coupled with some secret key but this was a thing I made just under 5 months ago from the time I created this public repo.
The way the data is sent from Python to the remote server is with a GET request with parameters being passed in (the keys and data such as date, voltage per panel, etc...
This was the first attempt, before I decided to use the dual panel setup
The dual panel version has two copies of data, one from each panel.
Initially I started with a single panel but decided to use two of them to compare/get data points from the left side of my window vs. the right side of my window relative to the path of the sun's arc as it moves across the sky. I don't know what I ever did with that data (which days it was) as currently (for a long time) both panels are positioned next to each other as shown in the photo.
There is a config component as well that depends on your preference eg. if you decide to use a 3.3V reference or 5V reference which will change your multiplier constant (voltage reference/steps) eg. 3.3V/1024 or 5V/1024.
I am writing a basic api where you can pull all of the data in a JSON dump with some parameters to limit by month/range. These are the endpoints/parameters to pass in
http://raspisolarplotter.com/dual_get_data.php?spec_date=mm/dd/yyyy
Note that the 0's are necessary ex:
http://raspisolarplotter.com/dual_get_data.php?spec_date=03/01/2018
You will need to get a copy of c3.js and put it in the /remote-client/ folder. There should be three files:
- c3.css
- c3.min.js
- d3.min.js
The rest is my code/current setup. It's up to you to use whatever. This is not ideal I would say regarding safely sending data from your Pi to the remote server. Specifically it's the remote server that is not that secure, though I used super-long hard to guess keys and more than one. Also PHP-PDO regarding sql-injection.
The main driver is CRON, it runs every 10 minutes in my current setup:
*/10 * * * * /usr/bin/python ~/raspisolarplotter/dual-panel/dual_solarplot.py
The PhantomJS is triggered by the Pi as well with a get request at 10PM every night
00 22 * * * /usr/bin/python ~/raspisolarplotter/screenshot.py
I didn't cover the PhantomJS install, it's been a long time since I did it.
