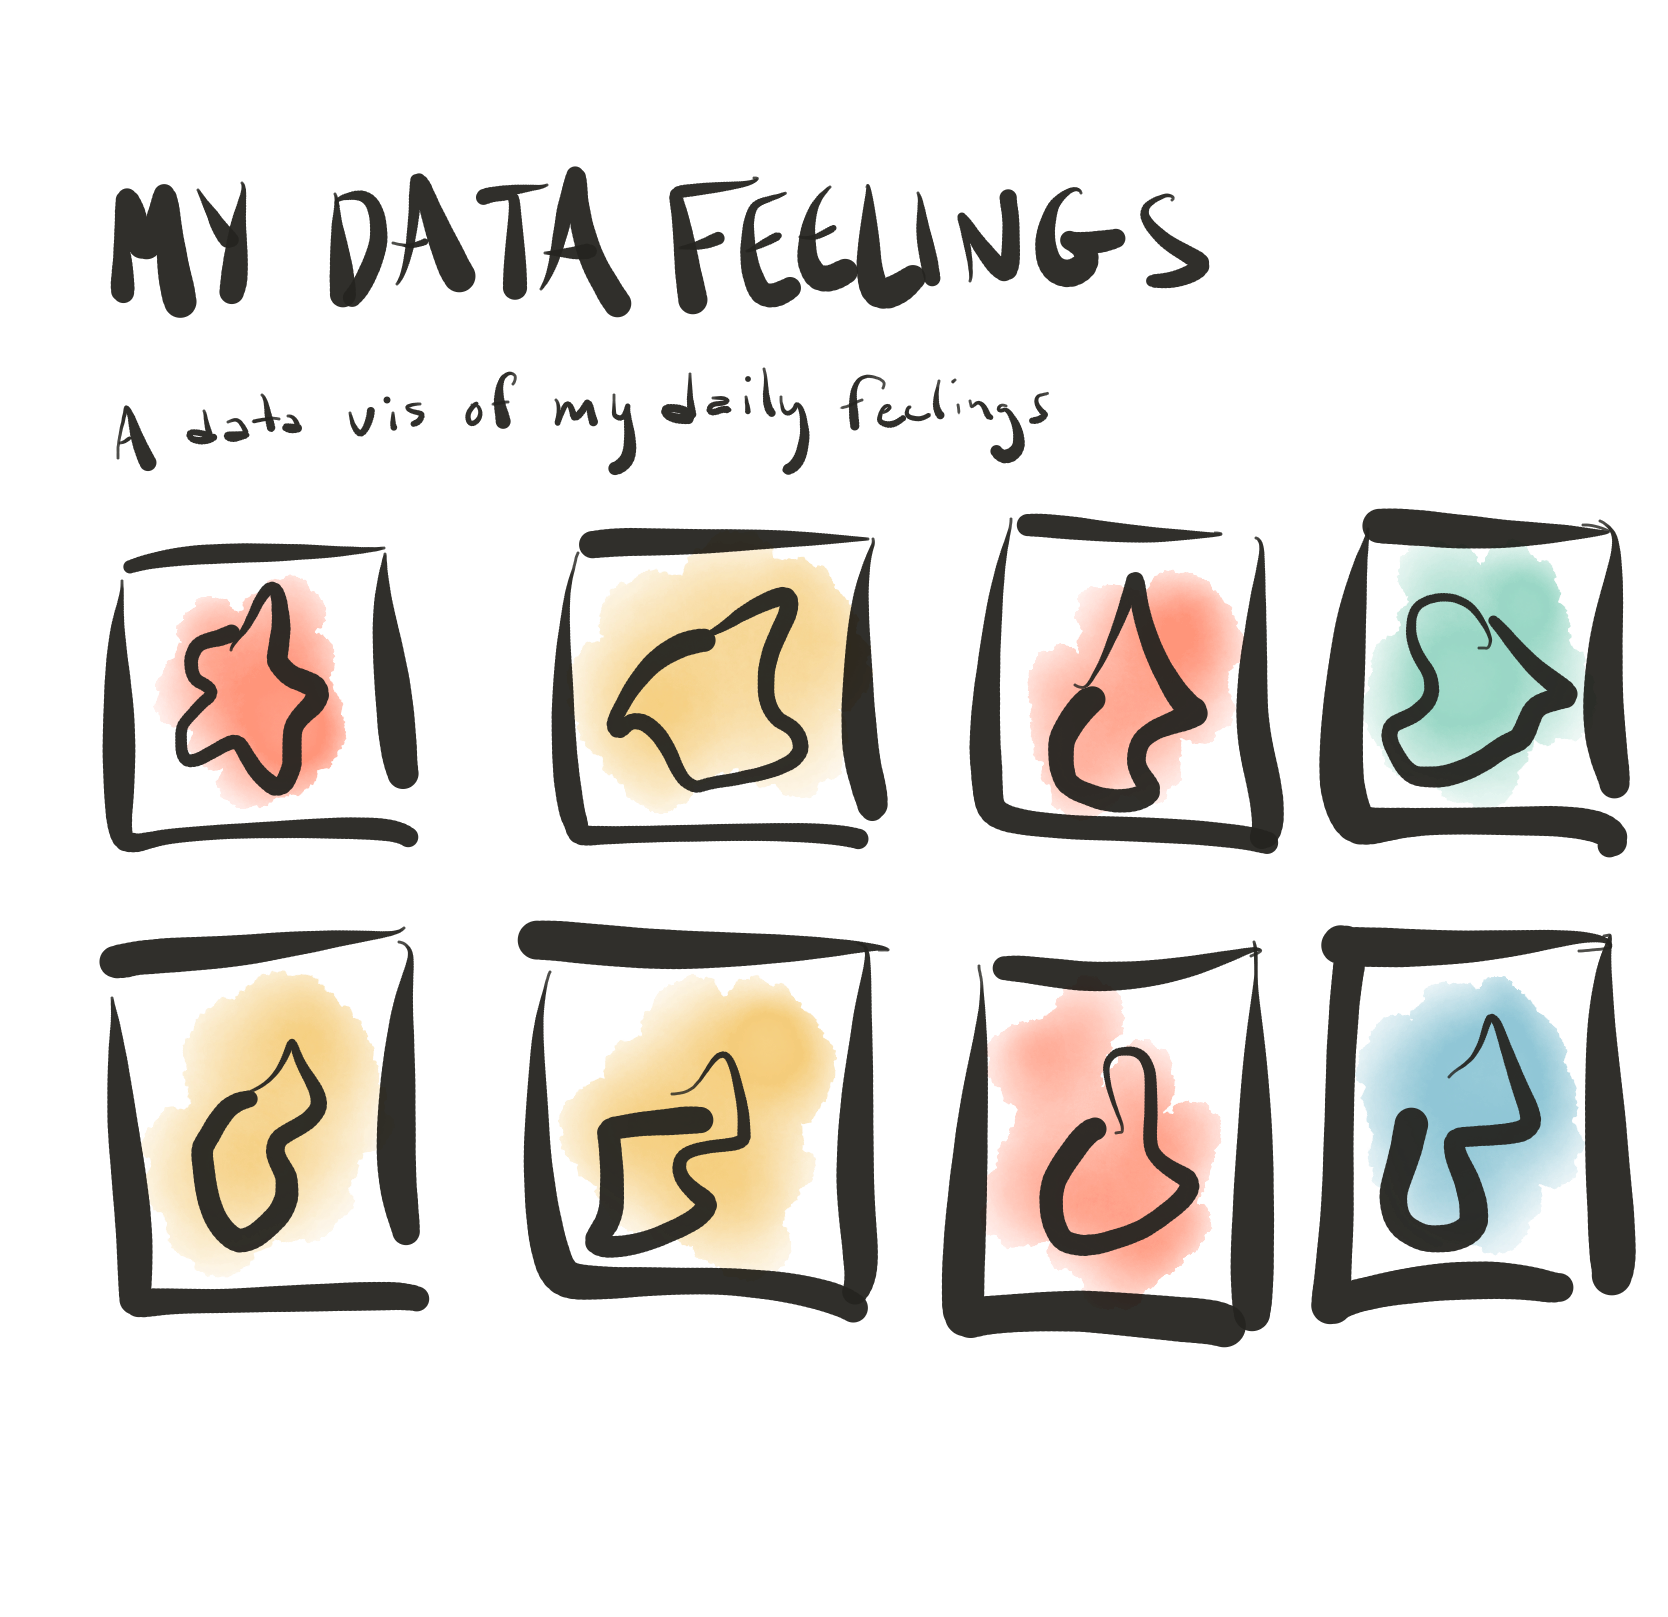
This week in Quant Humanists we will be thinking about the role of visualization and representation as a way to learn about yourself. In a 2013 Pew Research Center Internet & American Life Project Survey, it was found that 69 % of Americans keep track of health data for themselves or another person, of this 47% do this tracking “in their heads,” 33% on pen and paper, and 20% via a digital surrogate or technology. We look at various methods for getting to know yourself through your data such as through hand drawn visualizations, digital/interactive charts and maps, and alternative expressions of data.
We dedicate a majority of this class to work through building our own custom data collection and visualization web application. We will work through and discuss together the conceptual and technical details of implementing this application.
- SLIDES: https://docs.google.com/presentation/d/1WIVHnsbNIn7D-hR3yRrAPdbF1gi4oA4D97WQmt42ntI/edit?usp=sharing
- Attendance
- Assignment reviews
- paired feedback
- Discussion
- Project Highlight
- Assignment #3 Overview
- Web Applications and APIs
- Web Frameworks
- Assignmeent #3 up and running
- Tutorial Overview:
- Your first full-stack ✨ web application using Feathers.js and P5.js
- Assignment #3
- Neff, Gina., Nafus, Dawn., Self-Tracking, Chapter 3: Making Sense of Data, MIT Essential Knowledge Series. Print Copies available through NYU Library or PDFs though the IEEE Explore Library.
- Weiderkehr, Anna., Fine
- Weiderkehr, Anna., Fine, exhibition app
- The Psychology of Shapes - Knock Design into Shape. Psychology of Shapes, The Meaning of Shapes and How to Use Them Creatively in Your Designs
- NY Times, Your Apps Know Where You Were Last Night, and They’re Not Keeping It Secret
- Avirgan, Jody., Dear Data + FiveThirtyEight want you to visualize your podcast habits
- Anonymous., originally in WIRED, The nerdy charm of artisanal, hand drawn infographics
- Fry, Ben., Visualizing Data
- Sniderman, Zachary., Manhattan of the Mind
- Farris, Jessica., The hand-drawn infographics of W.E.B. Dubois
- Evans, Kristen., Bullet Journaling as an analog journaling alternative, from Pinterest, strategies for journaling and data keeping
- Newton, Mark., GutenTag Stamp for organizing your day radially
- Thorp, Jer., Blog, On Data and Performance, Jer Thorp
- Frick, Laurie., Frickbits, turn your data into art
- Frick, Laurie., Visual Language for Self Tracking
- Lupi, Georgia., Data Humanism
- Lupi, Georgia., Bruises
- Vigen, Tyler., Spurious Correlations
- Meyer, Sebastian and Glinka, Katrin., Talk, Psychogeography in the age of the quantified self
- Phototrails - global instagram visual city signatures
- Von Bismark, Julius., Topshot helmet
- Hildebrandt, Lennart, and Otten, Heike., Shifted Maps, FH Potsdam | UCLab
- Huang, Shan., Iconic History - visualize your browser history in favicons
- OpenNews.org, Drawing Conclusions from Data
- Rost, Lisa., 6 years of google searches
You will have 2 weeks to do this assignment!
This week you will follow the workshop link below to create your own personal data collection and visualization platform.
You must do at least one of the following:
- change the data model or create a new collection: Change the data model by changing the properties in the data model
src/models/feelings.model.js. Alternatively you may create an entirely new database by doingfeathers generate serviceand developing another database in which to create your new data collection. - create your own visual encodings: with the current data structure or with your newly added database collection and data model, come up with intriguing and meaningful ways to visualize that data. You may use the existing structure of the "small multiples" which show each entry or change up that structure entirely. The key is that you make a GET request to your database and pull data dynamically.
NOTE: You do not need to deploy this application to the web if you do not want to, but you must document your work in a blog post. If you do want to deploy this application to the web - you should totally do it! Very much encouraged! See section: https://joeyklee.github.io/my-data-feelings/#/deploy
- Submission: Submit your Github Gist/blog post link as a
comment in its respective github issuein the quant-humanists-2019 repository. See NOTE below.
NOTE: Please structure your blog post submissions according to the assignment template here: Quant Humanist - assignment template
