This report represents preliminary analysis on certain trends in Houston parking tickets, in addition to an interactive map for use in exploring the localization of these tickets with respect to time.
The main dataset used in this analysis consists of 550,755 citations handed out in Houston, Texas over the course of the period from 7/1/12 to 3/31/15. It was sourced from the Houston Data Portal on 5/7/16.
A second round of analysis was performed using a new version of the data which included lat/long positional data for each ticket (this data spans the period from 7/1/14 to 3/31/16). Certain records are missing this information due to technical issues with the GPS in the ticketing devices. This data was downloaded on 5/17/16, again from the Houston Data Portal. In this subsequent analysis, the ggmap tool was used courtesy of D. Kahle and H. Wickham.
I ultimately realized that ggmaps was insufficient for displaying the density of tickets over time across the city, and turned to a more interactive approach. I hope that providing the user more interactivity with the map will allow them to spot patterns in areas that matter to them. This could be valuable for research purposes. To build my interactive map, I used leaflet.js, in combination with map data from OpenStreetMap. The PruneCluster plugin for leaflet was used to display density/clusters of tickets. In addition, I used noUISlider for the slider controls.
Additional datasets included in this analysis are as follows:
Most of the data was originally in the xlsx format; these files were converted to CSV using the LibreOffice command-line conversion tool:
libreoffice --headless --convert-to csv $filename
Without further ado, let's take a look at some analysis of the data!
It behooves us to begin with an examination of what the most common reasons are for folk in Houston to receive a ticket. The following chart shows the top 20 infractions, the most common of which are parking in a tow-away zone, and parking at an expired meter.
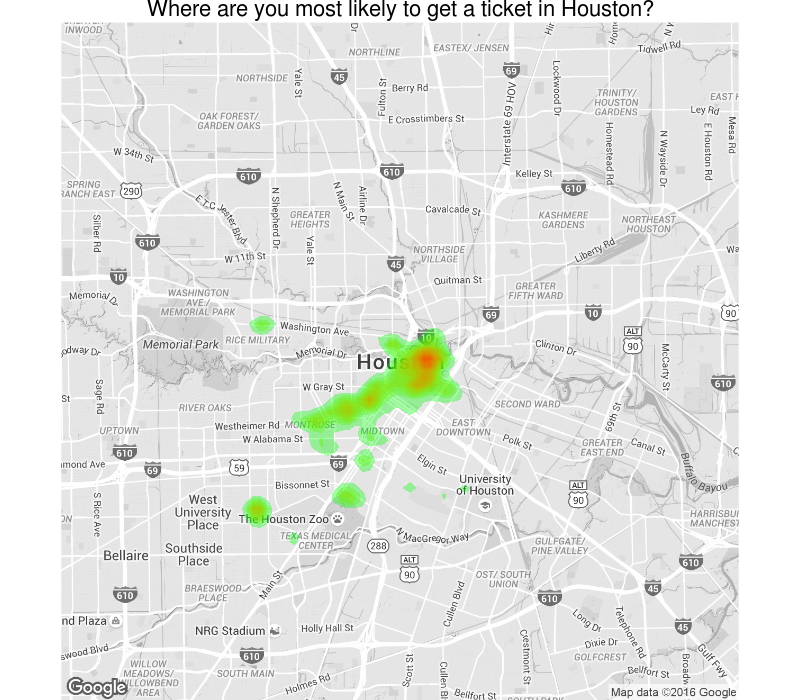
Using ggmap, and the positional information provided in the updated dataset, we can examine the locations where tickets were most frequently assigned. The below map has the density of parking tickets overlaid, with green representing few tickets, and red indicating a large number of tickets were assigned in the area. Those areas which are not highlighted are not ticketing hotspots, but may still have tickets recorded. This analysis indicates that there are several ticketing hotspots in Houston including the Downtown, Montrose, and Rice Village areas.
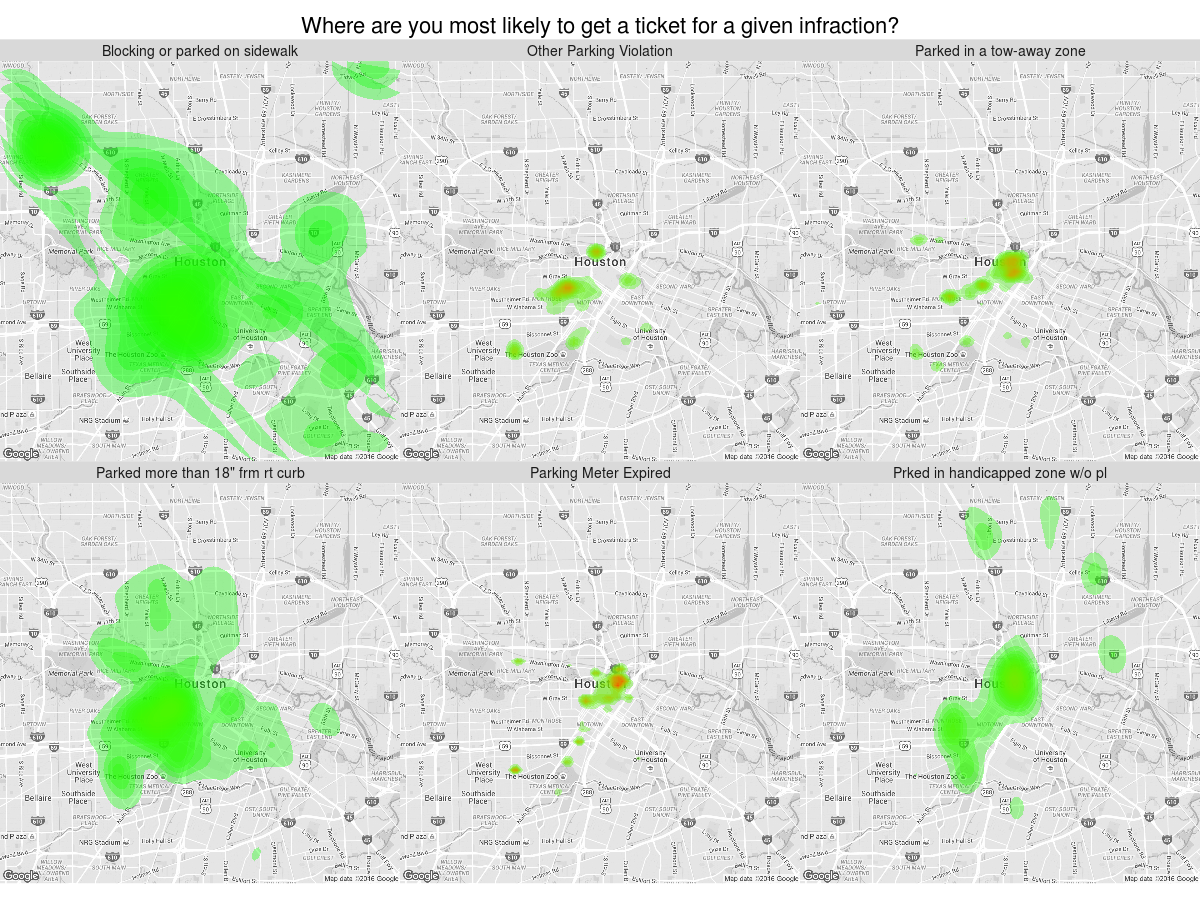
This second map illustrates the likeliest locations to receive a ticket for the 6 most common types of parking infraction. We see that certain infractions, like parking at an expired meter, or in a tow-away zone, were significantly more common in specific areas (like Downtown or Montrose). Conversely, several other infractions were spread more evenly across the city.
The below figure depicts the number of tickets assigned to cars manufactured in various years. We show that there is a steep increase in ticketing of cars manufactured after the 1990s, followed by a sharp decrease in the year 2008 (as highlighted by the red dotted line). I hypothesize that this decrease may be a result of the United States financial crisis, and resultant failure/bailout of the American automotive industry. Additionally, I propose that newer cars are likely to be less common on the roads, and therefore receive fewer overall tickets.
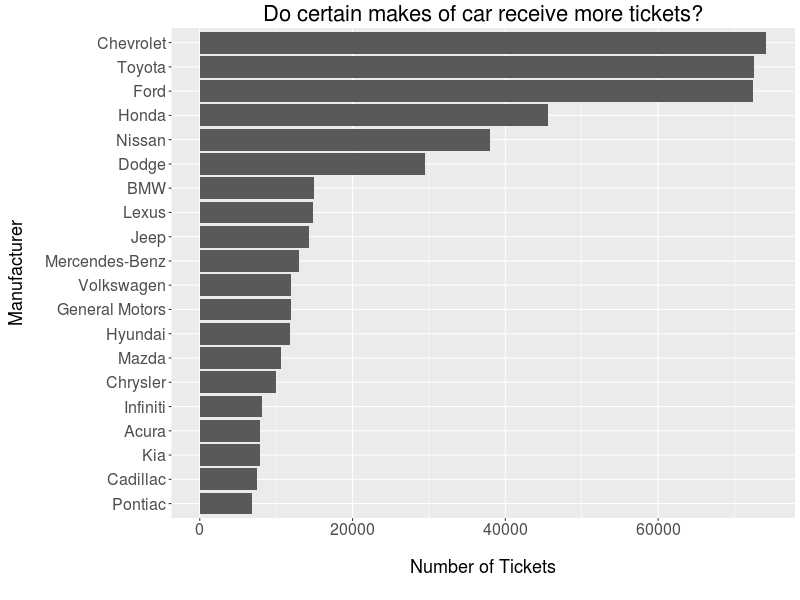
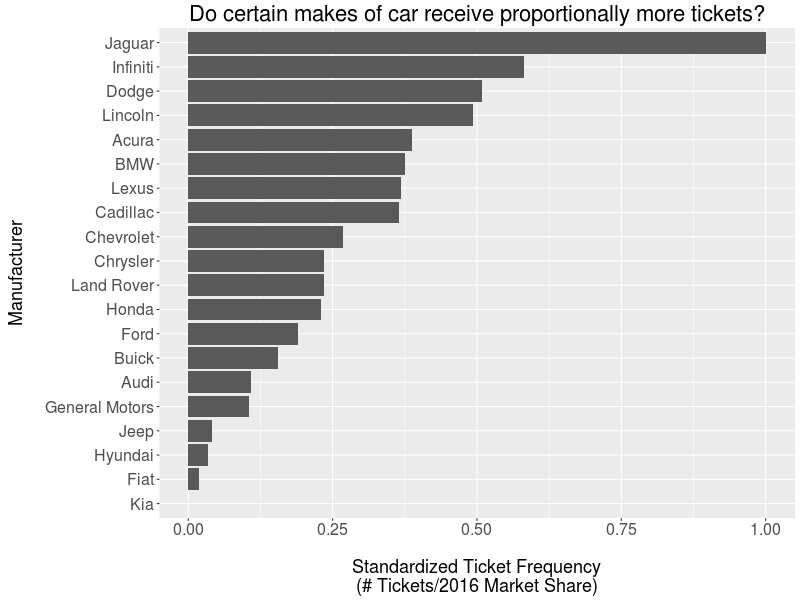
The below charts illustrate the number of tickets and ticket rate by automotive make respectively. The top plot shows the raw number of tickets given per vehicle make, while the bottom plot attempts to normalize these values by dividing the number of tickets by the vehicle make's market share (as determined by the edmunds.com team) and transforming the values of the top 20 manufacturers to lie on a 0 to 1 scale.
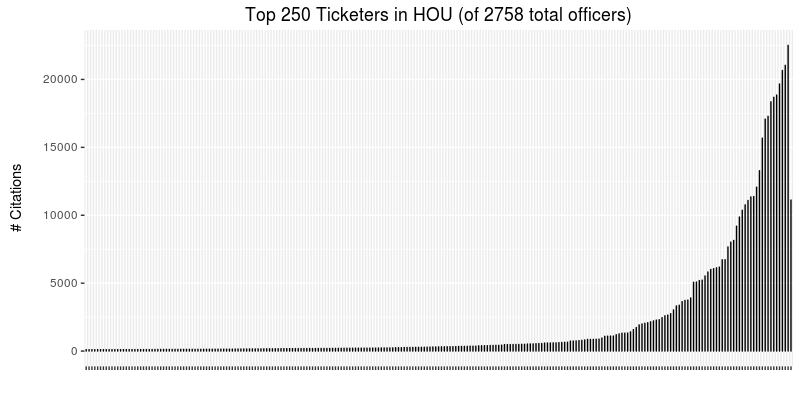
This plots shows the volume of tickets provided by various officers. The plot highlights the fact that only a small proportion of the officers who have registered citations in the system are responsible for the majority of the tickets.

