Skip to content
New issue

Have a question about this project? Sign up for a free GitHub account to open an issue and contact its maintainers and the community.

By clicking “Sign up for GitHub”, you agree to our terms of service and privacy statement. We’ll occasionally send you account related emails.

Already on GitHub? Sign in to your account

Part 1 of v0.11.3 Doc Updates #2379

Merged
merged 3 commits into from
Apr 13, 2023
Merged
Show file tree
Hide file tree
Changes from 2 commits
Commits
File filter

Filter by extension

Filter by extension


Conversations
Failed to load comments.
Jump to
Jump to file
Failed to load files.
Diff view
Diff view
15 changes: 11 additions & 4 deletions docs/docs/concepts/what-is-trace-based-testing.md
Original file line number Diff line number Diff line change
Expand Up @@ -8,12 +8,19 @@ Trace-Based Testing is a means of conducting deep integration or system tests by

A Distributed Trace, more commonly known as a Trace, records the paths taken by requests (made by an application or end-user) take as they propagate through multi-service architectures, like microservice and serverless applications. [Source - OpenTelemetry.io](https://opentelemetry.io/docs/concepts/observability-primer/)

![Trace & Spans Diagram](../img/trace-explainer.gif)
In Tracetest, after selecting a test from the first screen and clicking on the **Trace** tab, you will see the distributed trace for the selected test:

![Trace Example](../img/trace-example.png)


<!---![Trace & Spans Diagram](../img/trace-explainer.gif)-->

### **What is a Span?**

Traces are comprised of spans. A span represents a single operation in a trace. Spans are nested, typically with a parent child relationship to form a deeply nested tree.

![Span Example](../img/span-example.png)

### **What Data do Spans Contain?**


Expand All @@ -34,10 +41,10 @@ Attributes are a key-value pair, and they contain information about the operatio
## **What is a Test Spec?**


In Tracetest, an Test Spec is comprised of two parts:
In Tracetest, a Test Spec is comprised of two parts:


- Selector
- Selectors
Copy link
Collaborator

Choose a reason for hiding this comment

The reason will be displayed to describe this comment to others. Learn more.

The latest version of the app includes an optional name for test specs, not sure if we want to add it here as well

Screenshot 2023-04-13 at 11 21 15

- Checks

<!--- ![Selectors and Checks](img/assertion-explainer.gif) -->
Expand All @@ -51,7 +58,7 @@ A selector contains criteria to limit the scope of the spans from a trace that w
### **What is a Check?**


A check is a logical verification that will be performed on all spans that match the selector. It is comprised of an attribute, a comparison operator, and a value.
A check is a logical verification that will be performed on all spans that match the selector. It is comprised of an attribute, a comparison operator and a value.

### **What is a Span Signature?**

Expand Down
4 changes: 2 additions & 2 deletions docs/docs/configuration/analytics.md
Original file line number Diff line number Diff line change
Expand Up @@ -8,9 +8,9 @@ The data collected is anonymous and is not traceable to the source. You can lear

## Changing Analytics Settings from the UI

In the Tracetest Web UI, open Settings and select Analytics:
In the Tracetest Web UI, open (1) Settings and select the (2) Analytics tab:

![Analytics Settings](./img/analytics-settings.png)
![Analytics Settings](./img/analytics-settings-0.11.3.png)

From this analytics settings page, you can enable or disable the analytics.

Expand Down
4 changes: 2 additions & 2 deletions docs/docs/configuration/connecting-to-data-stores/awsxray.md
Original file line number Diff line number Diff line change
Expand Up @@ -18,9 +18,9 @@ Need help configuring the OpenTelemetry Collector so send trace data from your a

## Connect Tracetest to X-Ray with the Web UI

In the Web UI, open settings, and select AWS X-Ray.
In the Web UI, (1) open Settings, and, on the (2) Configure Data Store tab, select (3) AWS X-Ray.

![AWS X-Ray Settings](../img/configure-awsxray.png)
![AWS X-Ray Settings](../img/configure-awsxray-0.11.3.png)

From the configuration page, add your AWS credentials. You can use temporary credentials by running `aws sts get-session-token`.
Lastly, you can ensure the connection is working as expected by pressing the `Test Connection` button.
Expand Down
16 changes: 8 additions & 8 deletions docs/docs/configuration/connecting-to-data-stores/datadog.md
Original file line number Diff line number Diff line change
Expand Up @@ -6,7 +6,7 @@ If you want to use [Datadog](https://www.datadoghq.com/) as the trace data store
Examples of configuring Tracetest with Datadog can be found in the [`examples` folder of the Tracetest GitHub repo](https://github.com/kubeshop/tracetest/tree/main/examples).
:::

## Configuring OpenTelemetry Collector to Send Traces to both Datadog and Tracetest
## Configuring OpenTelemetry Collector to Send Traces to Both Datadog and Tracetest

In your OpenTelemetry Collector config file:

Expand All @@ -19,10 +19,10 @@ If you are running Tracetest with Docker, and Tracetest's service name is `trace

Additionally, add another config:

- Set the `exporter` to `datadog`
- Set the `api` pointing to your Datadog account
- Set the `site` to Datadog API `datadoghq.com`
- Set the `key` to your Datadog API key
- Set the `exporter` to `datadog`.
- Set the `api` pointing to your Datadog account.
- Set the `site` to Datadog API `datadoghq.com`.
- Set the `key` to your Datadog API key.

```yaml
# collector.config.yaml
Expand Down Expand Up @@ -77,9 +77,9 @@ Configure your Tracetest instance to expose an `otlp` endpoint to make it aware

## Connect Tracetest to Datadog with the Web UI

In the Web UI, open settings, and select Datadog.
In the Web UI, (1) open Settings, and, on the (2) Configure Data Store tab, select (3) Datadog.

![](../img/configure-datadog.png)
![Datadog](../img/configure-datadog-0.11.3.png)

## Connect Tracetest to Datadog with the CLI

Expand All @@ -93,7 +93,7 @@ spec:
isDefault: true
```

Proceed to run this command in the terminal, and specify the file above.
Proceed to run this command in the terminal and specify the file above.

```bash
tracetest datastore apply -f my/data-store/file/location.yaml
Expand Down
10 changes: 6 additions & 4 deletions docs/docs/configuration/connecting-to-data-stores/elasticapm.md
Original file line number Diff line number Diff line change
Expand Up @@ -28,18 +28,20 @@ To configure Elastic APM you will need to download the CA certificate from the D
- Alternatively, you can skip CA certificate validation by setting the `Enable TLS but don't verify the certificate` option.

:::tip
Need help configuring the OpenTelemetry Collector so send trace data from your application to Elastic? Read more in [the reference page here](../opentelemetry-collector-configuration-file-reference)).
Need help configuring the OpenTelemetry Collector so send trace data from your application to Elastic? Read more in [the reference page here](../opentelemetry-collector-configuration-file-reference).
:::

## Connect Tracetest to Elastic with the Web UI

In the Web UI, open settings, and select Elastic APM. If you are using Docker like in the screenshot below, use the service name as the hostname with port `9200`. Use `http`, or `https` if TLS is enabled.
In the Web UI, (1) open Settings and, on the (2) Configure Data Store tab, select (3) Elastic APM. If you are using Docker, as in the screenshot below, use the service name as the hostname with port `9200`. Use `http`, or `https` if TLS is enabled.

```
https://es01:9200
```

![](https://res.cloudinary.com/djwdcmwdz/image/upload/v1674566041/Blogposts/Docs/screely-1674566018046_ci0st9.png)
![ElasticAPM](../img/ElasticAPM-settings.png)

<!---![](https://res.cloudinary.com/djwdcmwdz/image/upload/v1674566041/Blogposts/Docs/screely-1674566018046_ci0st9.png)-->


## Connect Tracetest to Elastic with the CLI
Expand All @@ -61,7 +63,7 @@ spec:
insecureSkipVerify: true
```

Proceed to run this command in the terminal, and specify the file above.
Proceed to run this command in the terminal and specify the file above.

```bash
tracetest datastore apply -f my/data-store/file/location.yaml
Expand Down
7 changes: 5 additions & 2 deletions docs/docs/configuration/connecting-to-data-stores/jaeger.md
Original file line number Diff line number Diff line change
Expand Up @@ -18,13 +18,16 @@ Need help configuring the OpenTelemetry Collector so send trace data from your a

## Connect Tracetest to Jaeger with the Web UI

In the Web UI, open settings, and select Jaeger. If you are using Docker like in the screenshot below, use the service name as the hostname with port `16685` like this:
In the Web UI, (1) open Settings, and, on the (2) Configure Data Store tab, (3) select Jaeger. If you are using Docker like in the screenshot below, use the service name as the hostname with port `16685` like this:

```
jaeger:16685
```

![](https://res.cloudinary.com/djwdcmwdz/image/upload/v1674643178/Blogposts/Docs/screely-1674643170953_vazb9h.png)
![Jaeger](../img/Jaeger-settings.png)


<!---![](https://res.cloudinary.com/djwdcmwdz/image/upload/v1674643178/Blogposts/Docs/screely-1674643170953_vazb9h.png)-->


## Connect Tracetest to Jaeger with the CLI
Expand Down
Original file line number Diff line number Diff line change
Expand Up @@ -73,9 +73,11 @@ Configure your Tracetest instance to expose an `otlp` endpoint to make it aware

## Connect Tracetest to Lightstep with the Web UI

In the Web UI, open settings, and select Lightstep.
In the Web UI, (1) open Settings, and, on the (2) Configure Data Store tab, select (3) Lightstep.

![](https://res.cloudinary.com/djwdcmwdz/image/upload/v1674643396/Blogposts/Docs/screely-1674643391899_w6k22s.png)
![Lightstep](../img/Lightstep-settings.png)

<!---![](https://res.cloudinary.com/djwdcmwdz/image/upload/v1674643396/Blogposts/Docs/screely-1674643391899_w6k22s.png)-->

## Connect Tracetest to Lightstep with the CLI

Expand All @@ -89,7 +91,7 @@ spec:
isDefault: true
```

Proceed to run this command in the terminal, and specify the file above.
Proceed to run this command in the terminal and specify the file above.

```bash
tracetest datastore apply -f my/data-store/file/location.yaml
Expand Down
18 changes: 10 additions & 8 deletions docs/docs/configuration/connecting-to-data-stores/new-relic.md
Original file line number Diff line number Diff line change
Expand Up @@ -6,22 +6,22 @@ If you want to use [New Relic](https://newrelic.com/) as the trace data store, y
Examples of configuring Tracetest with New Relic can be found in the [`examples` folder of the Tracetest GitHub repo](https://github.com/kubeshop/tracetest/tree/main/examples).
:::

## Configuring OpenTelemetry Collector to Send Traces to both New Relic and Tracetest
## Configuring OpenTelemetry Collector to Send Traces to B New Relic and Tracetest

In your OpenTelemetry Collector config file:

- Set the `exporter` to `otlp/tt`
- Set the `endpoint` to your Tracetest instance on port `21321`

:::tip
If you are running Tracetest with Docker, and Tracetest's service name is `tracetest`, then the endpoint might look like this `http://tracetest:21321`
If you are running Tracetest with Docker and Tracetest's service name is `tracetest`, then the endpoint might look like this `http://tracetest:21321`
:::

Additionally, add another config:

- Set the `exporter` to `otlp/nr`
- Set the `endpoint` pointing to your New Relic account and the New Relic ingest API
- Set your New Relic access token as a `header`
- Set the `exporter` to `otlp/nr`.
- Set the `endpoint` pointing to your New Relic account and the New Relic ingest API.
- Set your New Relic access token as a `header`.

```yaml
# collector.config.yaml
Expand Down Expand Up @@ -76,9 +76,11 @@ Configure your Tracetest instance to expose an `otlp` endpoint to make it aware

## Connect Tracetest to New Relic with the Web UI

In the Web UI, open settings, and select New Relic.
In the Web UI, (1) open Settings, and, on the (2) Configure Data Store tab, select (3) New Relic.

![](https://res.cloudinary.com/djwdcmwdz/image/upload/v1674643685/Blogposts/Docs/screely-1674643680615_de8fry.png)
![NewRelic](../img/New-Relic-settings.png)

<!---![](https://res.cloudinary.com/djwdcmwdz/image/upload/v1674643685/Blogposts/Docs/screely-1674643680615_de8fry.png)-->


## Connect Tracetest to New Relic with the CLI
Expand All @@ -93,7 +95,7 @@ spec:
isDefault: true
```

Proceed to run this command in the terminal, and specify the file above.
Proceed to run this command in the terminal and specify the file above.

```bash
tracetest datastore apply -f my/data-store/file/location.yaml
Expand Down
Original file line number Diff line number Diff line change
Expand Up @@ -25,13 +25,15 @@ Need help configuring the OpenTelemetry Collector so send trace data from your a

## Connect Tracetest to OpenSearch with the Web UI

In the Web UI, open settings, and select OpenSearch. If you are using Docker like in the screenshot below, use the service name as the hostname with port `9200`. Use `http`, or `https` if TLS is enabled.
In the Web UI, (1) open settings, and, on the (2) Configure Data Store tab, select (3) OpenSearch. If you are using Docker like in the screenshot below, use the service name as the hostname with port `9200`. Use `http`, or `https` if TLS is enabled.

```
http://opensearch:9200
```

![](https://res.cloudinary.com/djwdcmwdz/image/upload/v1674644099/Blogposts/Docs/screely-1674644094600_svcwp6.png)
![OpenSearch](../img/opensearch-settings.png)

<!---![](https://res.cloudinary.com/djwdcmwdz/image/upload/v1674644099/Blogposts/Docs/screely-1674644094600_svcwp6.png)-->


## Connect Tracetest to OpenSearch with the CLI
Expand Down
Original file line number Diff line number Diff line change
Expand Up @@ -56,15 +56,17 @@ service:
exporters: [otlp/1] # your exporter pointing to your tracetest instance
```

## Configure Tracetest to use OpenTelemetry Collector
## Configure Tracetest to Use OpenTelemetry Collector

Configure your Tracetest instance to expose an `otlp` endpoint to make it aware it will receive traces from the OpenTelemetry Collector. This will expose Tracetest's trace receiver on port `21321`.

## Connect Tracetest to OpenTelemetry Collector with the Web UI

In the Web UI, open settings, and select OpenTelemetry Collector.
In the Web UI, (1) open Settings, and, on the (2) Configure Data Store tab, select (3) OpenTelemetry.

![](https://res.cloudinary.com/djwdcmwdz/image/upload/v1674644190/Blogposts/Docs/screely-1674644186486_pahrds.png)
![OpenTelemetry](../img/open-telemetry-settings.png)

<!---![](https://res.cloudinary.com/djwdcmwdz/image/upload/v1674644190/Blogposts/Docs/screely-1674644186486_pahrds.png) -->


## Connect Tracetest to OpenTelemetry Collector with the CLI
Expand Down
8 changes: 5 additions & 3 deletions docs/docs/configuration/connecting-to-data-stores/signalfx.md
Original file line number Diff line number Diff line change
Expand Up @@ -6,7 +6,7 @@ Tracetest fetches traces from [SignalFx's realm and token](https://docs.splunk.c
Examples of configuring Tracetest can be found in the [`examples` folder of the Tracetest GitHub repo](https://github.com/kubeshop/tracetest/tree/main/examples).
:::

## Configure Tracetest to use SignalFx as a Trace Data Store
## Configure Tracetest to Use SignalFx as a Trace Data Store

Configure Tracetest to be aware that it has to fetch trace data from SignalFx.

Expand All @@ -16,7 +16,7 @@ Need help configuring the OpenTelemetry Collector so send trace data from your a

## Connect Tracetest to SignalFx with the Web UI

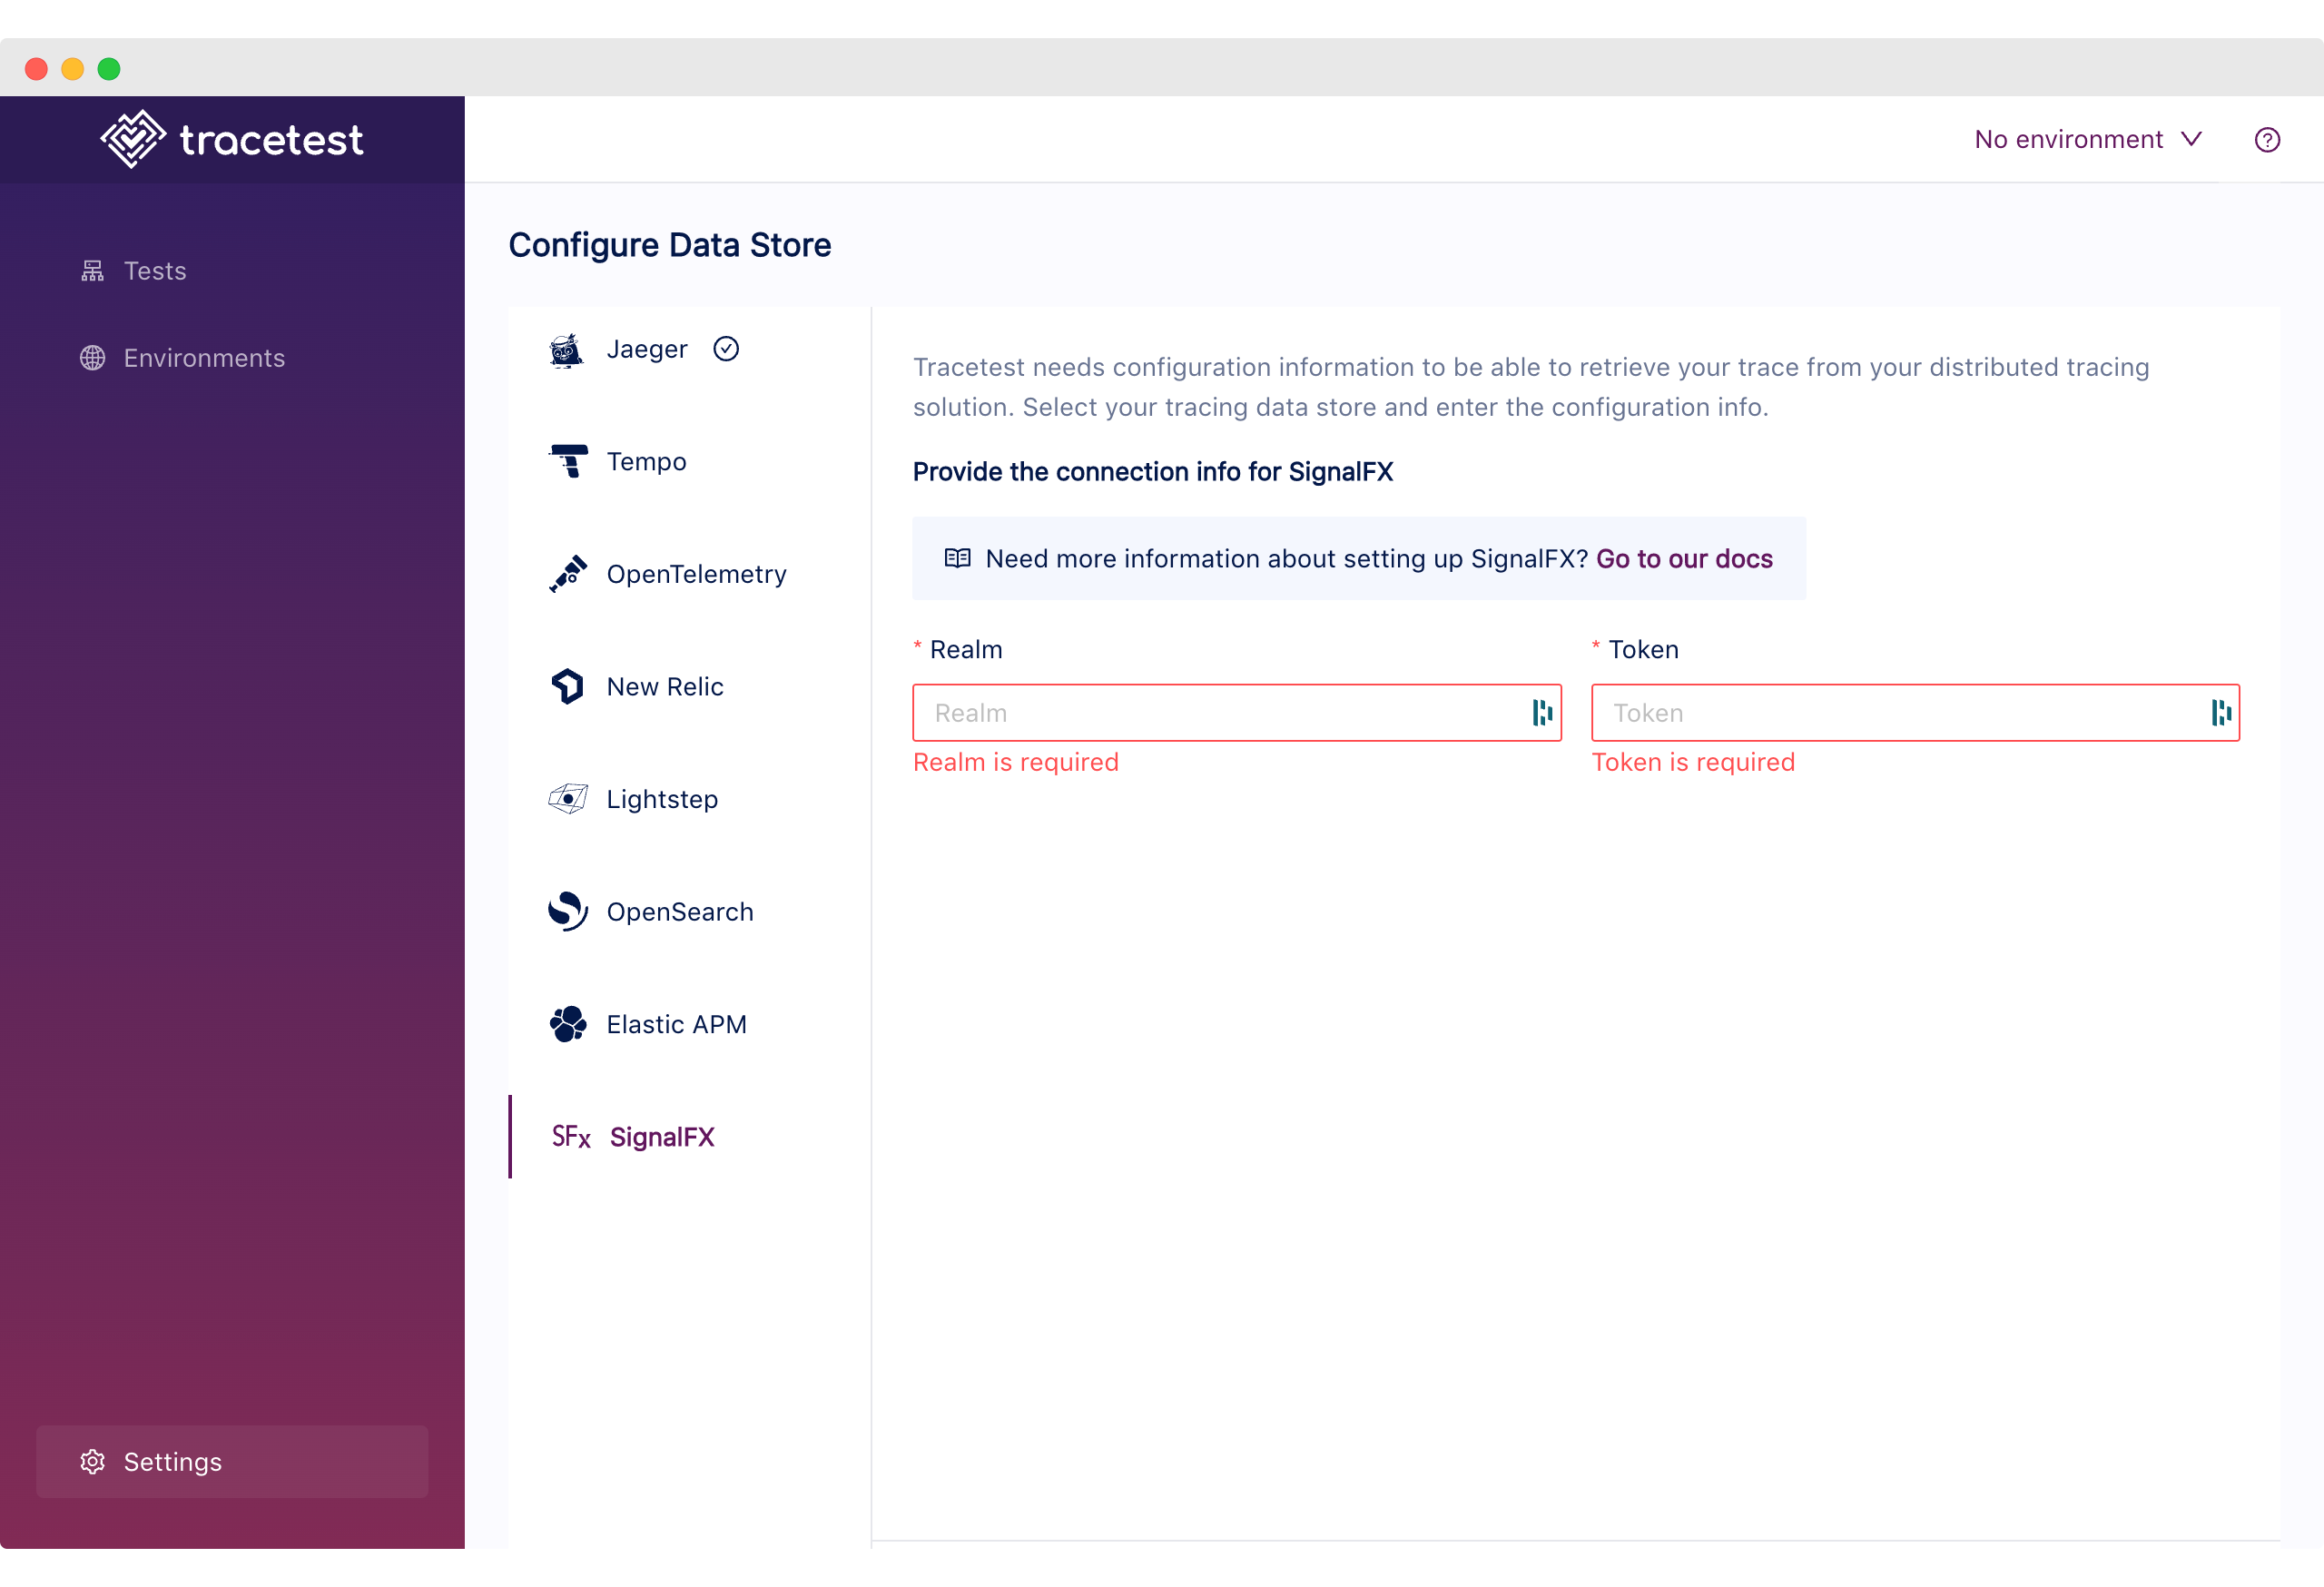
In the Web UI, open settings, and select SignalFx.
In the Web UI, (1) open Settings, and, on the (2) Configure Data Store tab, (3) select SignalFx.

You need your SignalFx:

Expand All @@ -25,7 +25,9 @@ You need your SignalFx:

Follow this [guide](https://docs.splunk.com/Observability/references/organizations.html).

![](https://res.cloudinary.com/djwdcmwdz/image/upload/v1674644337/Blogposts/Docs/screely-1674644332529_cks0lw.png)
![SignalFX](../img/SignalFX-settings.png)
Copy link
Collaborator

Choose a reason for hiding this comment

The reason will be displayed to describe this comment to others. Learn more.

When running the npm run build command in the docs folder I get an error about this image being missing, do you mind taking a look?

Copy link
Member Author

Choose a reason for hiding this comment

The reason will be displayed to describe this comment to others. Learn more.

Can you use it from this file upload?
SignalFX-settings


<!---![](https://res.cloudinary.com/djwdcmwdz/image/upload/v1674644337/Blogposts/Docs/screely-1674644332529_cks0lw.png)-->


## Connect Tracetest to SignalFx with the CLI
Expand Down
9 changes: 6 additions & 3 deletions docs/docs/configuration/connecting-to-data-stores/tempo.md
Original file line number Diff line number Diff line change
Expand Up @@ -69,23 +69,26 @@ Need help configuring the OpenTelemetry Collector so send trace data from your a

## Connect Tracetest to Tempo with the Web UI

In the Web UI, open settings, and select Tempo. Then, select either `gRPC` or `HTTP`.
IIn the Web UI, (1) open Settings, and, on the (2) Configure Data Store tab, (3) select Tempo. Then, select either `gRPC` or `HTTP`.

If you are using Docker and the `gRPC` endpoint like in the screenshot below, use the service name as the hostname with port `9095` like this:

```
tempo:9095
```
![Tempo](../img/Tempo-settings.png)

![](https://res.cloudinary.com/djwdcmwdz/image/upload/v1678891103/Blogposts/Docs/screely-1678891089174_jyclka.png)
<!---![](https://res.cloudinary.com/djwdcmwdz/image/upload/v1678891103/Blogposts/Docs/screely-1678891089174_jyclka.png)-->

If you are using Docker and the `HTTP` URL like in the screenshot below, use the service name as the hostname with port `80` or no specified port like this:

```
http://tempo
```

![](https://res.cloudinary.com/djwdcmwdz/image/upload/v1678982310/Blogposts/Docs/screely-1678982283099_ywstac.png)
![Tempo](../img/Tempo-settings.png)

<!---![](https://res.cloudinary.com/djwdcmwdz/image/upload/v1678982310/Blogposts/Docs/screely-1678982283099_ywstac.png)-->


## Connect Tracetest to Tempo with the CLI
Expand Down
8 changes: 4 additions & 4 deletions docs/docs/configuration/demo.md
Original file line number Diff line number Diff line change
@@ -1,12 +1,12 @@
# Demo Settings

Tracetest has the option to enable Test examples for our Pokeshop Demo App or the OpenTelemetry Astronomy Shop Demo. You will require an instance of those applications running alongside your Tracetest server to be able to use them. The demo settings can be adjusted both from the Tracetest UI and from the CLI.
Tracetest has the option to enable Test examples for our Pokeshop Demo App or the OpenTelemetry Astronomy Shop Demo. You will need an instance of those applications running alongside your Tracetest server to be able to use them. The demo settings can be adjusted both from the Tracetest UI and from the CLI.

## Changing Demo Settings from the UI

In the Web UI, open Settings and select Demo:
In the Web UI, open (1) Settings and select the (2) Demo tab:

![Demo Settings](./img/demo-settings.png)
![Demo Settings](./img/demo-settings-0.11.3.png)

From this demo settings page, you can enable the Pokeshop and/or OpenTelemetry Astronomy Shop demos. For each demo, you will need to tell Tracetest the location of the relevant demo's endpoints, adjusting the domain name/ip address and, possibly, the port to match your configuration.

Expand All @@ -26,7 +26,7 @@ spec:
grpcEndpoint: demo-pokemon-api.demo:8082
```

Proceed to run this command in the terminal, and specify the file above.
Proceed to run this command in the terminal and specify the file above.

```bash
tracetest apply demo -f my/resource/demo-resource.yaml
Expand Down
Sorry, something went wrong. Reload?
Sorry, we cannot display this file.
Sorry, this file is invalid so it cannot be displayed.
Binary file added docs/docs/configuration/img/Jaeger-settings.png
Sorry, something went wrong. Reload?
Sorry, we cannot display this file.
Sorry, this file is invalid so it cannot be displayed.
Sorry, something went wrong. Reload?
Sorry, we cannot display this file.
Sorry, this file is invalid so it cannot be displayed.
Sorry, something went wrong. Reload?
Sorry, we cannot display this file.
Sorry, this file is invalid so it cannot be displayed.
Binary file added docs/docs/configuration/img/Tempo-settings.png
Sorry, something went wrong. Reload?
Sorry, we cannot display this file.
Sorry, this file is invalid so it cannot be displayed.
Sorry, something went wrong. Reload?
Sorry, we cannot display this file.
Sorry, this file is invalid so it cannot be displayed.
Sorry, something went wrong. Reload?
Sorry, we cannot display this file.
Sorry, this file is invalid so it cannot be displayed.
Sorry, something went wrong. Reload?
Sorry, we cannot display this file.
Sorry, this file is invalid so it cannot be displayed.
Sorry, something went wrong. Reload?
Sorry, we cannot display this file.
Sorry, this file is invalid so it cannot be displayed.
Sorry, something went wrong. Reload?
Sorry, we cannot display this file.
Sorry, this file is invalid so it cannot be displayed.
Sorry, something went wrong. Reload?
Sorry, we cannot display this file.
Sorry, this file is invalid so it cannot be displayed.
Binary file added docs/docs/configuration/img/trace-example.png
Sorry, something went wrong. Reload?
Sorry, we cannot display this file.
Sorry, this file is invalid so it cannot be displayed.
Sorry, something went wrong. Reload?
Sorry, we cannot display this file.
Sorry, this file is invalid so it cannot be displayed.
Original file line number Diff line number Diff line change
@@ -1,6 +1,6 @@
# OpenTelemetry Collector Configuration File Reference

This page contains a reference for using OpenTelemetry Collector to send trace data from your application to any of Tracetest's supported trace data stores.
This page contains a reference for using the OpenTelemetry Collector to send trace data from your application to any of Tracetest's supported trace data stores.

:::tip
Examples of configuring Tracetest can be found in the [`examples` folder of the Tracetest GitHub repo](https://github.com/kubeshop/tracetest/tree/main/examples).
Expand All @@ -24,7 +24,7 @@ Continue reading below to learn how to configure the OpenTelemetry Collector to

## Configure OpenTelemetry Collector to Send Traces to Jaeger

In your OpenTelemetry Collector config file, make sure to set the `exporter` to `jaeger`, with the `endpoint` pointing to your Jaeger's instance on port `14250`. If you are running Tracetest with Docker, the endpoint might look like this `http://jaeger:14250`.
In your OpenTelemetry Collector config file, make sure to set the `exporter` to `jaeger`, with the `endpoint` pointing to your Jaeger instance on port `14250`. If you are running Tracetest with Docker, the endpoint might look like this `http://jaeger:14250`.

```yaml
# collector.config.yaml
Expand Down
2 changes: 1 addition & 1 deletion docs/docs/configuration/overview.md
Original file line number Diff line number Diff line change
Expand Up @@ -24,7 +24,7 @@ Currently, Tracetest supports the following data stores. Click on the respective

Another option is to send traces directly to Tracetest using the OpenTelemetry Collector. And, you don't have to change your existing pipelines to do so.

View the [configuration for OpenTelemetry Collector](./connecting-to-data-stores/opentelemetry-collector) for more details.
View [configuration for OpenTelemetry Collector](./connecting-to-data-stores/opentelemetry-collector) for more details.

## Trace Data Store Configuration Examples

Expand Down