This sample application demonstrates generic business process visibility using the ALEK stack (Activiti, logstash, Elasticsearch and Kibana).
This application provides visibility for a trivial business process:

Usesbt run to run the example.
The application consists of a minimal amount of code that performs the following steps.
- The
Mainclass is the entry point, which starts the Activiti engine using an in-memory H2 database and deploys the business process from an XML definition. Mainthen executes the deployed process a few times with random data in process variables.LoggingEventListeneris an Activiti event listener that logs the current process variables each time an activity (process node) is activated.logback.xmlconfigures logback to write a log file.logstash.confconfigures logstash to parse the resulting log file and insert process logging into ElasticSearch.- Kibana’s default logstash dashboard displays the results.
The log file output uses application and process loggers, and produces the following output.
2014-03-24 18:30:54,615 INFO application Main
2014-03-24 18:30:56,935 INFO application Deploy business process
2014-03-24 18:30:57,494 INFO application Execute business processes
2014-03-24 18:30:57,609 INFO process.logging-test:19:1903 execution=1904 number=526 country=BD currency='Solomon Islands Dollar' activity=start
2014-03-24 18:30:57,610 INFO process.logging-test:19:1903 execution=1904 number=526 country=BD currency='Solomon Islands Dollar' activity=example-task
2014-03-24 18:30:57,614 INFO process.logging-test:19:1903 execution=1904 number=526 country=BD currency='Solomon Islands Dollar' activity=end
2014-03-24 18:30:57,732 INFO process.logging-test:19:1903 execution=1911 number=694 country=HN currency='New Taiwan Dollar' activity=start
2014-03-24 18:30:57,732 INFO process.logging-test:19:1903 execution=1911 number=694 country=HN currency='New Taiwan Dollar' activity=example-task
2014-03-24 18:30:57,733 INFO process.logging-test:19:1903 execution=1911 number=694 country=HN currency='New Taiwan Dollar' activity=end
2014-03-24 18:30:57,853 INFO process.logging-test:19:1903 execution=1918 number=951 country=MM currency='Testing Currency Code' activity=start
2014-03-24 18:30:57,854 INFO process.logging-test:19:1903 execution=1918 number=951 country=MM currency='Testing Currency Code' activity=example-task
2014-03-24 18:30:57,854 INFO process.logging-test:19:1903 execution=1918 number=951 country=MM currency='Testing Currency Code' activity=end
2014-03-24 18:30:57,884 INFO application Done
The process logger category includes the business process definition ID, which is useful if you have multiple business
processes. Each process log message consists of key-value pairs for the process variables, plus additional execution
(process execution ID) and activity (process node ID) values.
The logstash configuration ignores all but the process log statements, parses the key-value pairs into ‘facets’ and
inserts a ‘document’ into Elasticsearch for each log statement. For example:
{
       "message" => "2014-03-24 18:39:18,083 INFO process.logging-test:20:2003 execution=2011 number=213 country=GD currency='Turkish Lira' activity=example-task",
      "@version" => "1",
    "@timestamp" => "2014-03-24T18:39:18.083+01:00",
          "host" => "flowers",
          "path" => "/Users/pedro/Documents/code/lunatech/activiti-logstash/process.log",
         "level" => "INFO",
        "logger" => "process.logging-test:20:2003",
     "execution" => "2011",
        "number" => "213",
       "country" => "GD",
      "currency" => "Turkish Lira",
      "activity" => "example-task"
}
You can then modify Kibana’s default logstash dashboard by adding panels that show values for the various facets.
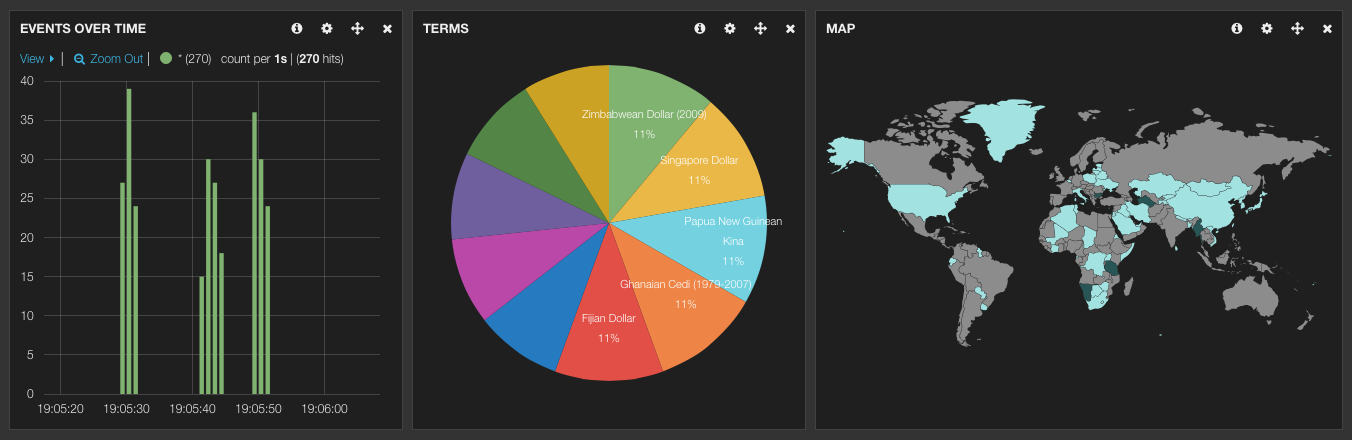
In this example the first panel shows a timeline of log events, grouped into one-second intervals, a pie chart of currencies and a map of countries.