-
-
Notifications
You must be signed in to change notification settings - Fork 7.5k
New issue
Have a question about this project? Sign up for a free GitHub account to open an issue and contact its maintainers and the community.
By clicking “Sign up for GitHub”, you agree to our terms of service and privacy statement. We’ll occasionally send you account related emails.
Already on GitHub? Sign in to your account
When I saved graph in JPG format it's outer axis are no longer present. #10749
Comments
|
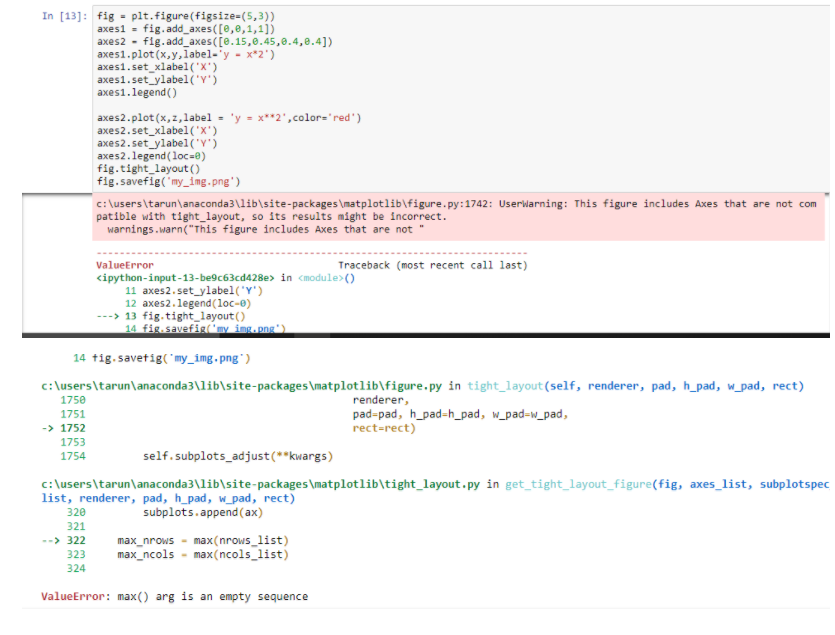
This is not a bug, and the result is expected. First, Second,
If you want to use |
|
Just to add a little bit here, the reason why you are seeing the axes
labels in your jupyter notebook is because jupyter turns on a feature
called `bbox_inches='tight'` by default. This is usually used to trim off
excess whitespace around a figure. However, this can also have the effect
of padding a figure so that its entire contents appear. Meanwhile, when you
are saving the image, you don't have that feature turned on, so the figure
is saved without padding.
…On Sun, Mar 11, 2018 at 8:56 AM, Importance of Being Ernest < ***@***.***> wrote:
This is not a bug.
First, add_axes([0,0,1,1]) creates an axes which is exactly as large as
the figure. Therefore it is expected that the labels are outside of the
figure.
Second, tight_layout can only be used on figures which include subplots.
From the documentation
<https://matplotlib.org/users/tight_layout_guide.html>:
tight_layout automatically adjusts subplot params so that the subplot(s)
fits in to the figure area.
If you want to use tight_layout, use subplots instead of simple axes. If
you have a problem of implementing, consider refering to existing questions
on stackoverflow or consider asking a question there.
—
You are receiving this because you are subscribed to this thread.
Reply to this email directly, view it on GitHub
<#10749 (comment)>,
or mute the thread
<https://github.com/notifications/unsubscribe-auth/AARy-IPw1GKUpLPFTHS9pRKkWOO5Nkc-ks5tdR8NgaJpZM4SllSK>
.
|
|
|
#Code


#After saving when I opened the img
#Adding fig.tight_layout() results in err
The text was updated successfully, but these errors were encountered: