constrained_layout support for figure.legend #13023
Comments
|
What behaviour would you expect? If you want the legend to steal space on the figure from the axes, then call |
|
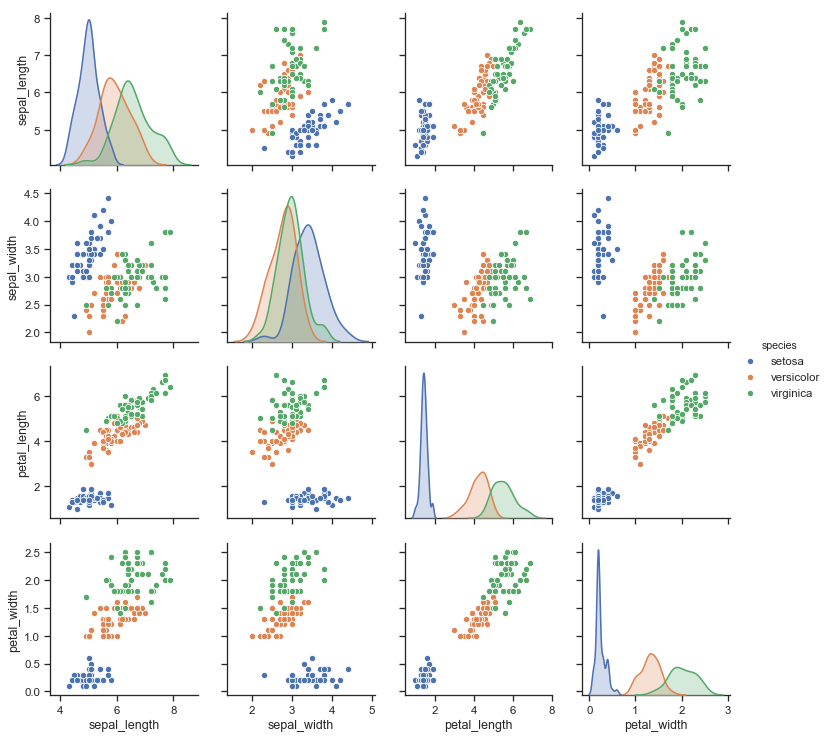
Yes. Here's an example from seaborn. I would expect this to be the result of
|
|
How would constrained layout know which subplots to steal space from for the legend? A figure legend doesn’t belong to any axes, so there is no natural way to do what you are asking. Again if you attach the legend to one of the rightmost axes, it will do what you want. |
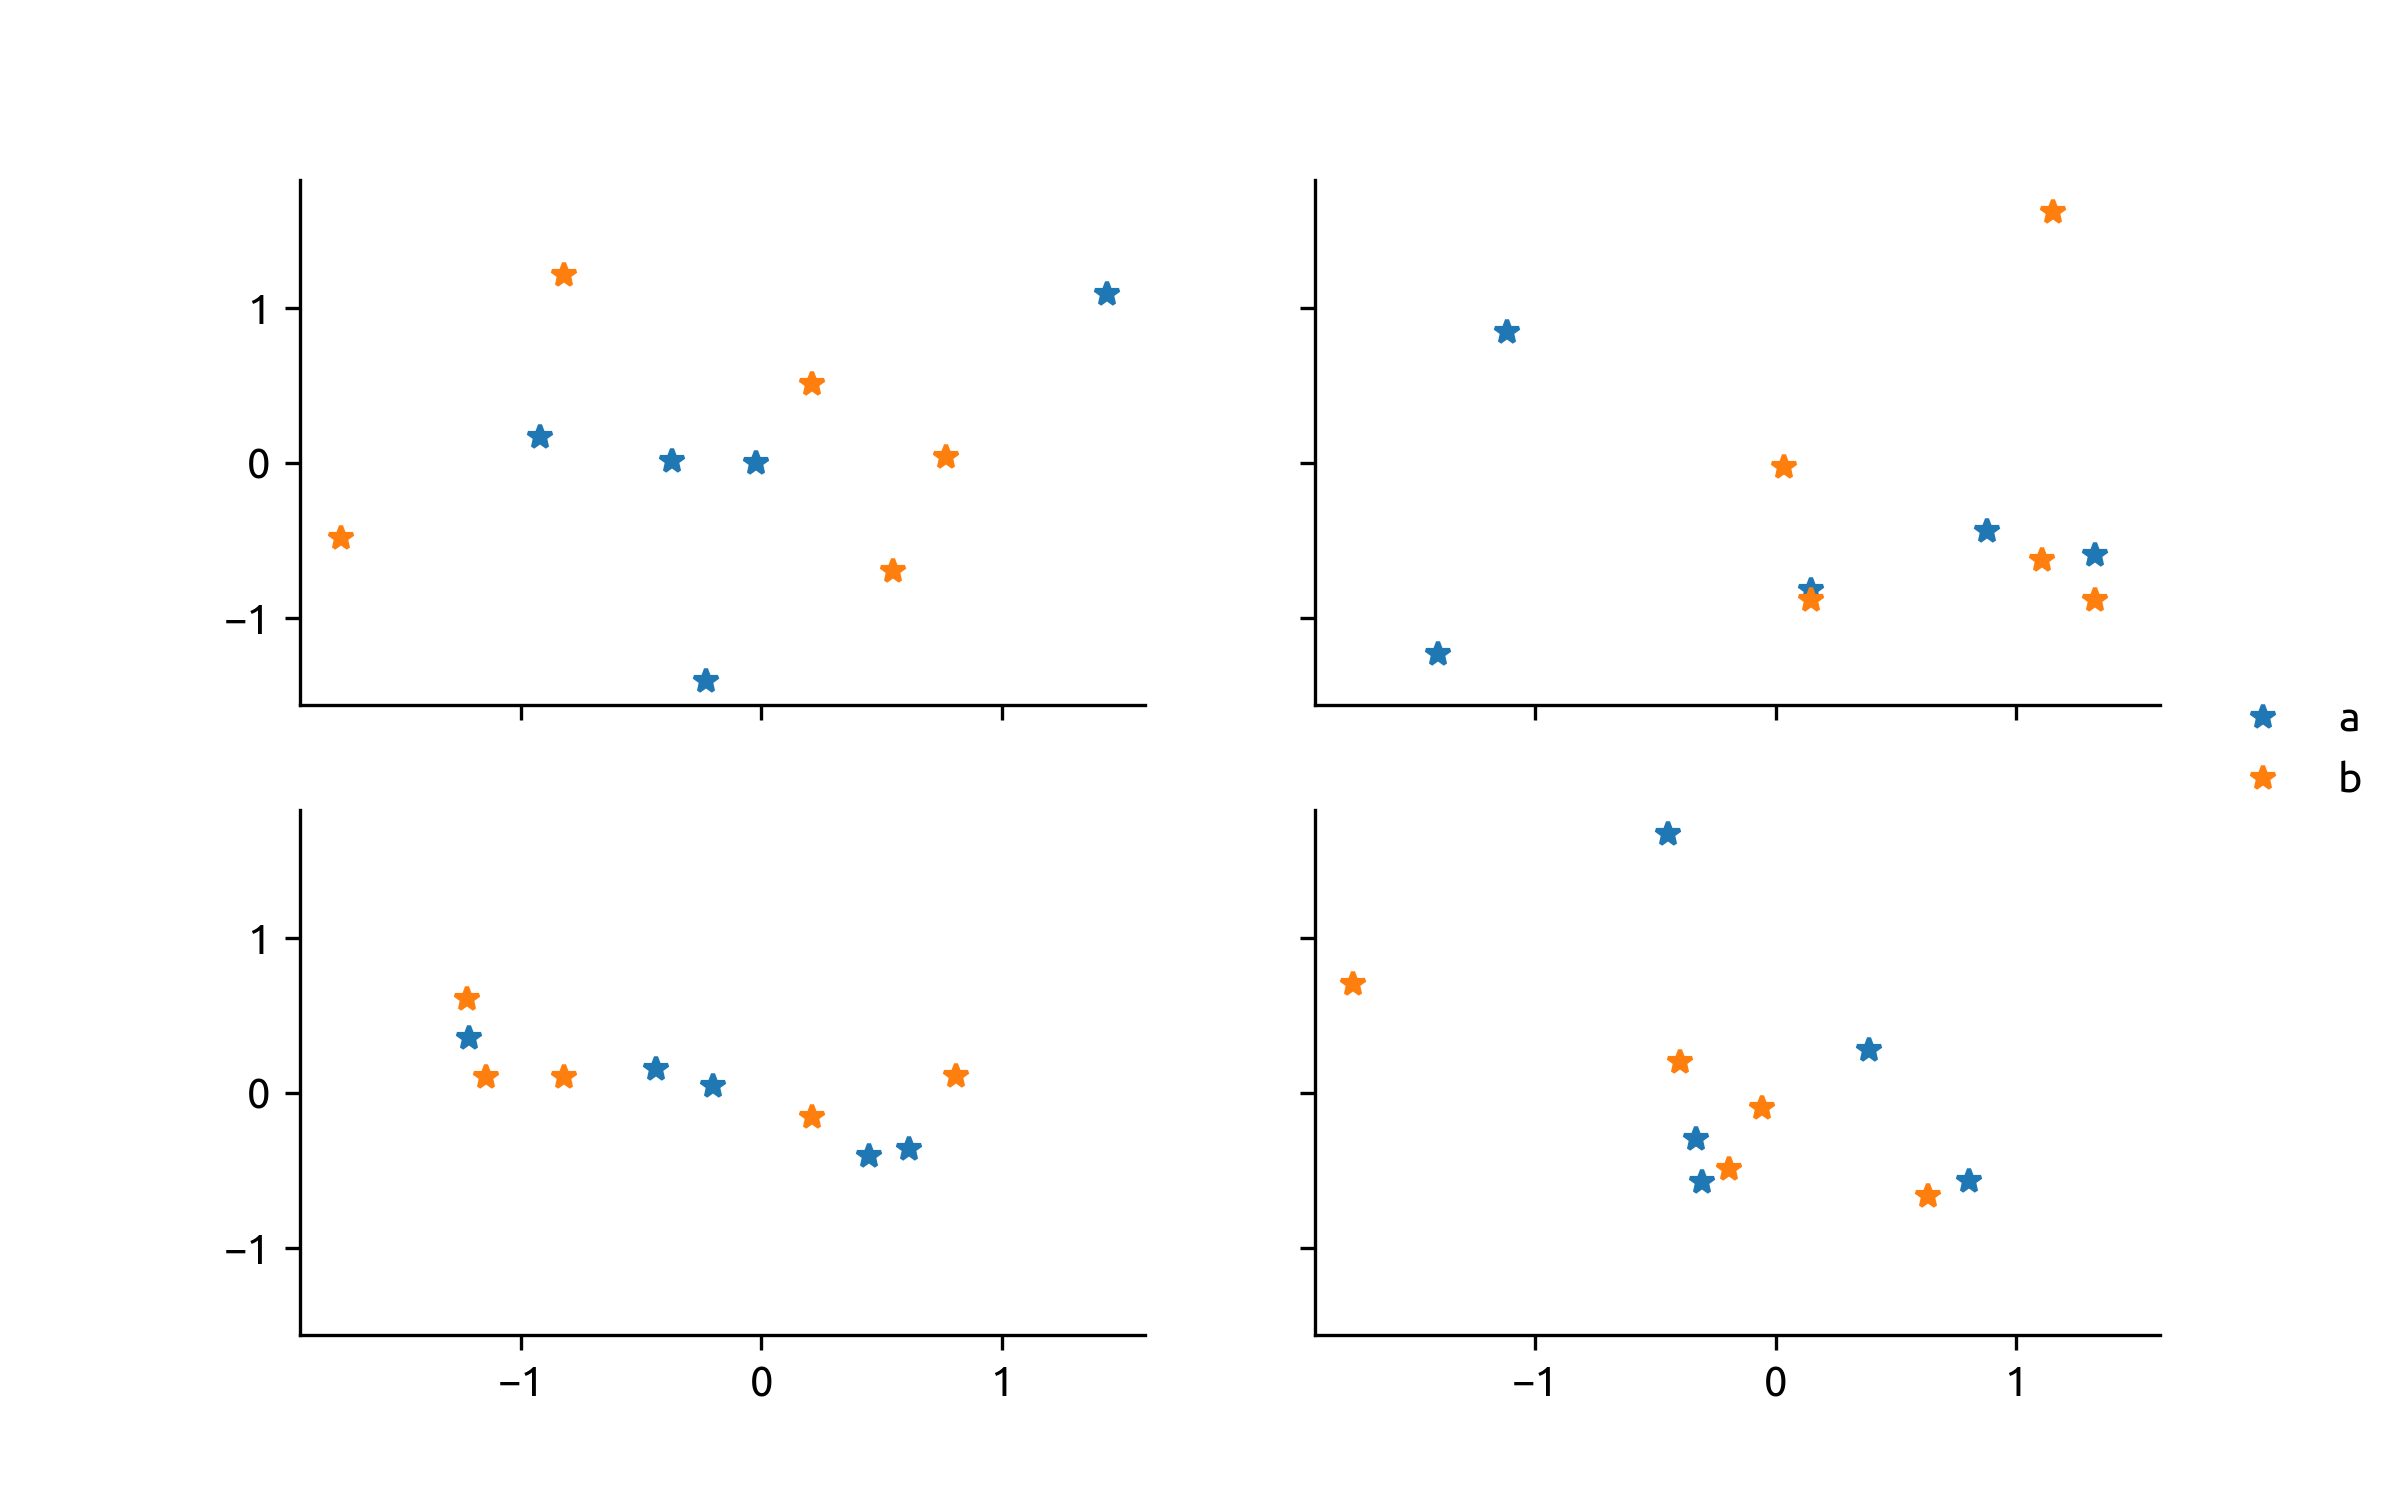
Do what colorbar does? colorbar does have an Here's an example. I'd like the f, ax = plt.subplots(2, 2, sharex=True, sharey=True, constrained_layout=False)
h = list()
for aa in ax.flat:
h.append(aa.plot(np.random.randn(5), np.random.randn(5), '*')[0])
h.append(aa.plot(np.random.randn(5), np.random.randn(5), '*')[0])
hleg = f.legend(handles=h[-2:], labels=['a', 'b'],
loc='center right')
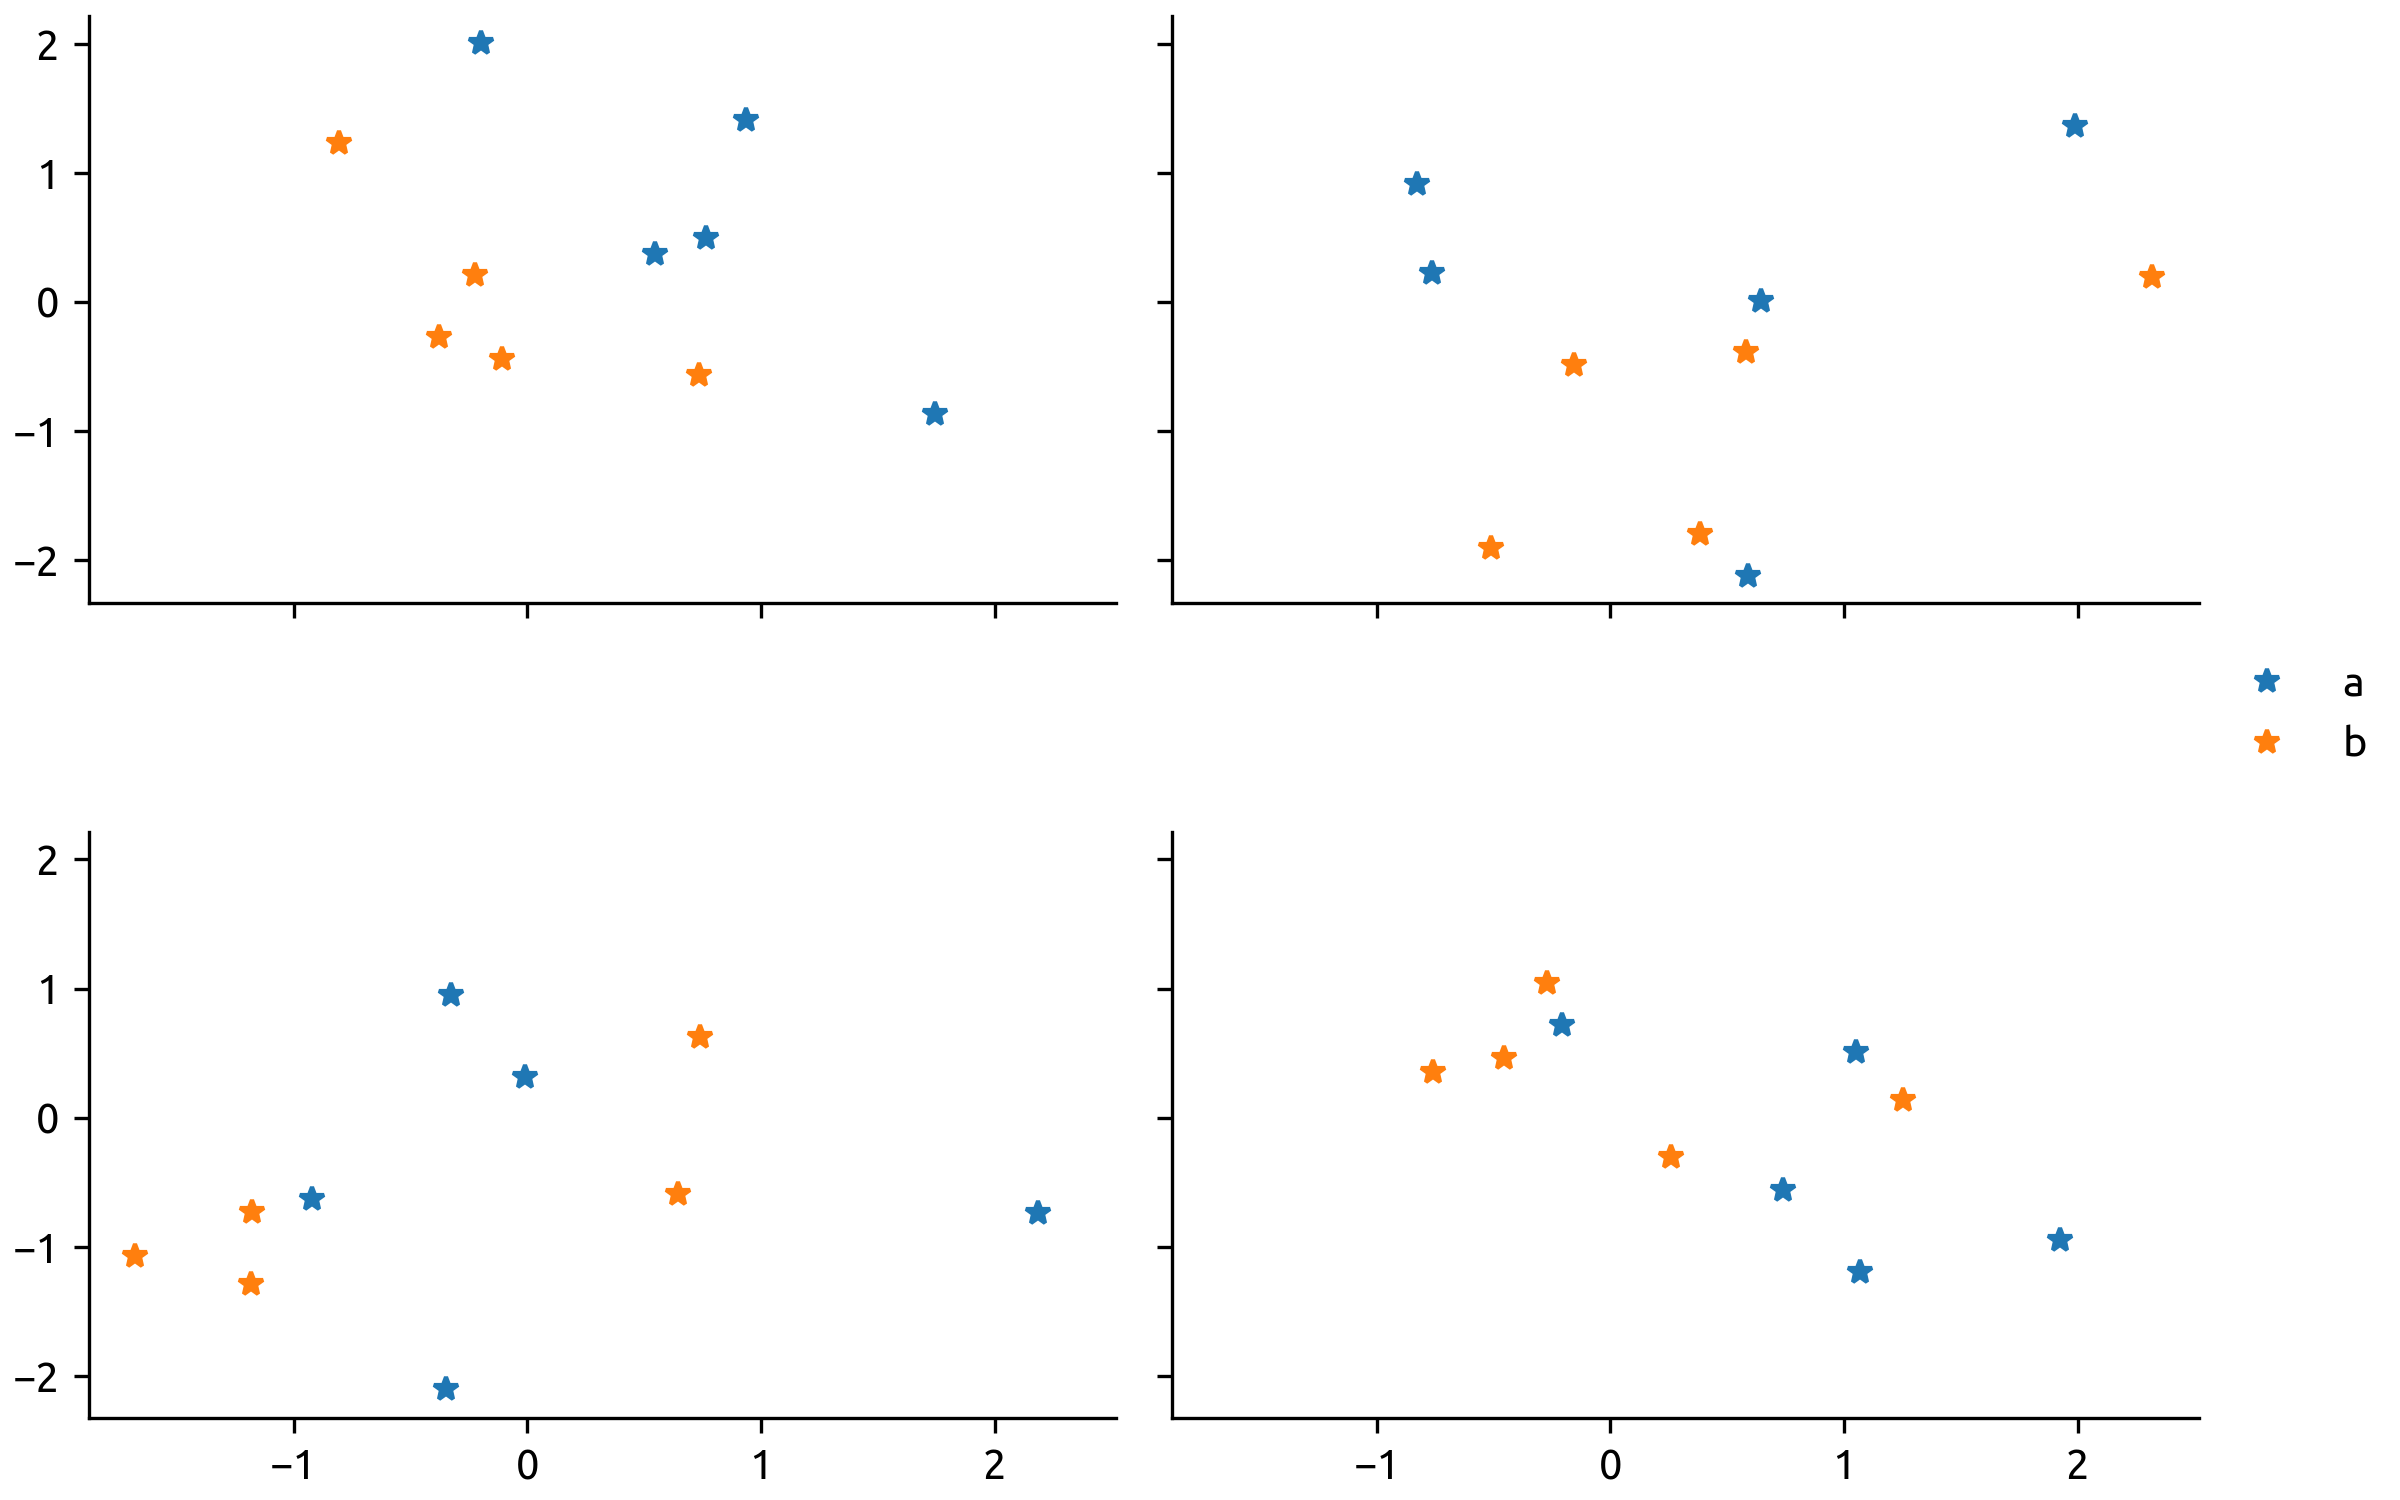
Here's my attempt at a constrained_layout version using f, ax = plt.subplots(2, 2, sharex=True, sharey=True, constrained_layout=True)
h = list()
for aa in ax.flat:
h.append(aa.plot(np.random.randn(5), np.random.randn(5), '*')[0])
h.append(aa.plot(np.random.randn(5), np.random.randn(5), '*')[0])
hleg = ax[1, 1].legend(handles=h[-2:], labels=['a', 'b'],
loc='center right',
bbox_to_anchor=(1.2, 1.2))
|
|
What is happening above is ax[1, 1] is saying it is bigger than the other axes, and makes space for itself in the layout. To avoid this, don't anchor it above the top of the axes. Yes, your legend will not be vertically centred. We could come up with an API to automatically insert anchored boxes and steal space from the other elements in a gridspec (the container of your four subplots). We do that now for suptitle (sort of) and, as you say, colorbar. So the question is how to pass that info down to |
|
Thought about this some more, and its quite a hard problem.
|
|
Is it feasible to only add support for certain legend configurations in a first step? E.g. don‘t handle legends with |
|
I was going to say the same. The |
|
Hmmmm. Not a fan of that. Seems mysterious and a documentation PITA I was leaning towards a new method, ideally attached to gridspec. That’s easier from the point of view of being able to specify a new API. I think conceptually this is easy enough to implement in constrained_layout. But I’m not sure about implementing without constrained_layout. Legends are packable boxes and hence hard to predict their size a priori. For instance they can be arbitrarily wide or high. I’d propose writing a separate method for now and then figure.legend could call that given the right conditions. |
Sounds like a reasonable approach. Though, I'm not quite involved in this stuff, and therefore I'm not a good judge. Withdrawing from the discussion for now. |
|
I have a proof of concept that works great for this. Up for ideas about how to specify locations and whether the arrangement with the rest of the gridspec is horizontal or vertical. The typical location “northeast” or “southeast” is ambiguous because it doesn’t specify if the gridspec’s Axes give way vertically or horizontally. We’d could either have another kwarg, or let the Suggestions welcome. For now, I think I’ll go w/ implementing horizontal arrangement, and just not support “north” or “south” (I.e. “northeast” will arrange horizontally, with the legend in the upper right corner). |
|
Using an extra kwarg |
Just a feature request to have constrained_layout support
figure.legendThe text was updated successfully, but these errors were encountered: