WIP ENH secondary axes: #11589
WIP ENH secondary axes: #11589
Conversation
|
Accepting comments on this. Of course, not for 3.0, so no rush. Tests, examples, etc still to be done. |
|
@ImportanceOfBeingErnest you are very familiar w/ the axes_grid API. Any comments here? |
7144635
to
29d05ac
Compare
|
|
||
| def set_color(self, color): | ||
| """ | ||
| Change the color of the secondary axes and all decorators |
There was a problem hiding this comment.
I would add here that this is a convenience wrapper and that you may of course use the usual methods to set the color of the label, tickmarks, ticklabels and spines individually as well, in case this is desired.
lib/matplotlib/axes/_axes.py
Outdated
| loc : string or scalar | ||
| FIX | ||
| The position to put the secondary axis. Strings can be 'top' or | ||
| 'bottom', scalar can be a float indicating the relative position |
There was a problem hiding this comment.
"left" or "right"
lib/matplotlib/axes/_axes.py
Outdated
|
|
||
| return rectpatch, connects | ||
|
|
||
| def secondary_xaxis(self, loc, conversion, **kwargs): |
There was a problem hiding this comment.
Would it make sense to let conversion and loc take a default? Maybe just loc="right" and conversion=1?
There was a problem hiding this comment.
Oh, hmm. I'd be OK w/ that....
lib/matplotlib/axes/_axes.py
Outdated
|
|
||
| Returns | ||
| ------- | ||
| ax : `~matplotlib.axes.Axes` (??) |
There was a problem hiding this comment.
Why is that axes private? If you include it as a public object you could directly refer to it as the return type.
There was a problem hiding this comment.
It wasn't meant to be private. I think the (??) was just because I wasn't sure that the ref was right... (sorry, this isn't a fully polished PR yet, just wanted to get feedback on the overall API)...
There was a problem hiding this comment.
I'm just wondering if having this as private object only would make it harder to customize, if needed.
There was a problem hiding this comment.
I'm not following what makes it private? Its not meant to be private...
There was a problem hiding this comment.
What is returned is a matplotlib.axes._secondary_axes.Secondary_Yaxis. So one would expect to see something like
Returns
-------
ax : `~matplotlib.axes._secondary_axes.Secondary_Yaxis`
right?
But that may not be possible due to _secondary_axes being "private" and not part of the documentation.
There was a problem hiding this comment.
Ah I see what you mean. I find this sort of thing very confusing. Somehow Axes is defined in a private sub module, and I think that’s what should be done here too. But I’m not clear on how the API bubbles up to be public.
|
I like this. It allows to get a second scale for a plot, without creating a totally new twin axes. Up to now people needed to use such twin axes in cases where they only wanted to have a different formatter on the right side or different colors etc. I'm currently not sure how would this behave in cases with set aspect. I.e. what if the parent has a specific aspect set? And more importantly, what if the user calls In general I think the documentation should point towards the differences between twinx and secondary_xaxis. |
Ooh, good point. I'm not sure either. I suspect issues ;-). I'll make it so the user will not have a |
OK, One could argue that the secondary axes might be able to set an aspect using its "units", but I think that'd be very hard to make work in general (i.e. w/ non-linear conversion between the axes), and I don't think its unreasonable to ask the user to specify the aspect ratio on the parent axes. The secondary axes is just a decoration, not meant to control the other axes. Similarly set_xlim doesn't work for the secondary axes... |
|
I only had a quick look at the code, but it seems to me that it only changes the limit of an secondary axis. Then, I guess the location of ticks will be correct only if the convert function is linear. If this is the case, allowing an arbitrary function may not be a good idea. |
|
That's a good point. So I guess the documentation needs to be very very clear about the fact that only because you use some arbitrary function, it does not mean that the axes itself is following this function. Instead one still needs to set some custom locator and formatter, or use a custom Or else, it would of course be cool to have this function manage this as well. In any case, in a next stage there will then need to be some example on how to produce a plot with e.g. frequency and wavelength correctly. |
Ooops, yes, thats correct. Shouldn't advertise something I didn't really make work. I imagine its possible to encompass non-linear transformations in the locator, but would have to look at it. Also, I supposes I"ve made no effort to link the xscale, so if I make the parent a logarithm, the secondary axes should be as well. That should be doable. |
|
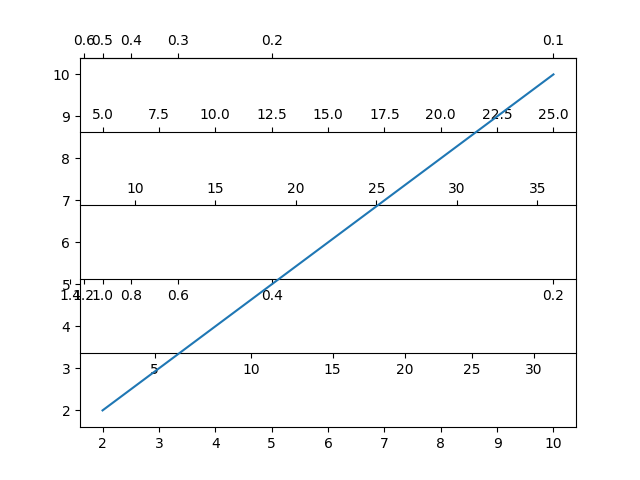
OK, that took a while, and needs a bit of an API discussion. What we need to do to make ticks be properly spaced is call For an API, I have the following options: import numpy as np
import matplotlib.pyplot as plt
from matplotlib.transforms import Transform
fig, ax = plt.subplots()
ax.plot(np.arange(2,11), np.arange(2,11))
class LocalInverted(Transform):
"""
Return a/x
"""
input_dims = 1
output_dims = 1
is_separable = True
has_inverse = True
def __init__(self, out_of_bounds='mask'):
Transform.__init__(self)
self._fac = 1.0
def transform_non_affine(self, values):
with np.errstate(divide="ignore", invalid="ignore"):
q = self._fac / values
return q
def inverted(self):
""" we are just our own inverse """
return LocalInverted(1 / self._fac)
axsecond = ax.secondary_xaxis(0.2, conversion='power', otherargs=(1.5, 1.))
axsecond = ax.secondary_xaxis(0.4, conversion='inverted', otherargs=2)
axsecond = ax.secondary_xaxis(0.6, conversion=[3.5, 1.])
axsecond = ax.secondary_xaxis(0.8, conversion=2.5)
axsecond = ax.secondary_xaxis(1.0, conversion=LocalInverted())
plt.show()The
|
5fd77c1
to
44d5f4a
Compare
b7c5a92
to
ac33b8a
Compare
f060392
to
dc81e88
Compare
|
Closing for now so I can sync between machines w/o triggering CI every time. This is close to working, but the transform structure needs some thought... |
|
(I hope I comment in the right place, if not please direct me to the right place) First, I have to say that I was quite excited when I saw this feature arriving in 3.1, because I always felt this was a bit hacky to implement using previous versions of matplotlib. For getting a secondary axis quick it is already nice. (a) Why do I need to supply a forward and backward transform? I assume there is a technical reason for it, but from a user perspective this makes not much sense to me. There are cases where I can define easily a forward transform, but not so easily a backward transform. In theses cases I have to define a grid and resort to linear interpolation for the forward and backward transformation, as shown in the "arbitrary transform" example. The question than arises, if the call to the secondary_axis as such could be made in a way, that if a user supplies only one transform, the backward transform is handled internally, e.g. via linear interpolation? (b) I was not able to get minor_ticks working, e.g. in the deg2rad example from the documentation I tried but that didn't work. |
|
@Knusper, can you open a new issue that outlines your concerns with minor ticks? Hopefully that is something straight forward. For forward/inverse transformations, you need to be able to go from plot space to data space in order to do the tick labelling, so the inverse is crucial. We appreciate the problem with coming up with an inverse, but hopefully you can appreciate the issue with us automatically making one for you - there is no guarantee that a transform is one-to-one, and hence the inverse may not be unique. So the user should supply the inverse to make the one-to-one mapping clear. Out of curiousity, what are you trying to map that doesn't have an inverse? |
|
For example transformations from vacuum wavelengths to air wavelengths. The inverse transformation will always be an approximation, since you require the refractive index as a function of vacuum wavelength. If you want to look at the mess you can check here: http://www.astro.uu.se/valdwiki/Air-to-vacuum%20conversion - maybe thats a very specific case... |
|
Gotcha, well, you definitely need the inverse, and for now we are probably going to keep it user-supplied. But if there is a PR that implemented doing it on our side, I'm sure it'd be considered. |
PR Summary
MOVED TO #11859 (sorry for the inconvenience)
New methods
ax.secondary_xaxisandax.secondary_yaxis; here the work is all in_secondary_axes.py, and a new method in_axes.py.Updated 15 Aug.
Feedback needed:
Any other use cases for a secondary axes? If so, let me know so I can test...
Notes
Closes #10976
Example placement:
yields:
Example inverted axes
Note that
conversion='power'andconversion='linear'are also possible...Arbitrary transforms...
... these need to have a definable inverse. Here the idea is that we have some data that maps one-to-one into the xaxis of the parent plot, and we'd like that mapping to be the xaxis of the secondary axis:
PR Checklist