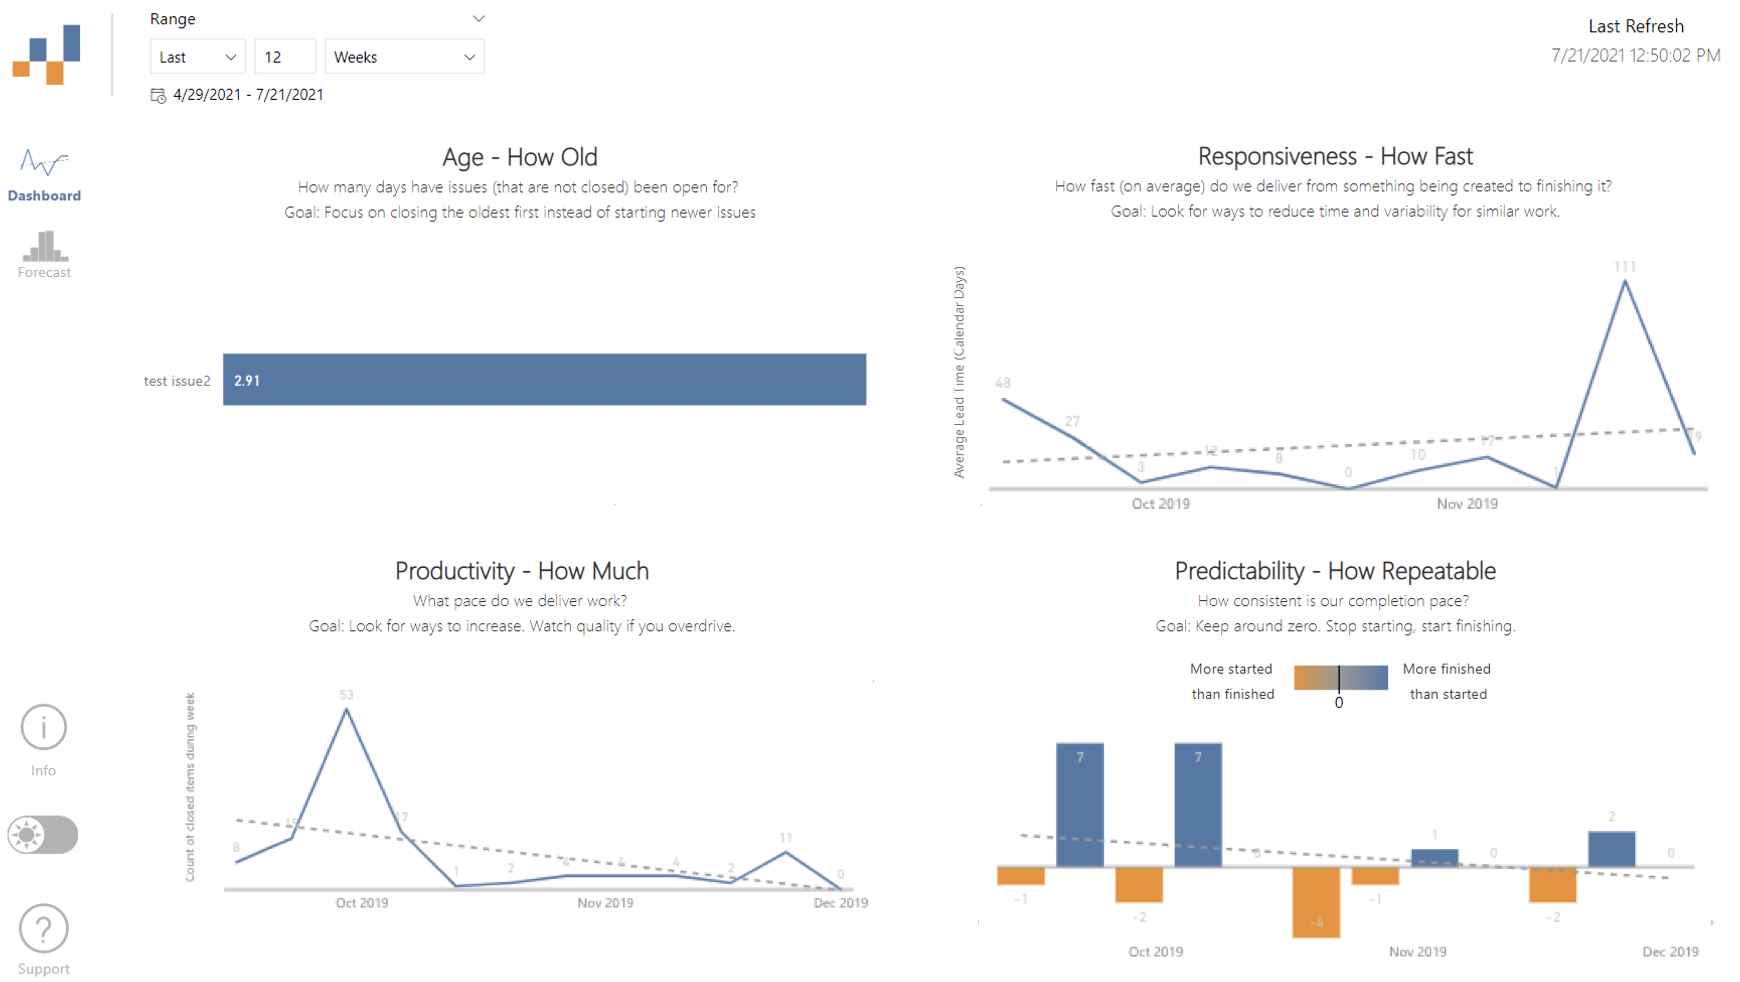
This dashboard is for all teams using GitHub for tracking issues, who want to leverage their data to have better conversations and make more informed decisions. It was built due to years of frustration with 'velocity' and other traditional agile metrics. These are centered on flow, as well as providing forecasting techniques you can use to give customers greater confidence/transparency in your delivery.
- Make sure you have the latest version of Power BI Desktop
- Download the template file
- Then you're good to get started!
- Open the .pbit file
- Enter the repository owner
- Enter the repository name
If the URL you use is "https://github.com/nbrown02/FlowViz", then nbrown02 is the Owner, FlowViz is the repository name.
- It should then look something like this:
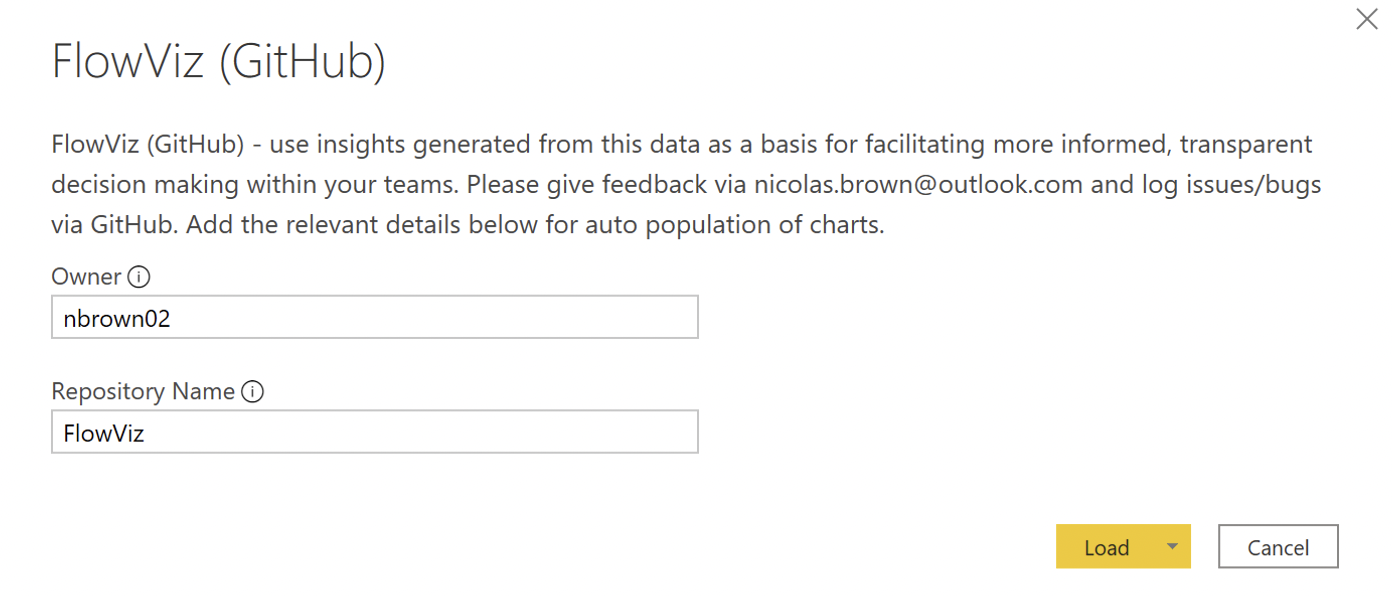
- Hit 'Load'
- If you are prompted for a login, enter your GitHub credentials to login:
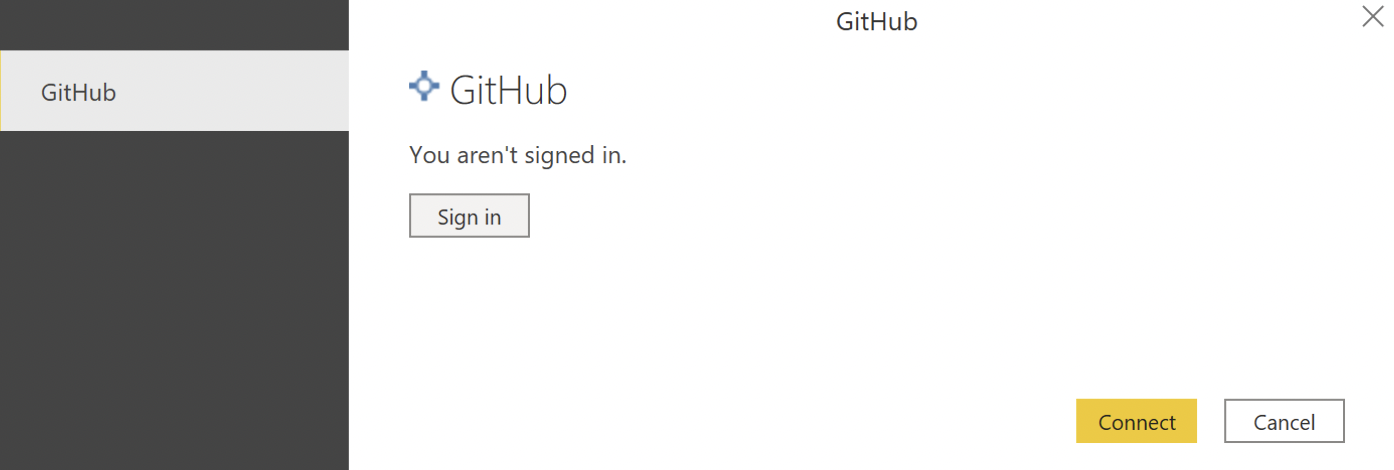
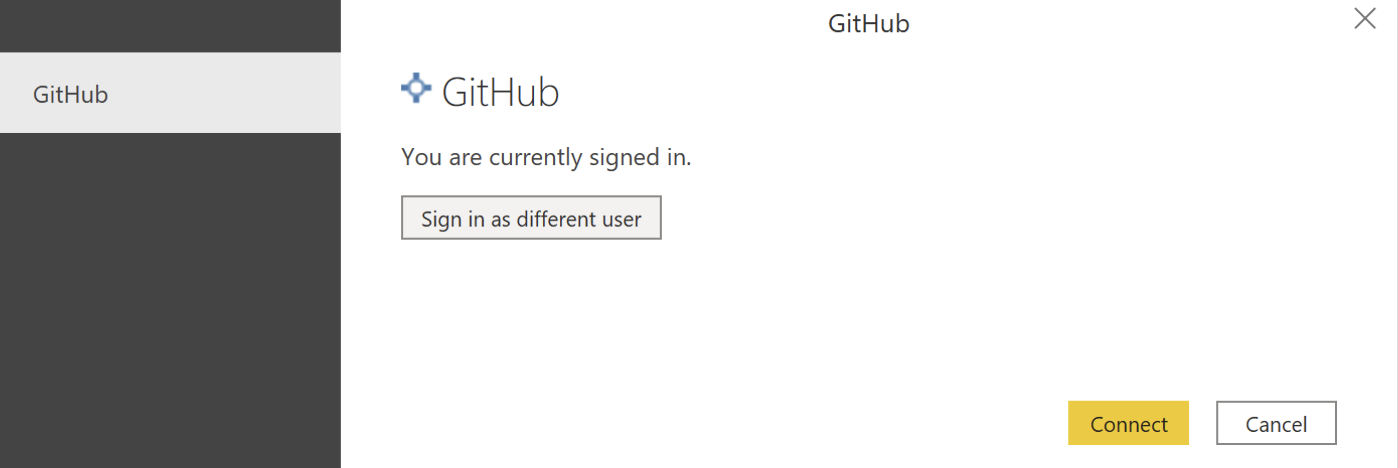
- Once signed in hit 'Connect' and wait for your charts to populate!
For questions on charts, how to use them and other questions check out the Wiki.
FlowViz was originally built for Azure DevOps (TFS/VSTS) and is built and maintained by Nicolas Brown.
Please email nicolas.brown@outlook.com for ideas, improvements and feedback.