Skip to content

Analyzed a database of 9 tables consisting of 100,000 transactions, reviews, and customer data using Microsoft SQL Server. SQL Also, created a tableau dashboard with quick/global filters and pie chart and density charts

Notifications You must be signed in to change notification settings

nnyase/SQL-data-analysis-ecommerce

Repository files navigation

SQL and Tableau analysis of the Olist Ecommerce.

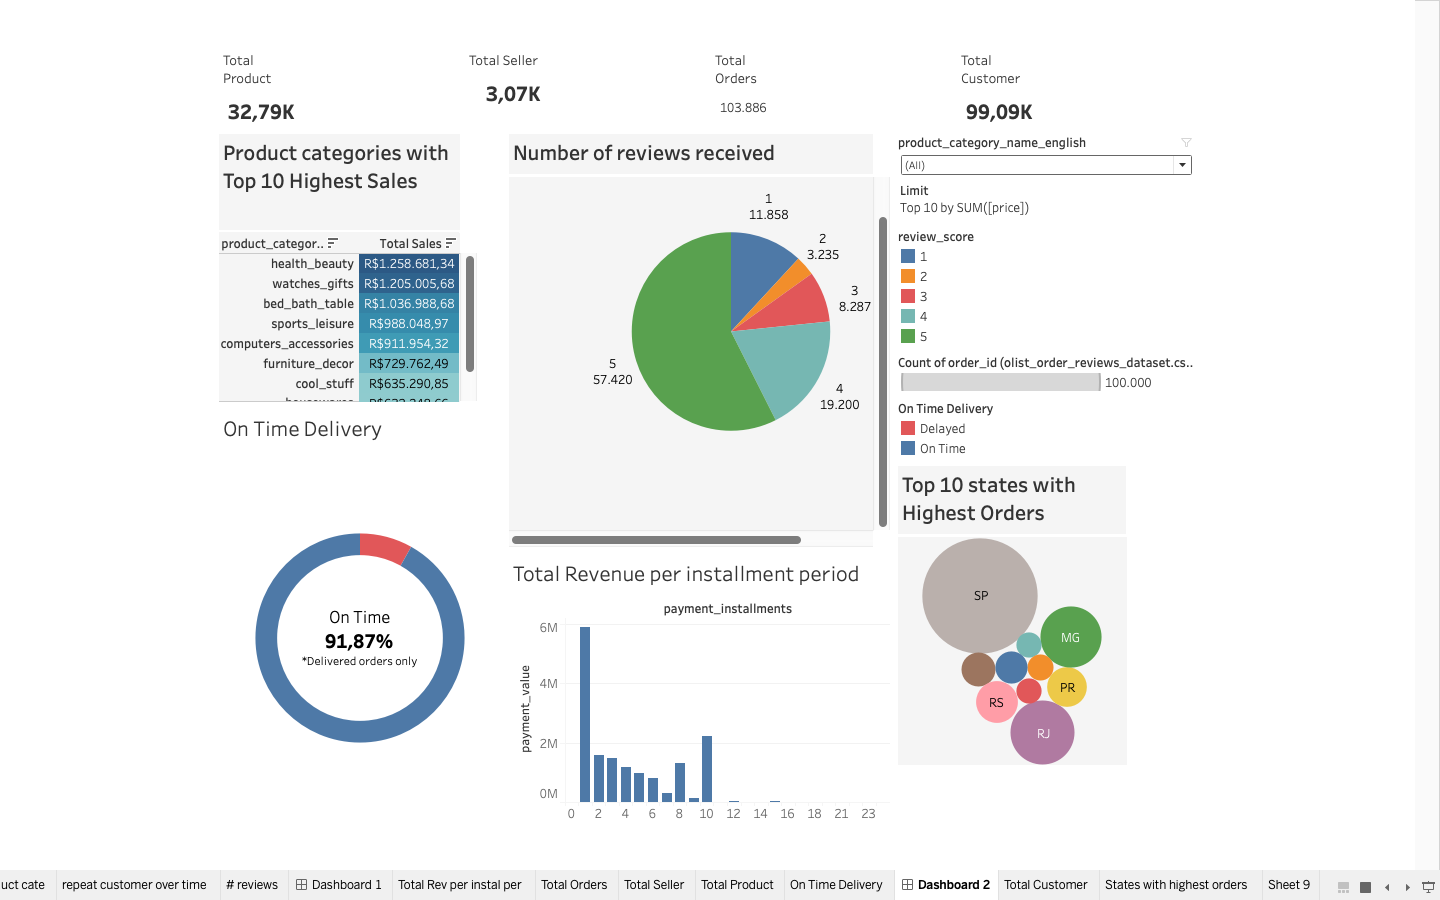
Analyzed a database of 9 tables consisting of 100,000 transactions, reviews, and customer data on the eCommerce platform, Olist.

Created a Tableau dashboard with quick/global filters.

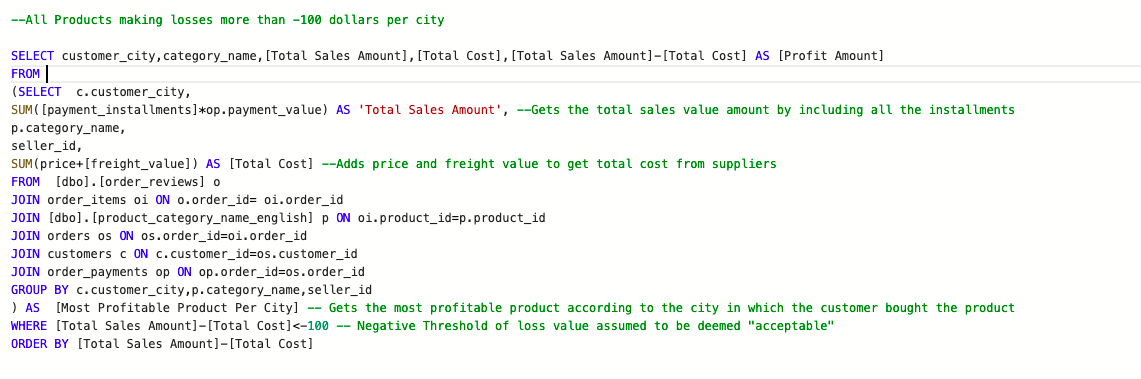
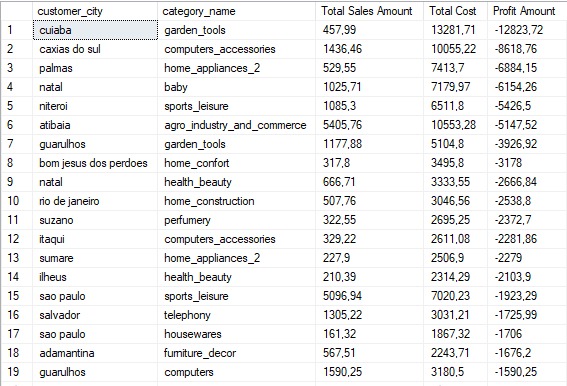
Analyzed the impact of product descriptions on sales, the impact of shipping heavy product categories to rural areas, and the impact of delivery time on review scores using Microsoft SQL Server.

Powerpoint Summary of insight and findings Powerpoint Summary

Tableau Dashboard

Look at OLIST data analysis.sql for all SQL queries SQL Queries

Example of Query and table

Insight 2; Managing profitable and unprofitable products.

Example of SQL query
Example of the table generated by the query

About

Analyzed a database of 9 tables consisting of 100,000 transactions, reviews, and customer data using Microsoft SQL Server. SQL Also, created a tableau dashboard with quick/global filters and pie chart and density charts

Topics

Resources

Stars

Watchers

Forks

Releases

No releases published

Packages


Languages