Cumulative Flow Analysis
The deft-cfd command visualises the history of a Deft tracker database as a Cumulative Flow Diagram (CFD)
.
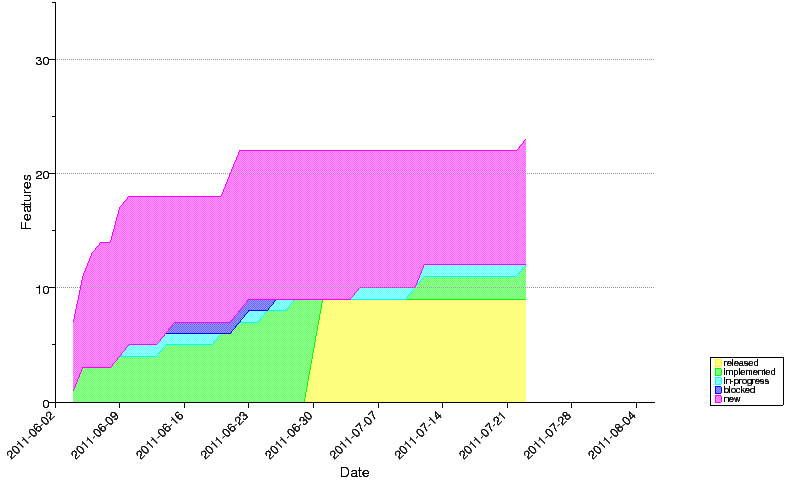
It can render the diagram in various graphical formats or output the underlying data to be fed into other tool such as Excel, OpenOffice or gnuplot.
Run deft-cfd --help for help on how to specify your project's flow and list all the supported output formats.
Note:
- graphical output is only available if PyChart is installed on your system. PyChart cannot be automagically downloaded from PyPI and so must be installed separately. (On Linux it is probably available through the system's package manager.)
- Currently deft-cfd can only read the database history from Git, but it should be straightforward to add support for other version control systems.