Skip to content

nrgapple/historic-country-borders-app

Folders and files

NameName
Last commit message
Last commit date

Latest commit

Β 

History

215 Commits
Β 
Β 
Β 
Β 
Β 
Β 
Β 
Β 
Β 
Β 
Β 
Β 
Β 
Β 
Β 
Β 
Β 
Β 
Β 
Β 
Β 
Β 
Β 
Β 
Β 
Β 
Β 
Β 
Β 
Β 
Β 
Β 
Β 
Β 
Β 
Β 
Β 
Β 
Β 
Β 
Β 
Β 
Β 
Β 
Β 
Β 
Β 
Β 
Β 
Β 
Β 
Β 
Β 
Β 
Β 
Β 
Β 
Β 
Β 
Β 
Β 
Β 
Β 
Β 
Β 
Β 
Β 
Β 
Β 
Β 
Β 
Β 

Repository files navigation

Visualize country borders from different times in history (2000 BC-1994)

As seen on r/dataisbeautiful.
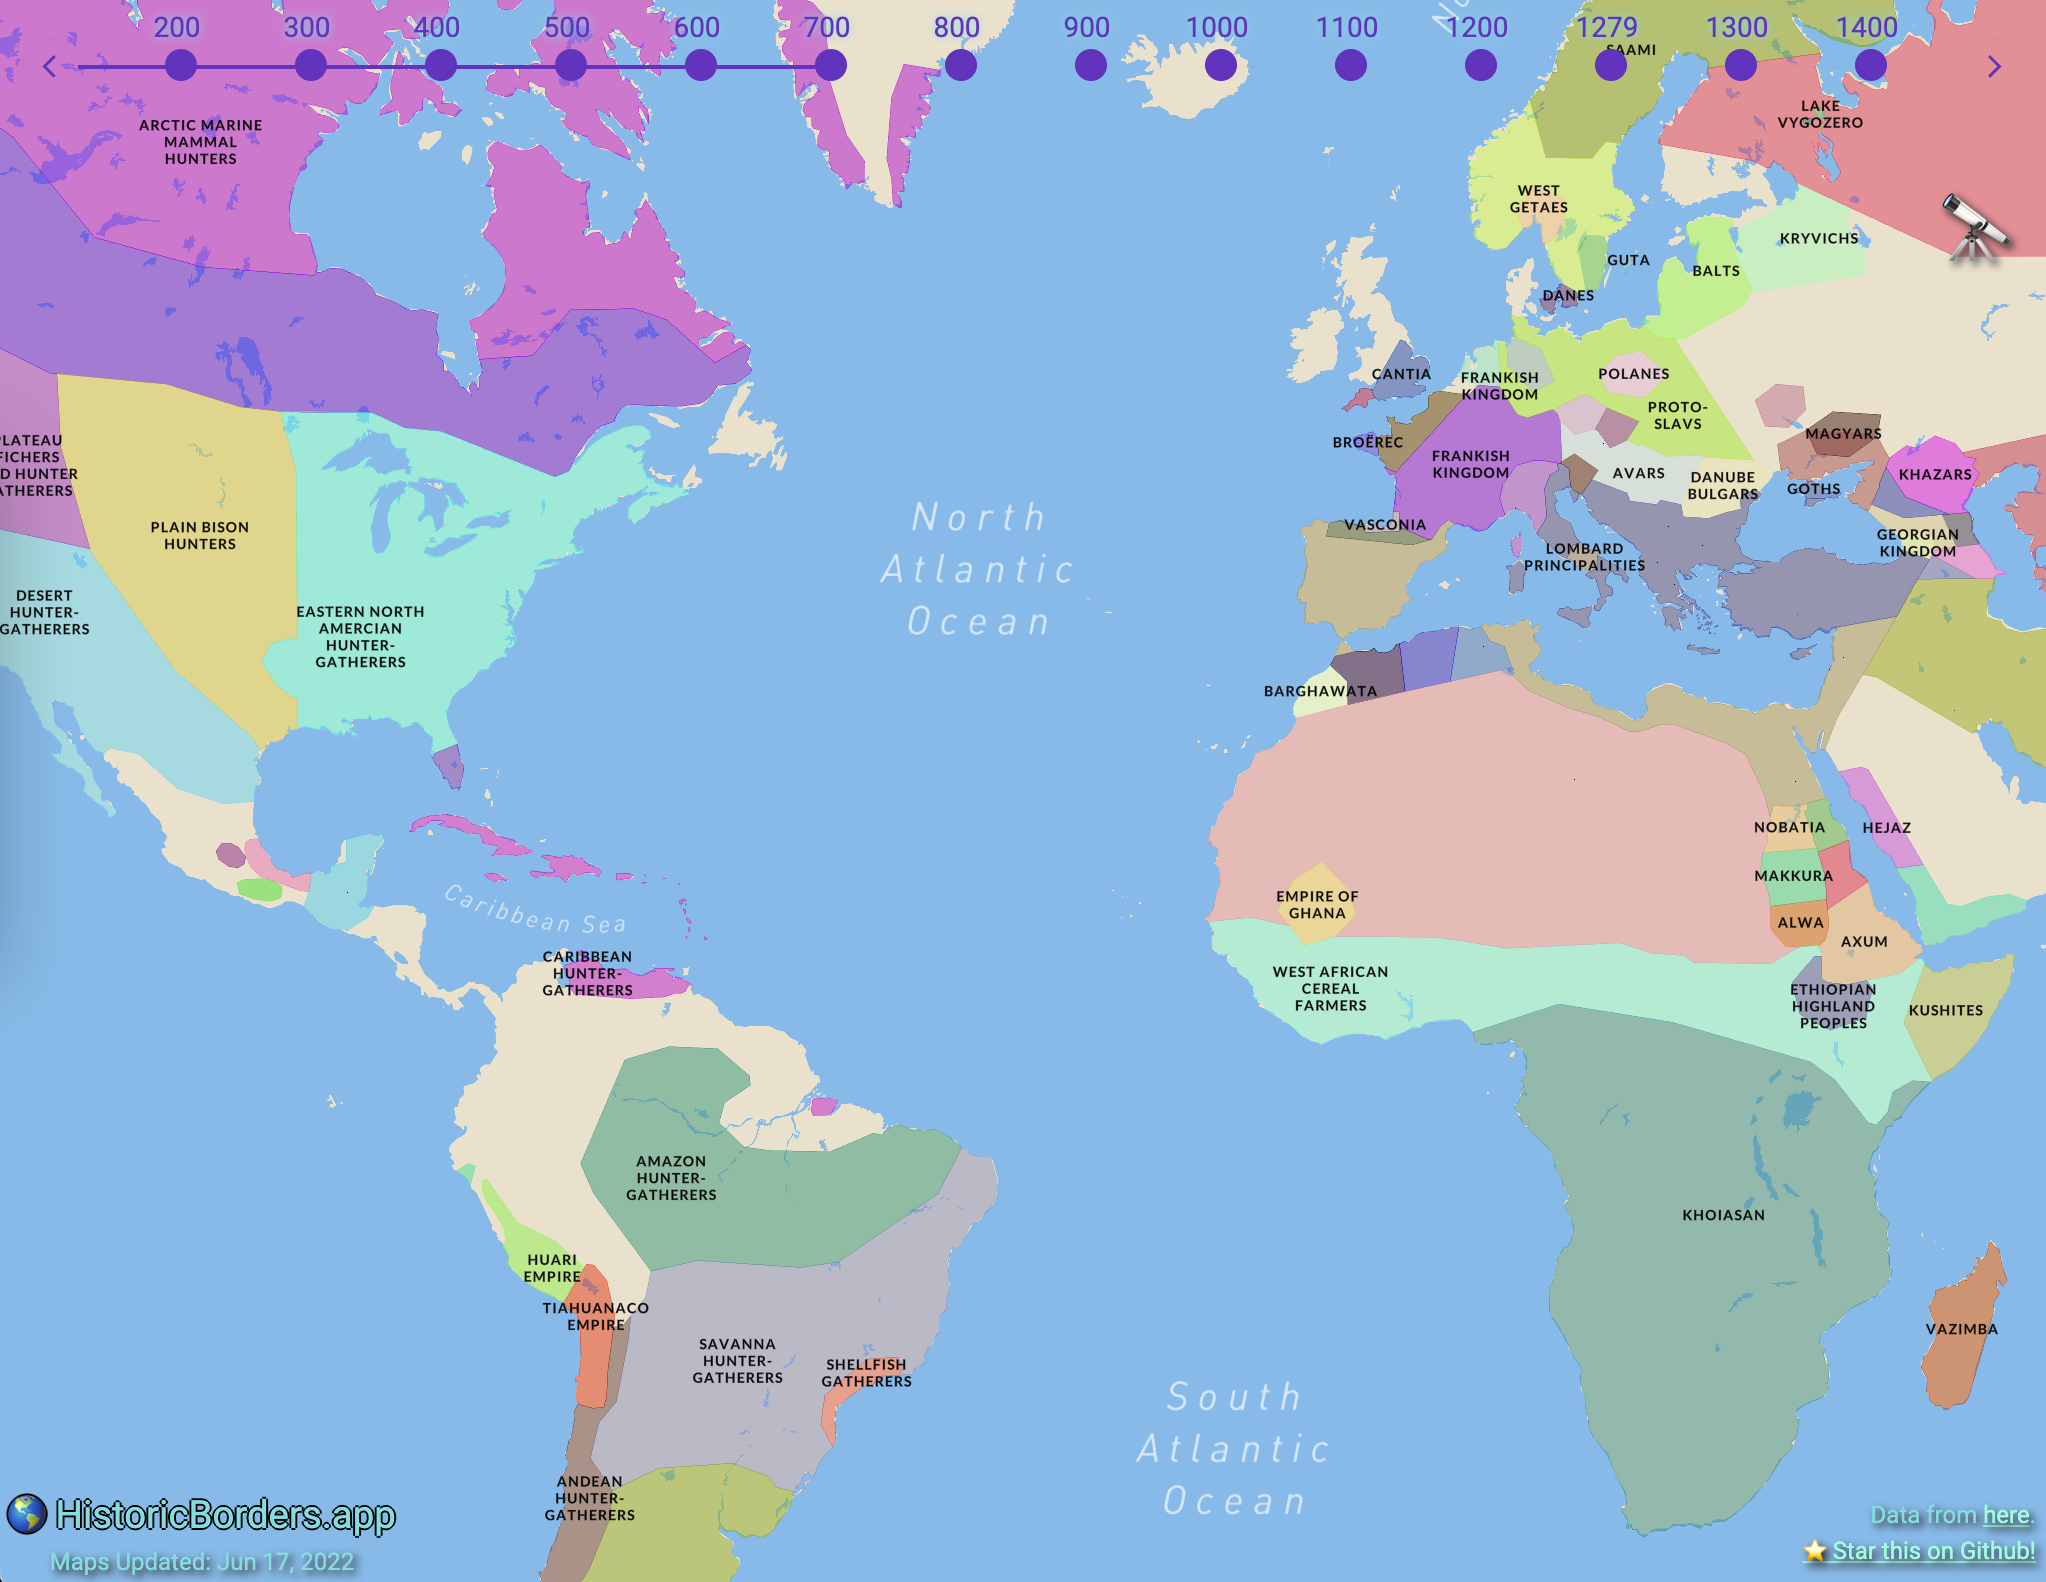
Screenshot

screen-shot-of-app

Features

Information Sources

The app provides country information through two sources:

  1. Wikipedia (default) - Fetches real-time information from Wikipedia
  2. AI-powered - Uses Google Gemini AI to generate country information with historical context

You can switch between these sources using the toggle button in the footer.

AI Response Caching

The app uses Redis to cache AI responses for improved performance:

  • ⚑ Instant responses for previously requested countries/years
  • πŸ’° Reduced API costs - Fewer calls to Google Gemini
  • πŸ”§ Smart expiration - 1-hour cache TTL keeps content fresh
  • πŸ“Š Analytics tracking - Cache hit/miss rates in Google Analytics

See REDIS_SETUP.md for detailed setup instructions.

AI Feature Analytics

The app includes comprehensive Google Analytics tracking for the AI feature to understand user engagement and performance:

Tracked Events

Provider Usage:

  • toggle_provider - When users switch between Wikipedia and AI
  • enable_ai / disable_ai - AI feature activation/deactivation
  • provider_restored - When preference is loaded from localStorage
  • session_provider_active - Active provider per session

AI Requests:

  • request_initiated - AI request started
  • response_success - Successful AI response
  • response_time_success - Response time for successful requests
  • response_length - Character count of AI responses
  • response_word_count - Word count of AI responses
  • request_failed - Failed AI requests
  • api_error - API-specific errors with status codes
  • api_key_missing - Missing API key events

Cache Performance:

  • cache_hit - Response served from Redis cache (faster)
  • cache_miss - No cached response, API call made
  • cache_error - Redis unavailable (fallback to API)
  • cache_write_success - Response successfully cached
  • cache_write_error - Failed to cache response

Content Display:

  • popup_displayed - When popups show AI vs Wikipedia content
  • content_displayed - Successful content display
  • content_error_displayed - Error content shown to users
  • content_empty_displayed - Empty/no content scenarios
  • popup_closed - User closes information popups

Performance Metrics:

  • Response times (success/failure)
  • Content quality metrics (word count, character count)
  • Error rates and types
  • User engagement patterns

Analytics Categories

All AI-related events use the category "AI Feature" for easy filtering in Google Analytics.

Data Privacy

Analytics tracking is anonymized and focuses on feature usage patterns rather than personal information. No API keys or sensitive data are tracked.

Setup

Prerequisites

  • Node.js 18+ and yarn
  • Google Gemini API key (free tier available)
  • Google Analytics 4 property (optional, for analytics)

Installation

git clone https://github.com/nrgapple/historic-country-borders-app.git
cd historic-country-borders-app
yarn install

Environment Variables

Create a .env.local file:

# Optional for analytics
NEXT_PUBLIC_GA_FOUR=your_google_analytics_id

# Optional for map features
NEXT_PUBLIC_MAPBOX_ACCESS_TOKEN=your_mapbox_token

# Redis for AI response caching (required for caching)
REDIS_URL=your_redis_connection_string

# Required for AI features (server-side only)
GEMINI_API_KEY=your_gemini_api_key_here

Getting API Keys

Google Gemini API (Free)

  1. Visit Google AI Studio
  2. Sign in with your Google account
  3. Click "Create API Key"
  4. Copy the generated key to your .env.local file

Benefits:

  • βœ… 60 requests per minute (generous free tier)
  • βœ… No credit card required
  • βœ… High-quality AI responses
  • βœ… Excellent historical knowledge

Vercel Redis for Caching (Optional but Recommended)

  1. Set up Redis on Vercel or any Redis provider
  2. Add the REDIS_URL environment variable to your project
  3. See REDIS_SETUP.md for detailed instructions

Benefits:

  • ⚑ Instant responses for cached content
  • πŸ’° Reduces API usage and costs
  • πŸ”§ Automatic 1-hour cache expiration
  • πŸ“Š Cache performance analytics

Google Analytics 4 (Optional)

  1. Visit Google Analytics
  2. Create a new GA4 property
  3. Get your Measurement ID (format: G-XXXXXXXXXX)
  4. Add to your .env.local file

Development

yarn dev

Open http://localhost:3000 to view the app.

Testing

# Run all tests
yarn test

# Run tests in watch mode
yarn test:watch

# Run specific test files
yarn test hooks/__tests__/useAI.test.tsx

AI Feature Troubleshooting

Common Issues

"AI information requires Gemini API key setup"

  • Add your Gemini API key to .env.local
  • Restart the development server
  • See GEMINI_SETUP.md for detailed setup

Slow AI responses

  • Normal response time: 1-3 seconds
  • Check your internet connection
  • Gemini API has rate limits (60 requests/minute)

Empty or error responses

  • Try switching to Wikipedia temporarily
  • Check browser console for detailed error messages
  • Verify your API key is valid

Analytics Dashboard

To view AI feature analytics in Google Analytics:

  1. Go to Events β†’ All Events
  2. Filter by Event Category = "AI Feature"
  3. Key metrics to monitor:
    • toggle_provider - Feature adoption
    • response_success vs request_failed - Success rate
    • response_time_success - Performance
    • content_displayed - User engagement

Performance Monitoring

The app tracks several performance metrics:

  • Response Times: Average AI response time vs Wikipedia
  • Success Rates: AI request success/failure ratios
  • Content Quality: Word count and length of AI responses
  • User Engagement: How users interact with AI vs Wikipedia content

Contributing

  1. Fork the repository
  2. Create a feature branch
  3. Make your changes
  4. Add tests for new functionality
  5. Ensure all tests pass
  6. Submit a pull request

License

MIT License - see LICENSE for details.

Acknowledgments

About

Visualize country borders from different times in history (2000 BC-1994)

Topics

Resources

License

Stars

Watchers

Forks

Contributors