Skip to content
New issue

Have a question about this project? Sign up for a free GitHub account to open an issue and contact its maintainers and the community.

By clicking “Sign up for GitHub”, you agree to our terms of service and privacy statement. We’ll occasionally send you account related emails.

Already on GitHub? Sign in to your account

signalfxexporter: Update exclude_metrics option to use dpfilters.MetricFilter #1951

Merged

Conversation

asuresh4
Copy link
Member

@asuresh4 asuresh4 commented Jan 6, 2021

Depends on #1950

Description: Update exclude_metrics config option to use dpfilters.MetricFilter. This is breaking change to exclude_metrics config option. Now, it takes slice of metric filters instead of just metric names (slice of strings).

Testing: Updated tests.

Documentation: Updated README.

Not included in this PR but subsequent changes I'm looking to make

  1. Add hard coded list of metrics to be excluded to omit non-default metrics
  2. Add an include_metrics options that will serve as an override to the exclude list. This will help to include metrics that are excluded by default.

@project-bot project-bot bot added this to In progress in Collector Jan 6, 2021
@asuresh4
Copy link
Member Author

asuresh4 commented Jan 6, 2021

cc @jrcamp

@asuresh4 asuresh4 changed the title @asuresh4 signalfxexporter: Update drop_metrics rule to use dpfilters.MetricFilter signalfxexporter: Update drop_metrics rule to use dpfilters.MetricFilter Jan 6, 2021
@codecov
Copy link

codecov bot commented Jan 6, 2021

Codecov Report

Merging #1951 (da4a21e) into master (ebd62bd) will increase coverage by 1.22%.
The diff coverage is 100.00%.

Impacted file tree graph

@@            Coverage Diff             @@
##           master    #1951      +/-   ##
==========================================
+ Coverage   89.15%   90.38%   +1.22%     
==========================================
  Files         393      393              
  Lines       19329    19409      +80     
==========================================
+ Hits        17233    17542     +309     
+ Misses       1641     1405     -236     
- Partials      455      462       +7     
Flag Coverage Δ
integration 69.79% <ø> (?)
unit 89.16% <100.00%> (+<0.01%) ⬆️

Flags with carried forward coverage won't be shown. Click here to find out more.

Impacted Files Coverage Δ
exporter/signalfxexporter/config.go 90.69% <ø> (ø)
exporter/signalfxexporter/factory.go 85.56% <ø> (-0.44%) ⬇️
...gnalfxexporter/translation/dpfilters/dimensions.go 100.00% <ø> (ø)
exporter/signalfxexporter/exporter.go 97.26% <100.00%> (+0.11%) ⬆️
exporter/signalfxexporter/translation/converter.go 95.85% <100.00%> (+0.17%) ⬆️
internal/common/testing/container/container.go 73.68% <0.00%> (ø)
processor/groupbytraceprocessor/event.go 96.80% <0.00%> (+0.79%) ⬆️
receiver/jmxreceiver/receiver.go 94.80% <0.00%> (+16.88%) ⬆️
receiver/dockerstatsreceiver/docker.go 92.30% <0.00%> (+39.05%) ⬆️
receiver/dockerstatsreceiver/receiver.go 96.72% <0.00%> (+47.54%) ⬆️
... and 5 more

Continue to review full report at Codecov.

Legend - Click here to learn more
Δ = absolute <relative> (impact), ø = not affected, ? = missing data
Powered by Codecov. Last update ebd62bd...da4a21e. Read the comment docs.


type dataPointFilter struct {
metricFilter *stringFilter
dimensionsFilter *dimensionsFilter
Copy link
Contributor

Choose a reason for hiding this comment

The reason will be displayed to describe this comment to others. Learn more.

Are these pointers for performance reasons?

Copy link
Member Author

Choose a reason for hiding this comment

The reason will be displayed to describe this comment to others. Learn more.

Not really. I guess I just started out with them. Would you advocate for one vs the other?

@asuresh4 asuresh4 force-pushed the sfxexporter-use-dp-filters branch 3 times, most recently from 9169c99 to 8e6ee68 Compare January 15, 2021 02:52
@asuresh4 asuresh4 changed the title signalfxexporter: Update drop_metrics rule to use dpfilters.MetricFilter signalfxexporter: Update exclude_metrics option to use dpfilters.MetricFilter Jan 15, 2021
@asuresh4 asuresh4 force-pushed the sfxexporter-use-dp-filters branch 2 times, most recently from c059d51 to 9bc9bc4 Compare January 15, 2021 03:58
…icFilter

This is breaking change to exclude_metrics config option. Now, it takes metric filters
instead of just metric names.
@asuresh4 asuresh4 marked this pull request as ready for review January 15, 2021 15:19
@asuresh4 asuresh4 requested a review from a team as a code owner January 15, 2021 15:19
Copy link
Contributor

@jrcamp jrcamp left a comment

Choose a reason for hiding this comment

The reason will be displayed to describe this comment to others. Learn more.

lgtm

dimension_key: dimension_val
- metric_name: metric5
dimensions:
dimension_key: [dimension_val1, dimension_val2]
Copy link
Contributor

Choose a reason for hiding this comment

The reason will be displayed to describe this comment to others. Learn more.

This supports /regex/ and glob.* form too right? Should probably document/give examples those.

Copy link
Member Author

Choose a reason for hiding this comment

The reason will be displayed to describe this comment to others. Learn more.

That's a good point. Added a few examples.

@jrcamp jrcamp assigned jrcamp and unassigned jpkrohling Jan 15, 2021
Collector automation moved this from In progress to Reviewer approved Jan 19, 2021
@tigrannajaryan tigrannajaryan merged commit e21d79b into open-telemetry:master Jan 19, 2021
Collector automation moved this from Reviewer approved to Done Jan 19, 2021
dyladan referenced this pull request in dynatrace-oss-contrib/opentelemetry-collector-contrib Jan 29, 2021
Adds a `send_timestamps` option to the prometheus exporter to allow it to send scrape timestamps.

By default, when scraping, Prometheus records data assuming that the presented sample is at the instant of the scrape. For data sources that cache the underlying information and do not refresh on scrape, this can lead to metric samples being recorded at the wrong timestamp. For ex, cadvisor caches for many seconds (4-20 in our experience), and so a sample taken "now" may actually be a sample from 20s ago.

To handle this situation, the exposition format allows an exporter to advise the Prometheus server of the timestamp of the underlying scrape. OpenTelemetry is aware of the timestamp of the scrape.

This change adds an option to have OpenTelemetry send the timestamps of underlying samples out with the Prometheus exporter.

Visually, the image shows existing behavior prior to 9.45am and with `send_timestamps: true` set from 9.45am onwards. This is metrics for a job using a single CPU.
![image](https://user-images.githubusercontent.com/3196528/95892425-62fe5a00-0d3b-11eb-9023-af8e59652157.png)

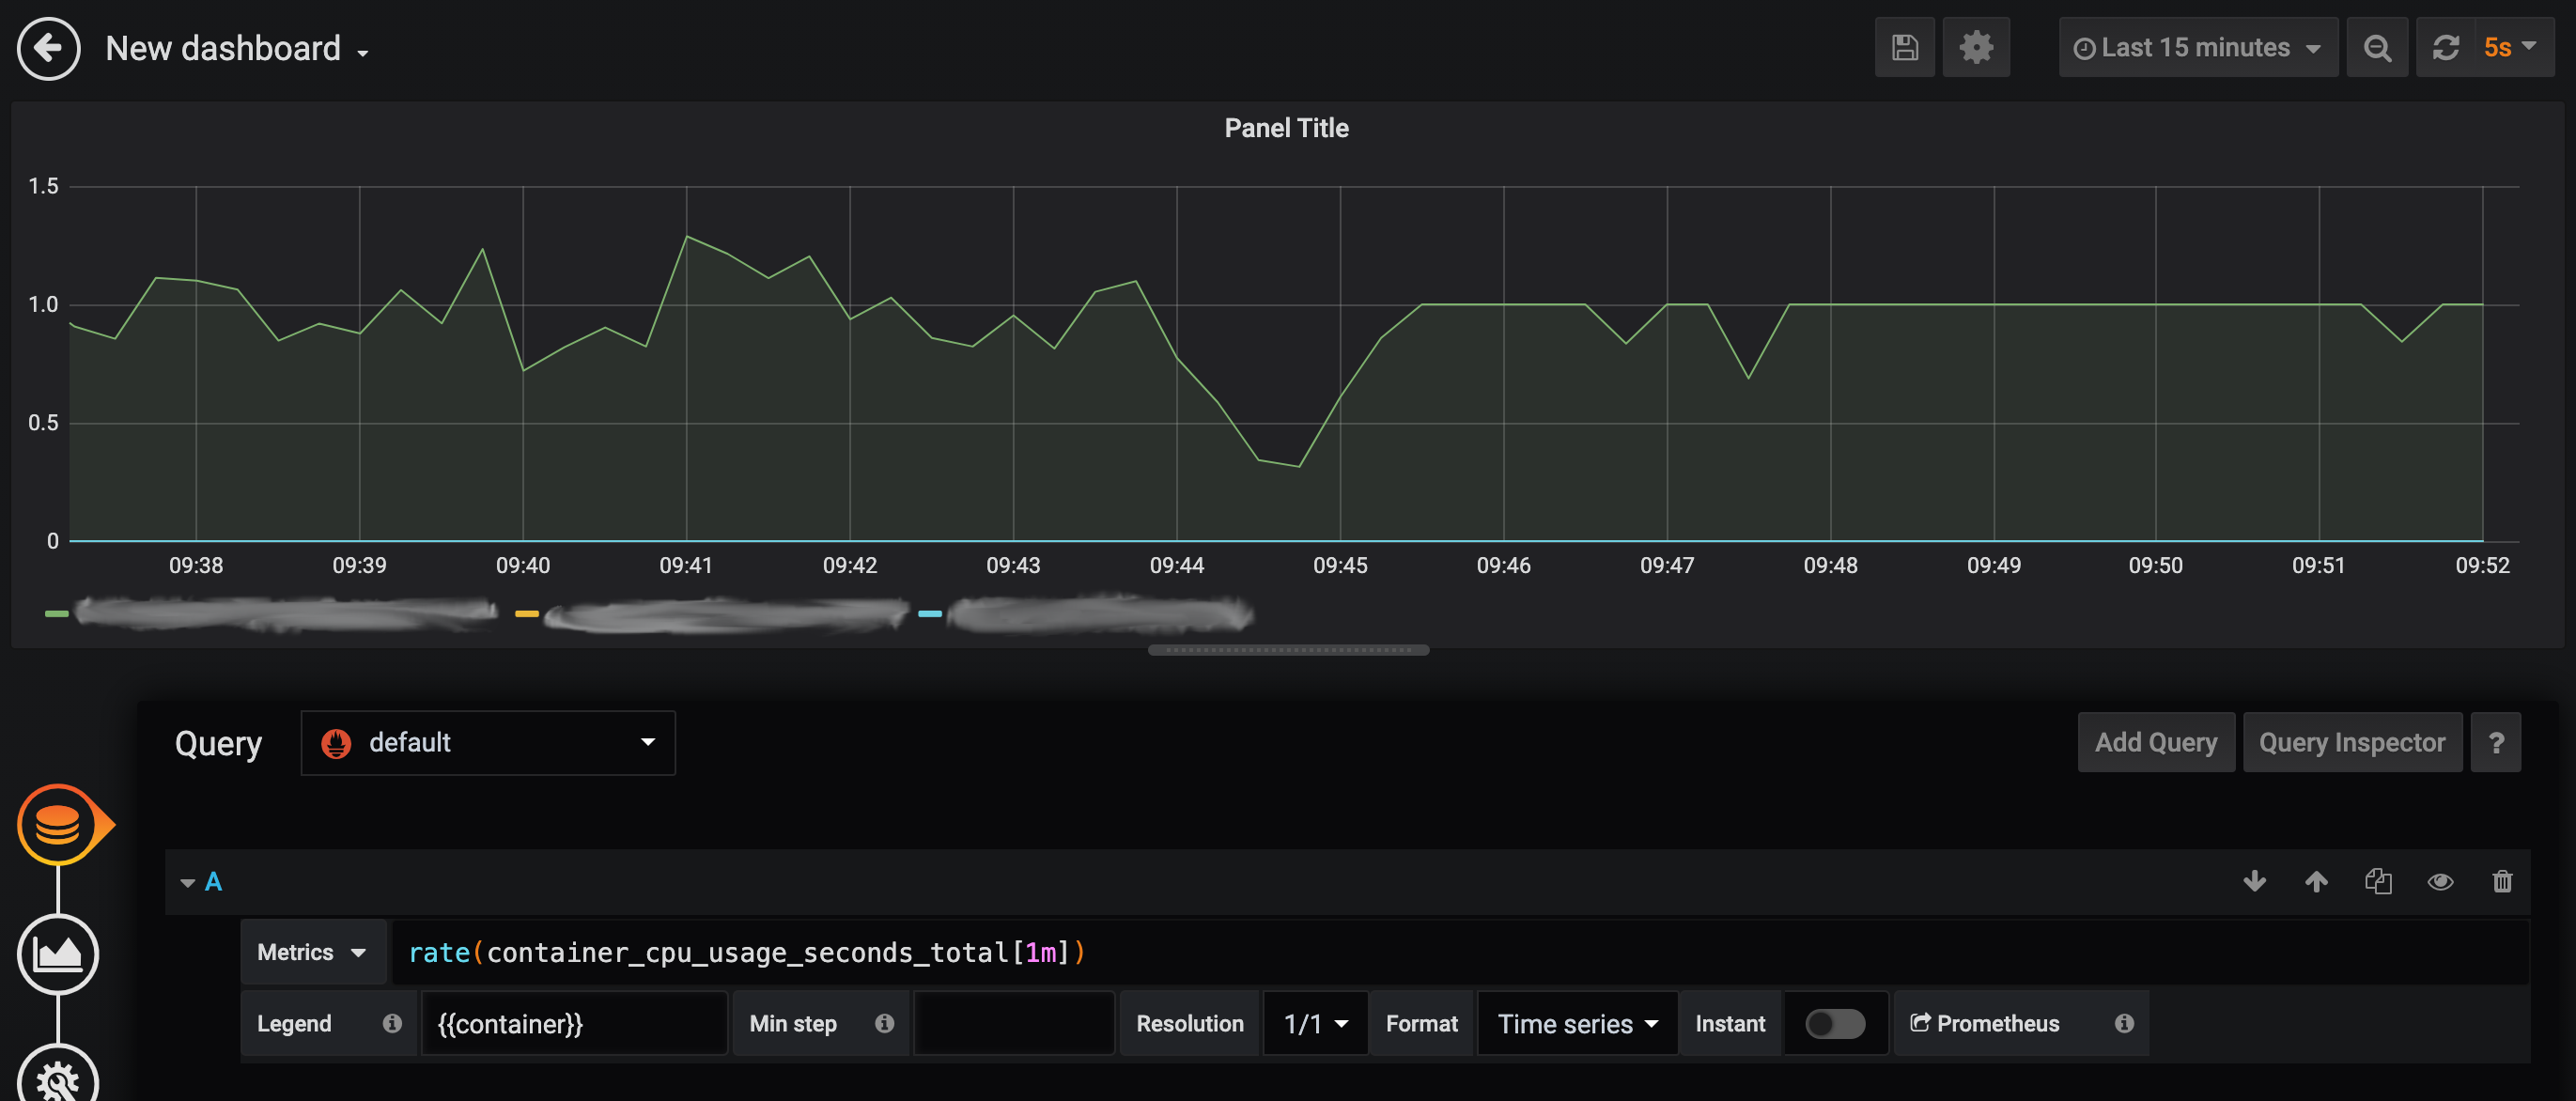
**Related issues:**
google/cadvisor#2526
orijtech/prometheus-go-metrics-exporter#11

**Testing:**
Test cases have been added. In addition, for e2e test, see screenshot from our environment above.

**Documentation:**
The `prometheusexporter` README has been updated.
Sign up for free to join this conversation on GitHub. Already have an account? Sign in to comment
Labels
None yet
Projects
No open projects
Collector
  
Done
Development

Successfully merging this pull request may close these issues.

None yet

5 participants