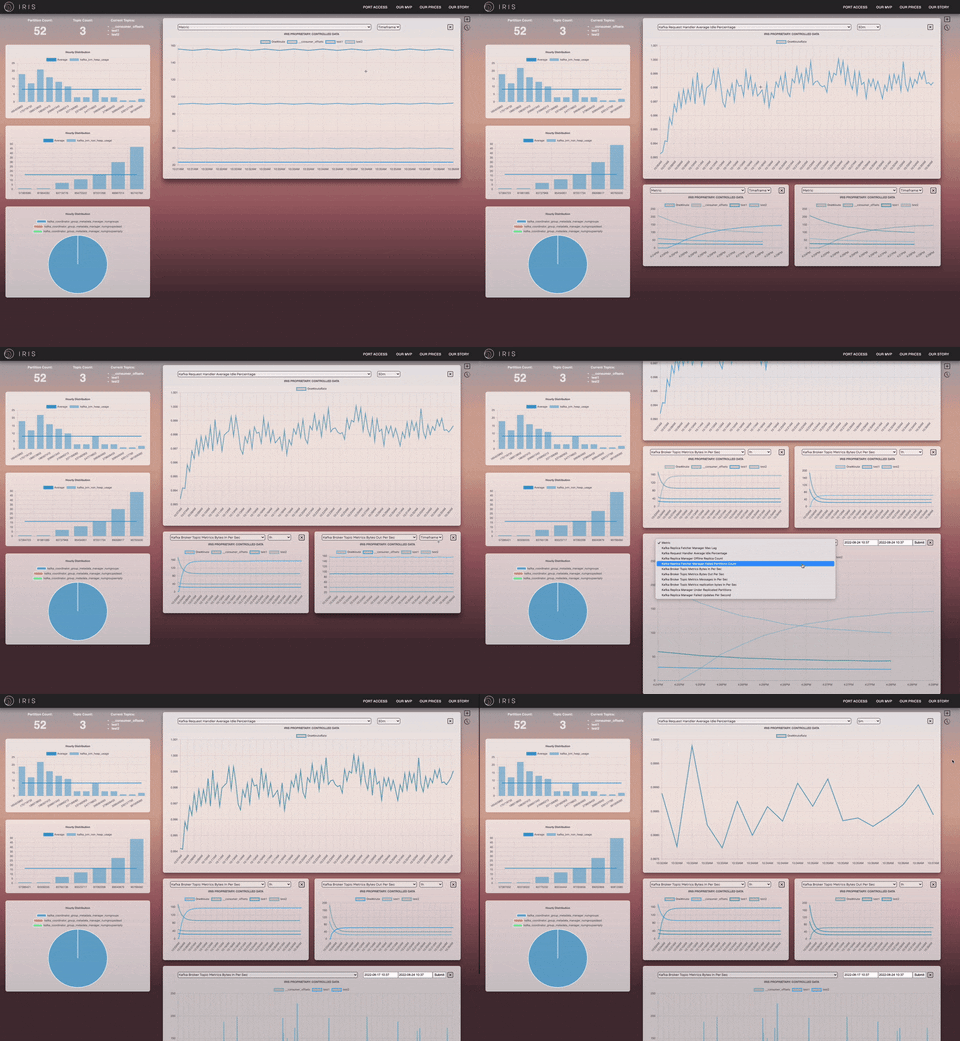
Apache Kafka is an event-driven data streaming platform that stores and brokers sensitive information with high data throughput and fault tolerance. Broker clusters require health monitoring to better inform partitioning, replication, data persistence and other intricate Kafka maintenance processes. Iris offers a dynamic solution to observe your Kafka platform in real time, compare against historically logged data and ensures your broker does not throttle user experience.
Iris provides a containerized Docker environment with a highly configurable Kafka container. There are two separate docker-compose files: one for the Kafka/Zookeeper environment and the other for the JMX-Exporter/Prometheus environment. Please see the docker-compose-kafka.yml if you wish to configure your broker. In order to run Iris properly, you will need to run both files.
-
Install Docker: https://docs.docker.com/get-docker/
-
Fork the repo from the
mainbranch -
Run the command:
npm install- Open Docker and check Images tab, it should include the following Docker images to run the container environments. If not, please install the latest images:
docker pull- Once Docker has been booted up, run the following two commands in separate terminals. Please allow the Kafka container to fully boot and stabilize before running the JMX and Prometheus containers. Not waiting for the Kafka container to fully boot up may result in JMX failing to identify and scrape the exposed Kafka ports. You can view the Kafka containers in either the terminal or your Docker Desktop logs.
docker compose -f docker-compose.kafka.yml updocker compose -f docker-compose.scrape.yml up-
Now that the Kafka broker is running and the ports are being scraped properly, run your Kafka dependent program across the broker to begin streaming your data. You may refer to the provided files in the
kafkaTestfolder for reference. Ports are accessing the Kafka broker onlocalhost:9092 -
To start the application and begin viewing your broker's health, in another terminal, run command:
npm run dev- The application will load onto
localhost:8080where you can browse your incoming metrics.
- On the left pane, there are persistent histograms and piecharts.
- On the right pane, you can add line charts with different metrics.
- You can configure the
MetricandTime Frameof each chart individually generated in the right pane.
-
Click on the
+button in the upper right hand corner to add additional line charts. -
Click on the
Xbutton on each line chart container to delete each chart. -
Click on the
clockbutton underneath the+in the upper right hand corner to view historical data at a specific time interval. Data is logged on a 15 sec interval to an AWS RDS SQL database.
-
On load, the default PORT is
localhost:9090 -
Click on
PORT ACCESSSon the Navigation Bar to switch to a different port
-
Port numbers and passwords are hard coded into a MongoDB database.
-
If you'd like to add additional port number and passwords, use Postman to make a
POSTrequest to'/createPort'with keysportandpasswordin therequest body. -
You should receive a positive response of the MongoDB document with the newly created
portand hashedpasswordin the response. -
If you receive a
nullresponse, theportalready exists in the database.
-
To view a list of raw JMX metrics and data :
localhost:5556/metrics -
To view Prometheus :
localhost:9090 -
To view a list of available metrics:
http://localhost:9090/api/v1/label/__name__/values -
In order to query different Prometheus end points, follow the syntax :
http://localhost:9090/api/v1/query?query={Enter the Metric Name}[{TimeRange}].
- For example:
http://localhost:9090/api/v1/query?query=kafka_server_broker_topic_metrics_messagesinpersec_rate[1h]
We provide an end to end Kafka producer and consumer to measure the stability of the Iris health monitor. The Producer and Consumer files in the kafkaTest folder contain message files streamed to the Kafka Broker using AVRO schema and KafkaJS.
- In one terminal, run the command:
npm run start:producer- In a separate terminal, run the command:
npm run start:consumerNow you should be passing messages across your Kafka Broker.
If you have recommendations on how to improve Iris, please fork this repo and make a pull request.


