Load GPS data from GPX files into Python as a numpy arrays and pandas DataFrames. Initial parsing done using the gpxpy package. Trajectory plotting on a map available using mplleaflet.
pip install gpxoimport gpxo
track = gpxo.Track('ExampleTrack.gpx')(it is possible to indicate which track or segment to consider during instantiation, by default it is the first one).
track.data is a pandas DataFrame containing time, position, elevation etc.; usual pandas methods can be used to analyze, manipulate and plot data. Individual columns are also available as numpy arrays as attributes of the class (see below).
Load, inspect and plot GPX data using the Track class, with the following methods and attributes.
smooth(): smooth position and elevation data (seegpxo.smooth()below),plot(): plot trajectory data using a combination of shortnames (see shortnames below); also takesmatplotlib.pyplot.plot()arguments/kwargs,map(): plot trajectory on a map, usingmplleaflet.show(),closest_to(): find index of point in trajectory closest to a (lat, long) point.
(some may not be available depending on actual data present in the GPX file)
latitude(numpy array): latitude in °,longitude(numpy array): longitude in °,elevation(numpy array): elevation in meters,time(numpy array): local time expressed as a datetime.datetime.
(Read-only, and calculated/updated from basic attributes; some may not be available depending on actual data present in the GPX file)
seconds(numpy array): total number of seconds since beginning of track,distance(numpy array): total distance (km) since beginning of track,velocity(numpy array): instantaneous velocity (km/h),compass(numpy array): instantaneous compass bearing (°),data(pandas DataFrame): all above attributes in a single dataframe.
Outside of the Track class, the following standalone function is also available:
compass(pt1, pt2): compass bearing (°) between pt1 (lat1, long1) and pt2 (lat2, long2),closest_pt(pt, trajectory): index of closest pt in trajectory (latitudes, longitudes) to specified pt (lat, long),smooth(x, n, window): smooth 1-d array with a moving window of size n and type window.
| Short name | Corresponding data |
|---|---|
| t | time |
| s | duration (s) |
| d | distance (km) |
| v | velocity (km/h) |
| z | elevation (m) |
| c | compass (°) |
See Jupyter Notebook Examples.ipynb (https://github.com/ovinc/gpxo/blob/master/Examples.ipynb) for a detailed example using real GPX data.
Quick example: show the path of a GPX file on a map with color-coding corresponding to elevation:
import gpxo
track = gpxo.Track('ExampleTrack.gpx')
track.map(plot='scatter', c=track.elevation, cmap='plasma')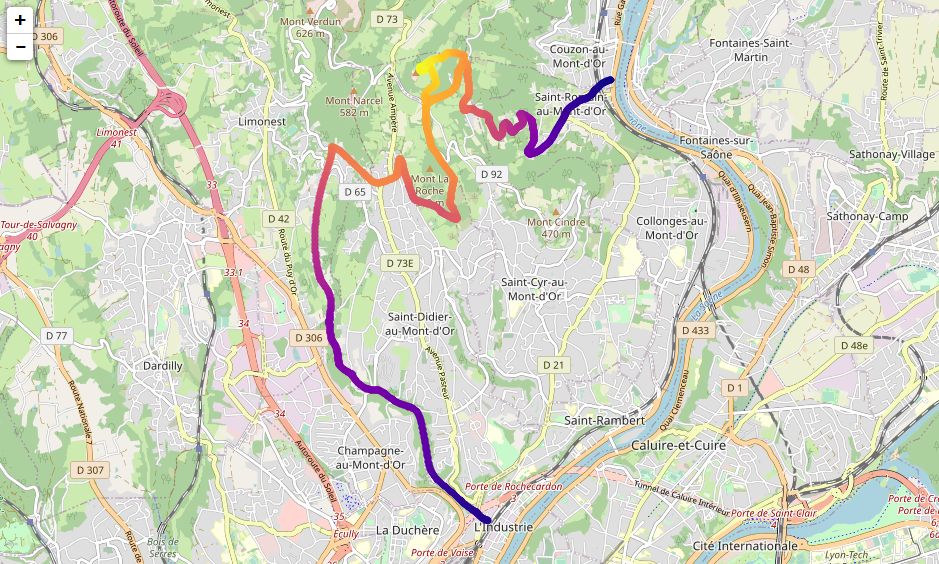
In case of the following error:
'XAxis' object has no attribute '_gridOnMajor
when using the map() method, try downgrading Matplotlib to version <= 3.3.2 or install a forked version of mplleaflet (see jwass/mplleaflet#75).
Python >= 3.6
(automatically installed by pip if necessary)
- numpy
- pandas
- matplotlib
- importlib-metadata
- gpxpy (https://github.com/tkrajina/gpxpy)
- vincenty (https://github.com/maurycyp/vincenty)
- mplleaflet (https://github.com/jwass/mplleaflet)
Olivier Vincent
BSD 3-Clause (see LICENCE file)