Course Metrics Roadmap
All the below metrics will only be available to the Teacher Profession Development (PD) courses for the first round. Then we will roll it out to the other organizers after Milestone 1.4.
-
Table: Publicly accessible data (edits, comments); Course organizer can view (Just Karen for first round)
-
Tracking: Tracking code in place for next part
-
Note: Dates are shown as whenever the first activity we have is. This means it could be before and after the end of the course's run.
- Table: Add last login date and minutes logged in.
- CSV: Add above now available data to do "min. on page."; Add non-logged in users' activity
- CSV: Participants and followers plus above data; Pages are listed as url; Added views since minutes logged in could be 0; Only Karen can see
- Graphs: Add activity graphs.
- Evaluate roll-out to other courses, including showing anonymized versions for participants.
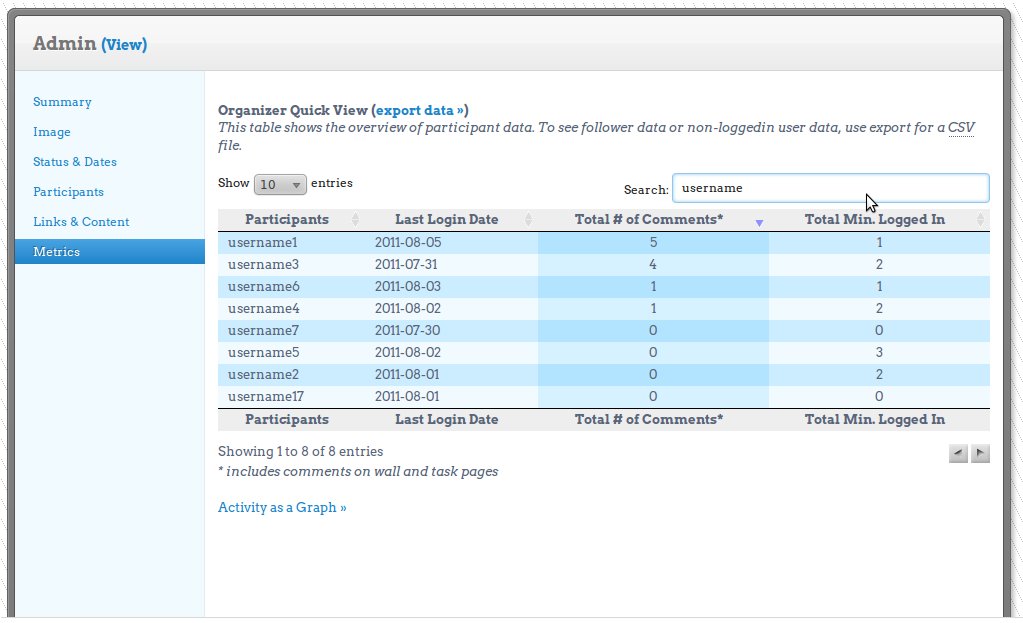
"Organizer Quick View" table has features like you can type in something in "Search" and it will filter the data. This might be useful to quickly see all the participants with "jo" in their name because you can't remember the full username. Or maybe just want to see everyone that logged in on a certain date. The column that's sorted is highlighted with a different color as shown below.

What is being tracked: course (apps/content) pages
Not important: activity page, description, sign up

1: Can download this graph as a graphic. This will come in handy when the graphs get too big for the real estate available or for inclusion in presentations/reports.
2: When mousing over points on the chart, hint text pops up with more information. The line in this is an average of the 3 participants.
3: Specifically for this chart, I was trying to show the "health" of the course.
Overall: This chart, and others, could become difficult to use with a lot of students in the course. But I can stretch it out so that you can scroll over to see it all or have a sort of zoom in feature so you can see the overall lines and zoom in on certain areas.
Activities listed right now are: comments, task edits, participants' last log in time, and how many tasks were added. We can add page views in phase 2. We could also have a running "total" showing as well. Requested was the ability to see by day, week, and total. Also, I can give this as a table.
Here we have a "total" for the day plus what each person did to contribute to this total. There would be a chart like this for all activity types so that you can see per day and total. This one is from the view of a non-organizer. The participants' names are not shown but the logged in user will be able to see his or her own place compared to others. If the viewer is an organizer, then he or she can see all names.


