Chart::Plotly - Generate html/javascript charts from perl data using javascript library plotly.js
version 0.042
use Chart::Plotly 'show_plot';

my $data = { x    => [ 1 .. 10 ],
             mode => 'markers',
             type => 'scatter'
};
$data->{'y'} = [ map { rand 10 } @{ $data->{'x'} } ];

show_plot([$data]);

use aliased 'Chart::Plotly::Trace::Scattergl';

my $big_array = [ 1 .. 10000 ];
my $scattergl = Scattergl->new( x => $big_array, y => [ map { rand 100 } @$big_array ] );

show_plot([$scattergl]);

use Chart::Plotly qw(show_plot);
use PDL;

use aliased 'Chart::Plotly::Trace::Surface';

my $size = 25;
my $x    = ( xvals zeroes $size+ 1, $size + 1 ) / $size;
my $y    = ( yvals zeroes $size+ 1, $size + 1 ) / $size;
my $z    = 0.5 + 0.5 * ( sin( $x * 6.3 ) * sin( $y * 6.3 ) )**3;    # Bumps

my $surface = Surface->new( x => $x, y => $y, z => $z );

show_plot([$surface]);

use PDL::Math;

my $bessel_size = 50;
my $bessel      = Surface->new(
    x => xvals($bessel_size),
    y => xvals($bessel_size),
    z => bessj0( rvals( zeroes( $bessel_size, $bessel_size ) ) / 2 )
);

show_plot([$bessel]);Generate html/javascript charts from perl data using javascript library plotly.js. The result is a file that you could see in your favourite browser.

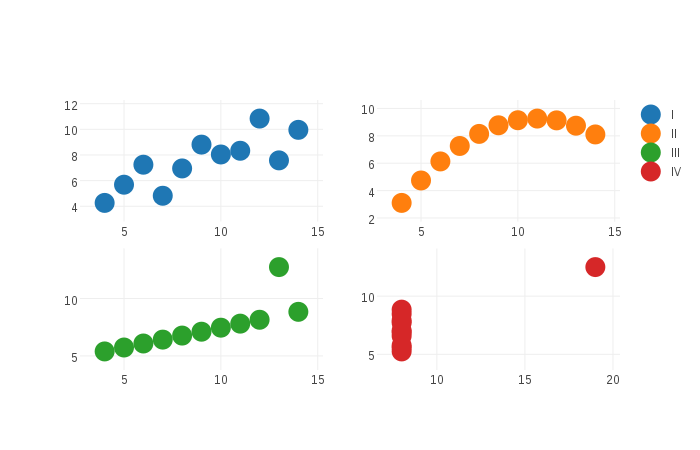
Example screenshot of plot generated with examples/anscombe.pl:
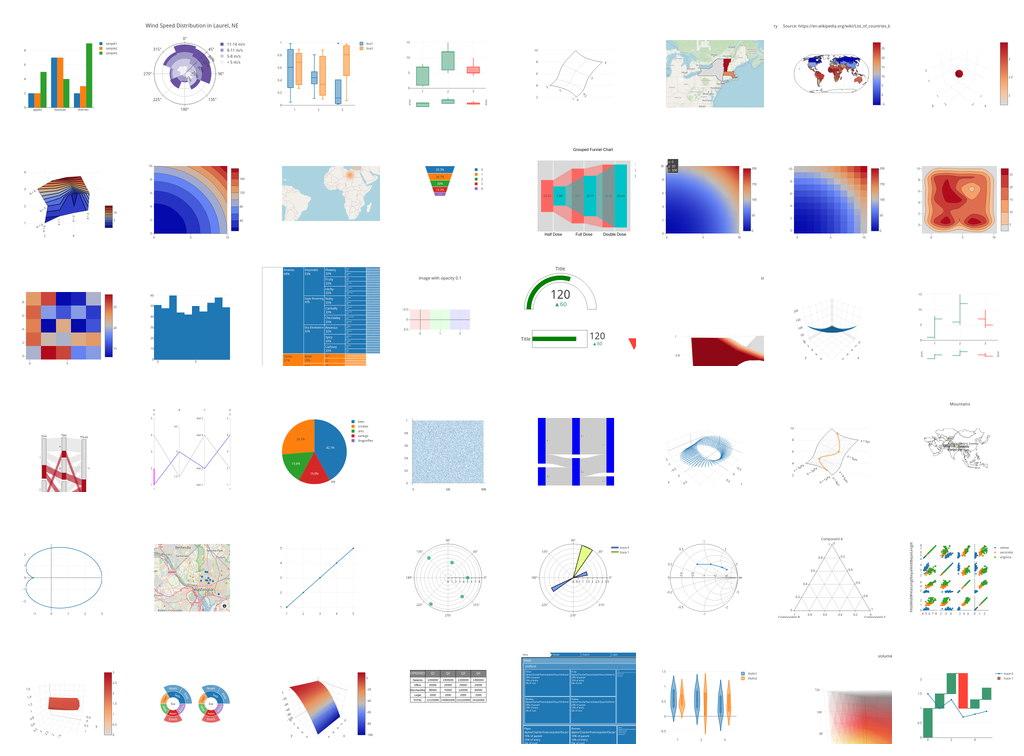
Example screenshot of plots generated with examples/traces/*.pl:
The API is subject to changes.
-
data:
Data to be represented. It could be:
- Perl data structure of the json expected by plotly.js: http://plot.ly/javascript/reference/ (this data would be serialized to JSON)
- Array ref of objects of type Chart::Plotly::Trace::*
- Anything that could be serialized to JSON with the json expected by plotly.js
- Object that could be adapted using Chart::Plotly::Adapter::*
Return the html for the plot or plots
Data to be represented. The format is the same as the parameter data in render_full_html. Accepts multiple traces/plots/objects.
Opens the plot or plots in a browser locally
Data to be represented. The format is the same as the parameter data in render_full_html. Accepts multiple traces/plots/objects.
Returns the version of plotly.js using in this version of the perl module as a string
Returns the name of function of plotly.js used in this version of the perl module to draw plots
Returns the function parameters of the function of plotly.js used in this version of the perl module to draw plots as a list of strings
Please report any bugs or feature requests via github: https://github.com/pablrod/p5-Chart-Plotly/issues
This is an unofficial Plotly Perl module. Currently I'm not affiliated in any way with Plotly. But I think plotly.js is a great library and I want to use it with perl.
If you like plotly.js please consider supporting them purchasing a pro subscription: https://plot.ly/products/cloud/
Pablo Rodríguez González pablo.rodriguez.gonzalez@gmail.com
This software is Copyright (c) 2022 by Pablo Rodríguez González.
This is free software, licensed under:
The MIT (X11) License
- Roy Storey kiwiroy@users.noreply.github.com
- stphnlyd stephanloyd9@gmail.com
- weatherwax s.g.lobo@hotmail.com