create charts showing downhole geology+grades of mining drillholes
also included in the repository some variations that fulfill specific purposes
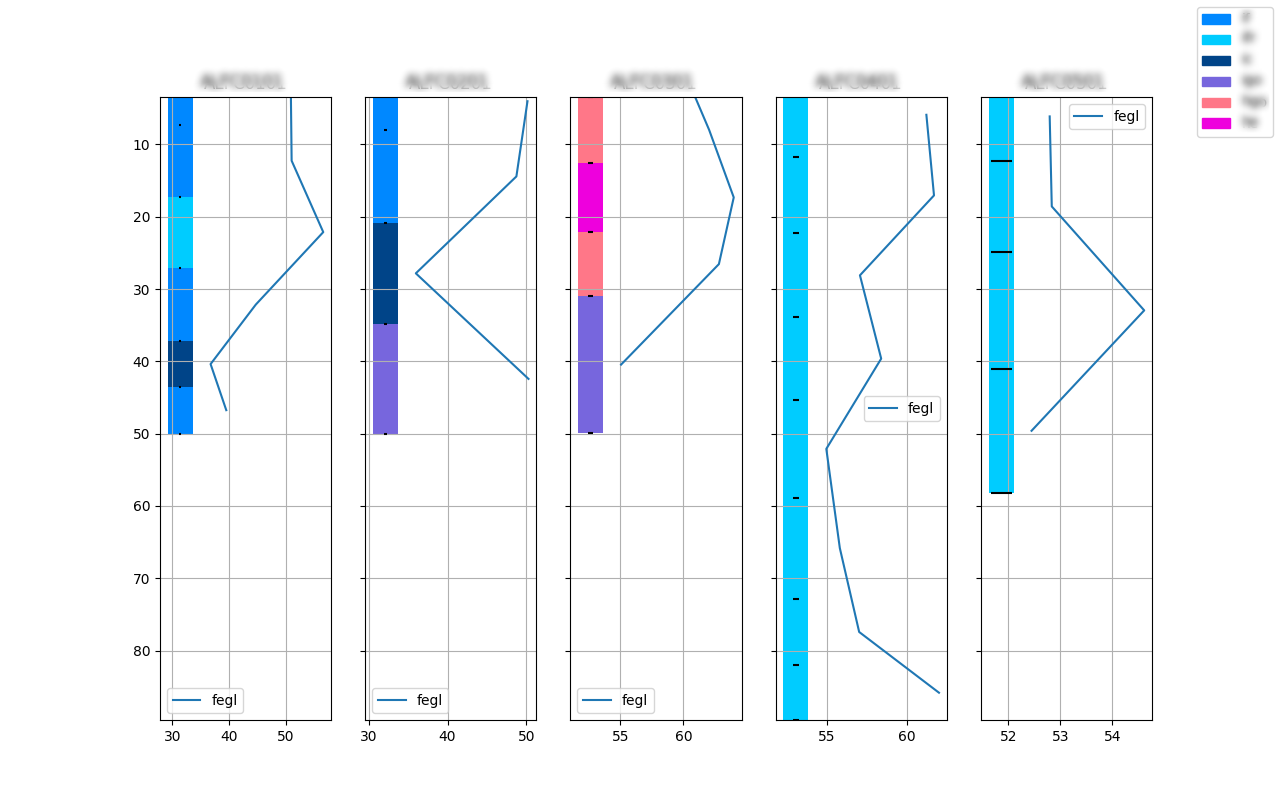
Downhole charts are a common type of visualization for drillhole data. Those charts allow for a quick glipse of the information contained on the intervals. Many proprietary softwares already have bult-in tools for generating those charts, but open source tools are not available.
The required files is the assay database with intervals and rgb color table file.

| name | optional | description |
|---|---|---|
| input | ❎ | database with holes |
| holeid | ❎ | variable with hole name |
| from | ❎ | hole interval start |
| to | ❎ | hole interval end |
| lito | ☑️ | variable with lithology |
| variables | ☑️ | each of the grades variables to be ploted alongside lito |
| lito_rgb | ❎ | excel with lito colors |
| output | ☑️ | path to save pdf file with charts |
| display | ☑️ | render the output chart on a window |
| page_charts | ☑️ | how many charts will each page contain |
| lito | rgb |
|---|---|
| ore | #0000FF |
| waste | #FF0000 |
| overburden | #00FF00 |
| etc | #FFFFFF |
| distribution | status |
|---|---|
| ✔ | |
| ❓ | |
| ❌ |
Apache 2.0