Dates are not correctly recognized #84
Comments
|
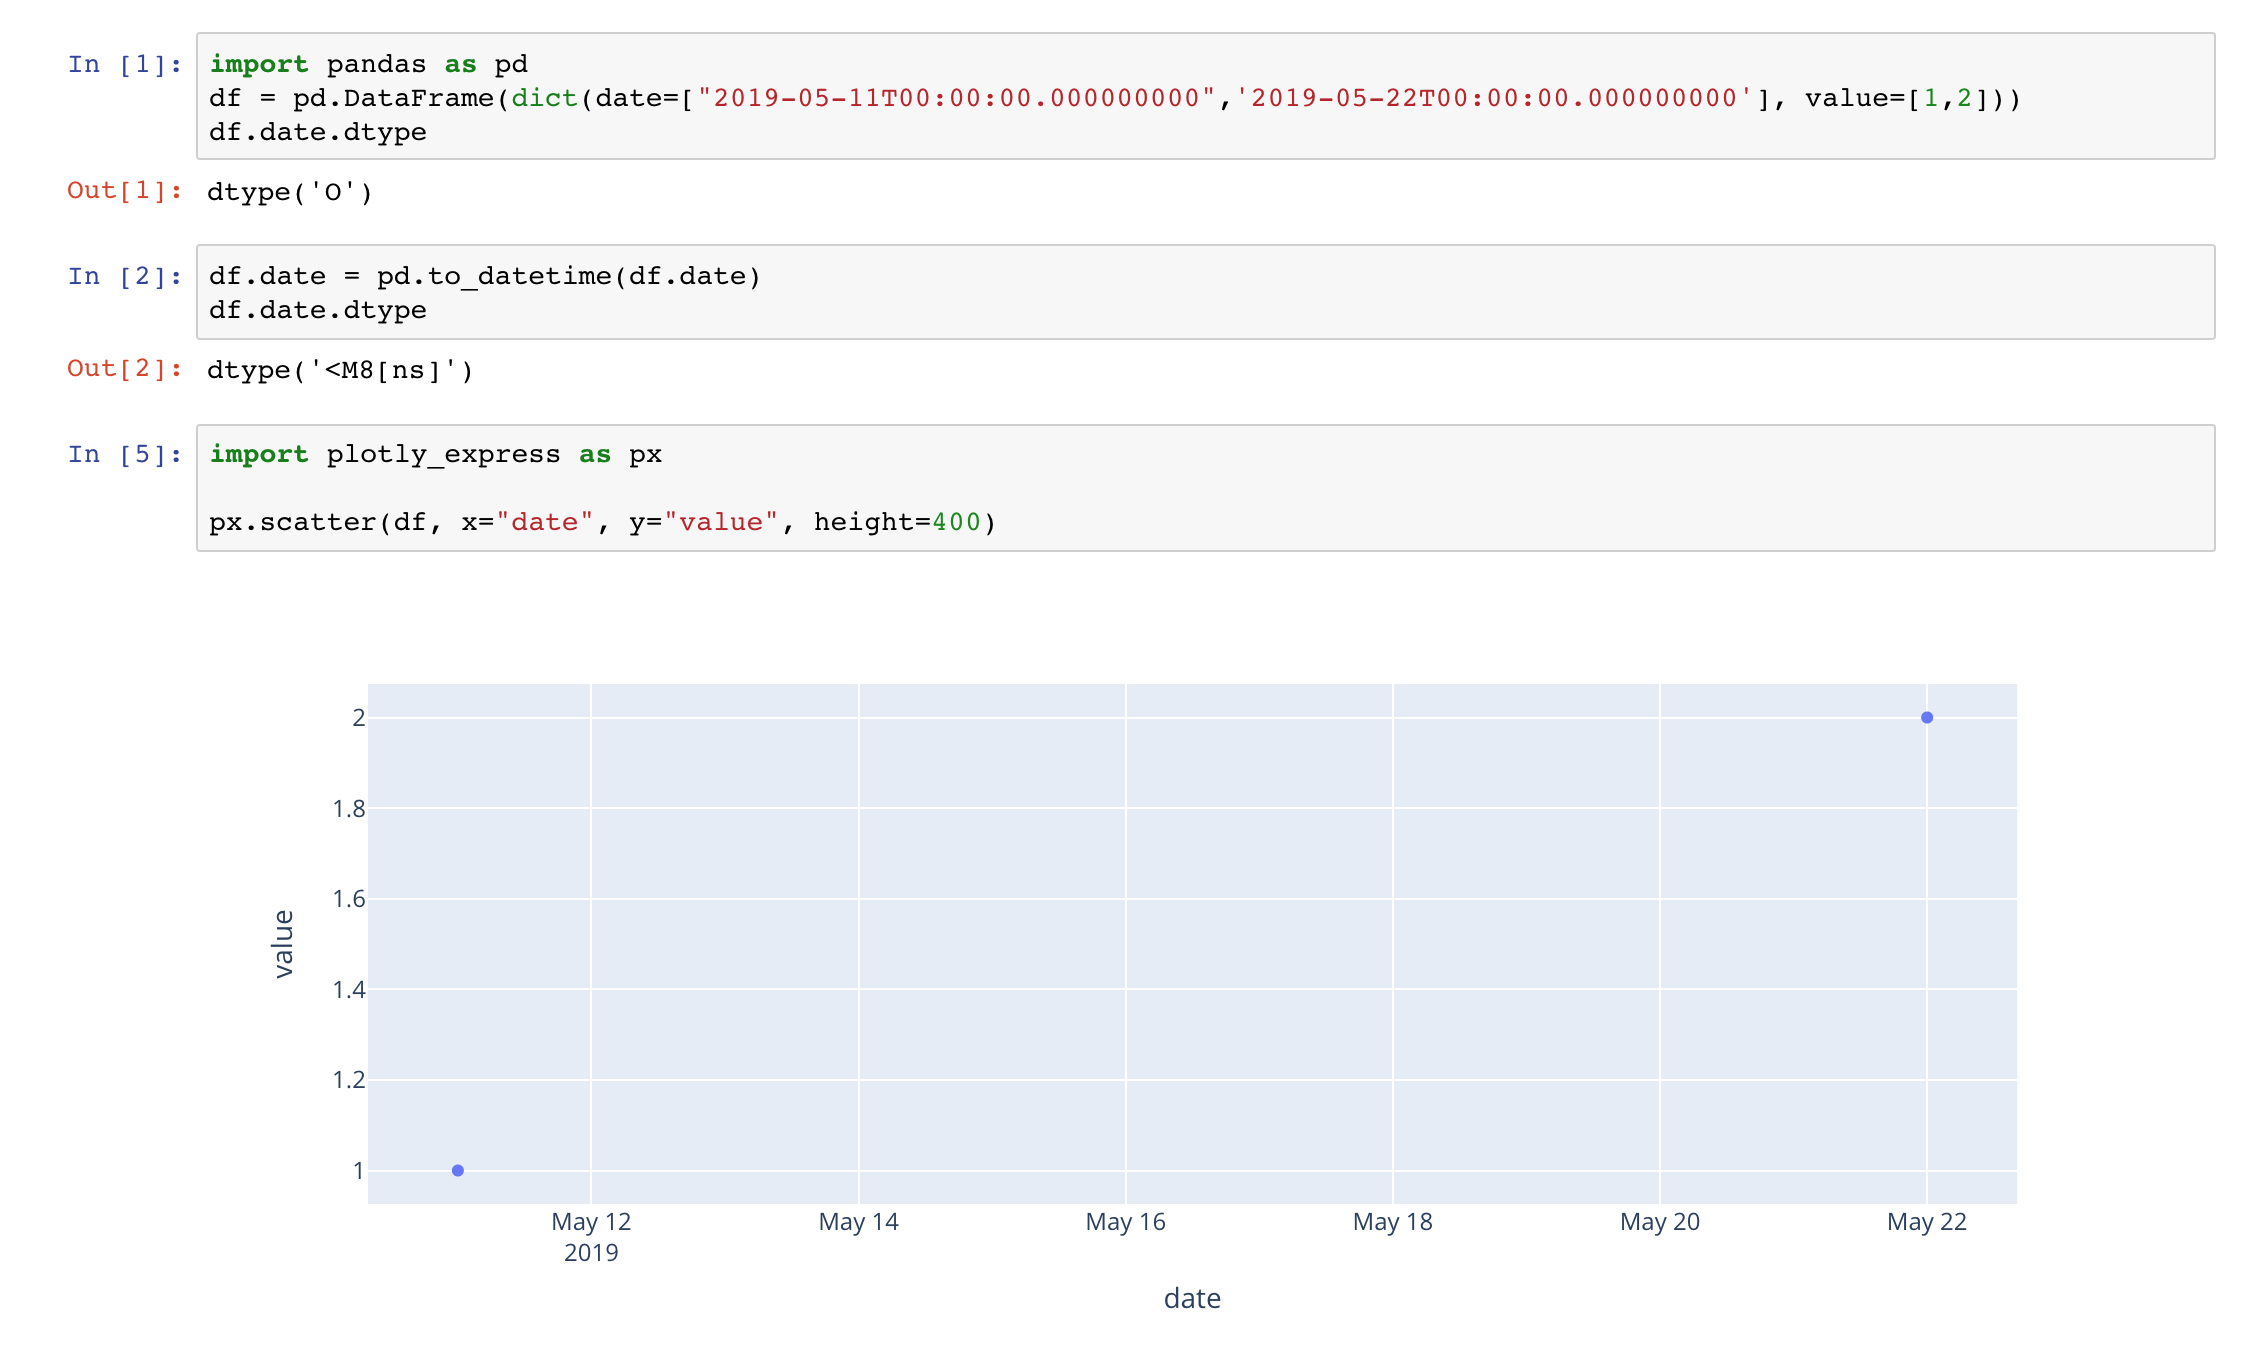
If you convert the data frame column to a date column, this should work automatically. |
|
Hi, I did convert the column to datetime and before I post the issue. |
|
OK, can you please share a minimum example of this issue? Also please let me know which versions of Python and Pandas you're running. This works for me using Python 3.7 and Pandas 0.23.0:
|
|
They don't work as index though: df = pd.DataFrame({
"a": [1, 2, 3, 4],
"i": pd.date_range(start=dt.datetime(2019, 1, 1, 0), periods=4, freq="D")
})
px.line(df, x="i", y="a") # Works
px.line(df.set_index("i"), x=df["i"], y="a") # Doesn't work
px.line(df.set_index("i"), x=df.set_index("i").index, y="a") # Doesn't work
df_i = df.set_index("i")
px.line(df_i, x=df_i.index, y="a") # Doesn't work |
|
This is normal because
This in principle should work although it's really odd because you're making two copies of
This is probably the recommended way, and should work. This does work:
|
|
@emmanuelle can you take a look at some of the cases above here and LMK if you agree about the "should work" cases and take a look at why they might not be working please? @Juanlu001 thanks for the interesting and easy to reproduce bug report ;) |
My dates on x-axis
Dash / Jupyter won't plot it. However, if it's offline mode, I can see the visualization correctly from rendered html file.
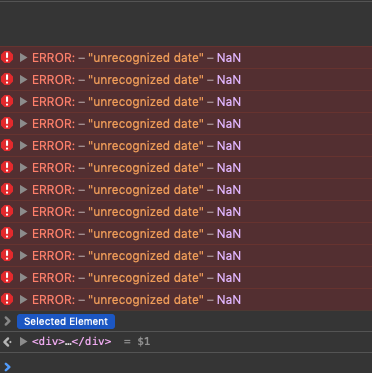
The text was updated successfully, but these errors were encountered: