Home
The Pothos plotters toolkit is a component of the Pothos data-flow framework. The toolkit contains a family of blocks that implement displayable plotters, many of which can be used for signal-analysis to visualize streaming sample data, and discrete packets of sample data. Plotter blocks can be tied into the flow of the topology like any other block, but also have a associated widget that can be displayed and manipulated within the Pothos GUI. The axis and titles for all plotters can be hidden to make a really sleek and slimmed down visualization.
- For graphical control widgets, checkout the widgets toolkit.
Plotters table of contents
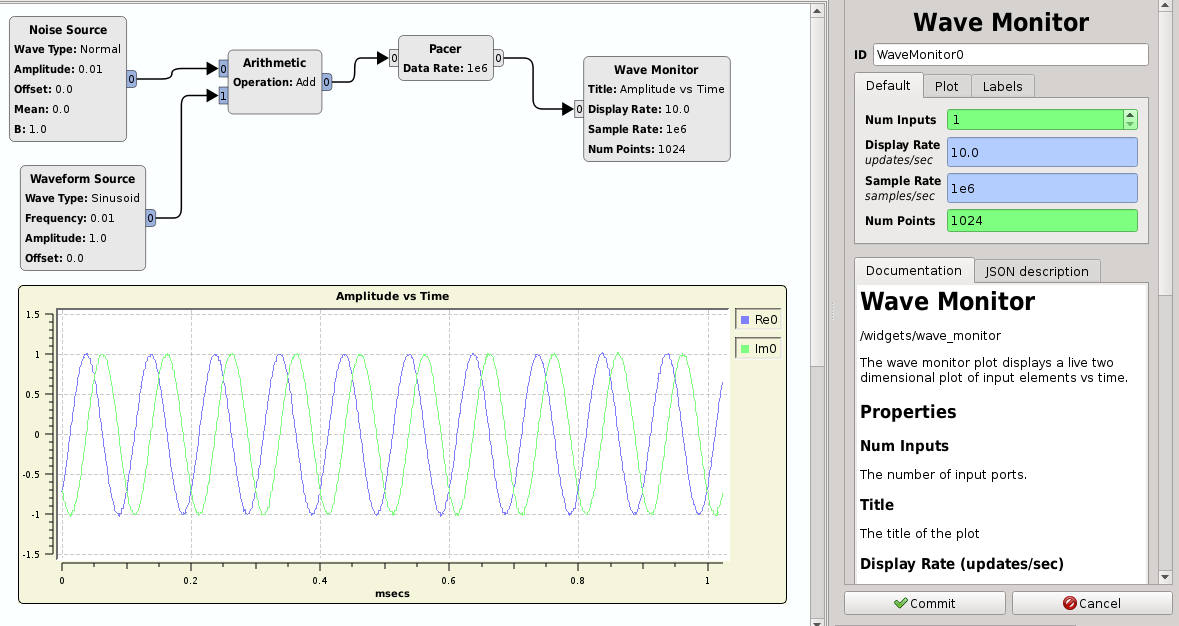
The waveform plotter is a multi-channel time-domain display widget.
Features:
- Automatically inferred data type from stream
- Supports multi-channel heterogeneous stream data types
- Displays stream labels as markers on the graph
- Configurable trigger menu
- Supports zooming
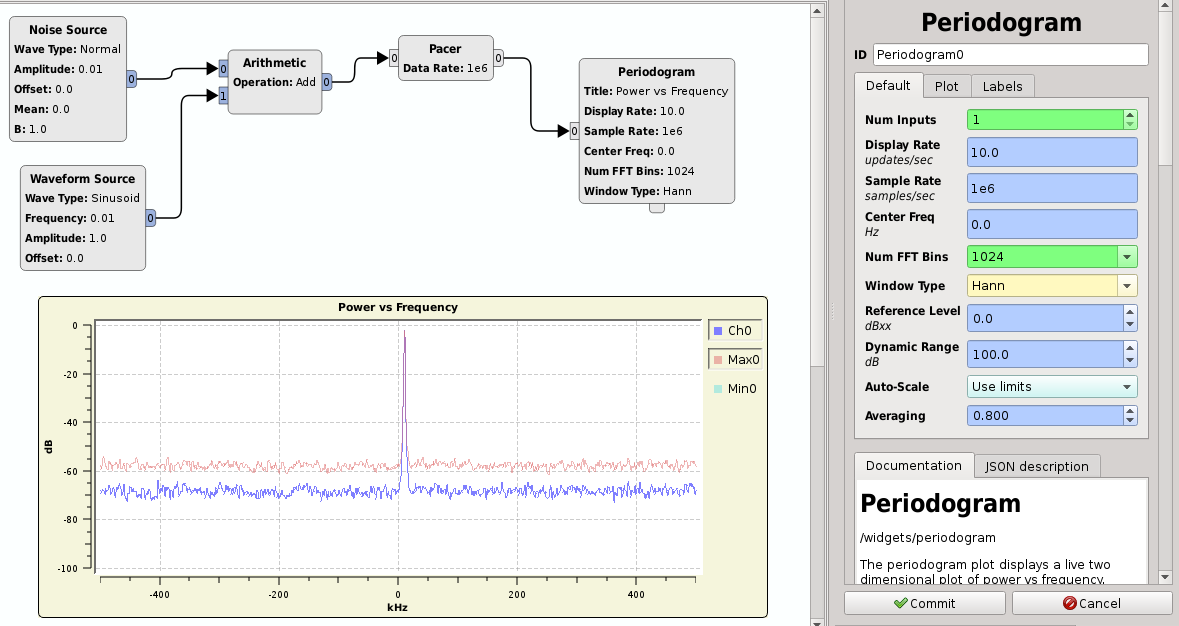
The periodogram plotter is a multi-channel frequency-domain display widget.
Features:
- Automatically inferred data type from stream
- Supports multi-channel heterogeneous stream data types
- Emits a frequency select signal when a frequency is double-clicked
- Supports bin averaging, and minimum and maximum hold channels
- Supports zooming
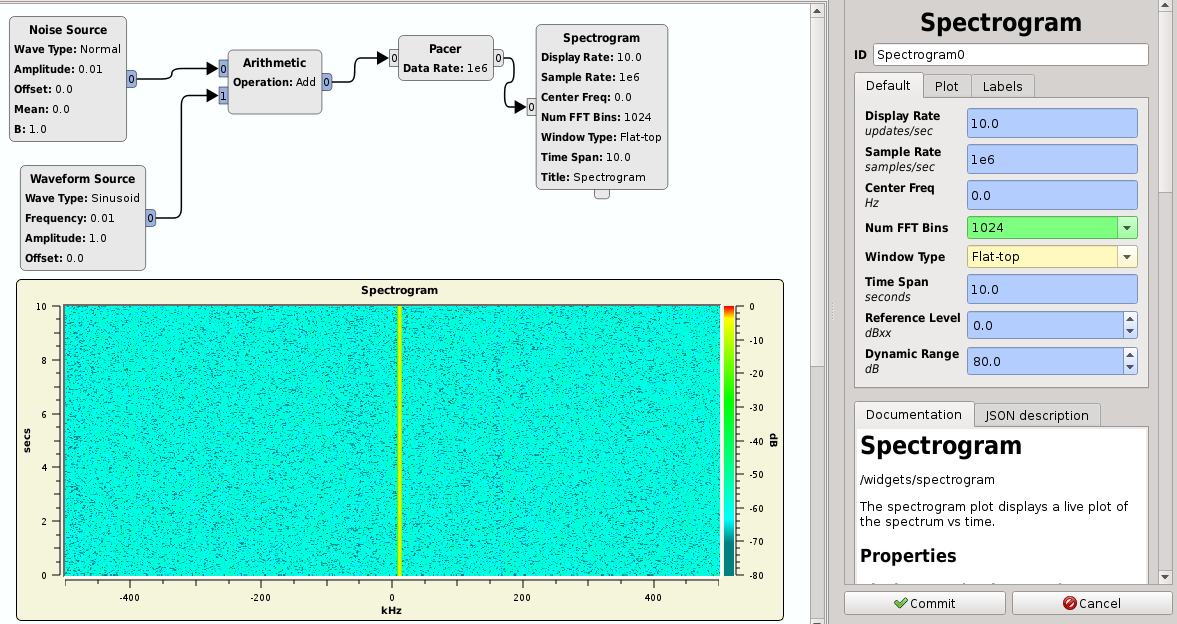
The spectrogram plotter is a single-channel frequency-domain display widget.
Features:
- Automatically inferred data type from stream
- Emits a frequency select signal when a frequency is double-clicked
- Supports zooming
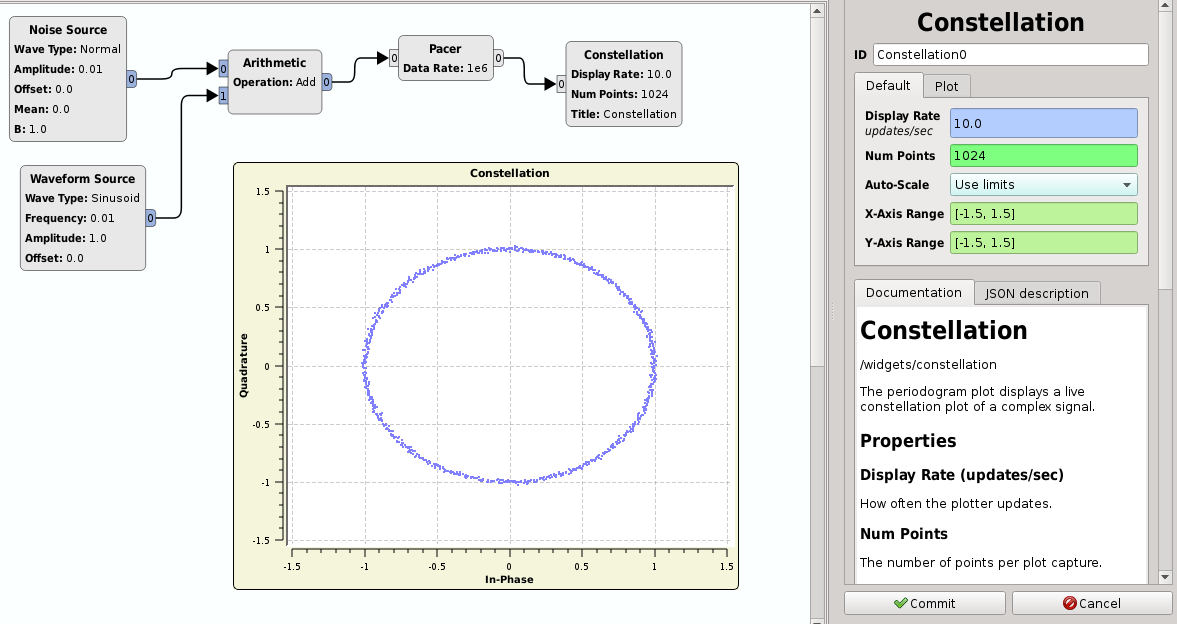
The spectrogram plotter is a single-channel IQ plotter for complex data.
Features:
- Automatically inferred data type from stream
- Supports zooming
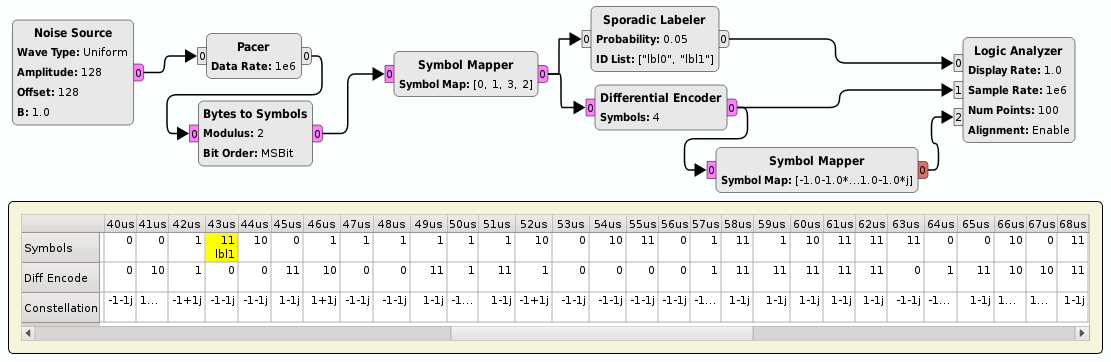
The logic analyzer displays discrete values for multiple streams. Its useful for debugging symbols, mappers, slicers, and other digital type blocks.
Features:
- Automatically inferred data type from stream
- Supports multi-channel heterogeneous stream data types
- Displays stream labels with the associated element
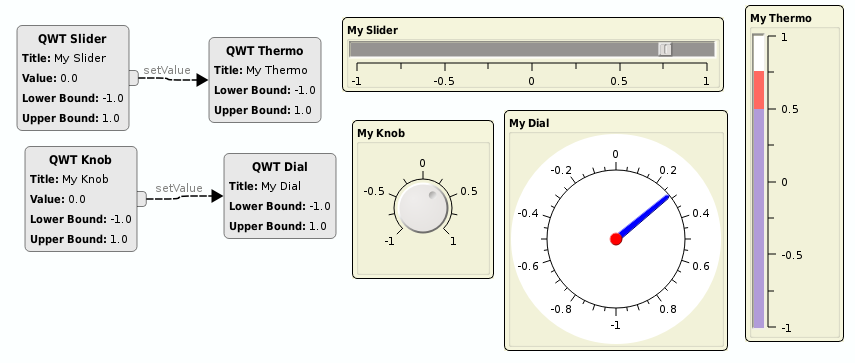
Due to the dependence on Qwt, some control and status widgets are available in the plotters toolkit, rather than the widgets toolkit. The Qwt widgets include:
- A slider for controlling a number, with optional scale axis.
- A knob for controlling a number with rotation.
- A thermo for displaying a number, with optional scale axis, configurable colors, and an alarm threshold.
- A dial for displaying a number in a circle with configurable colors and needle arms.
All QwtWidgets support configurable titles, linear and logarithmic scaling.