Speaker: Reshama Shaikh (@reshamas)
Article on Medium: Creating Annotations in Python Plotly
Video Preview: Annotation Examples

- PyOhio
- July 31, 2021 (Saturday)
Enriching Data Visualizations with Annotations in Plotly
Thunder talk: 10 minutes
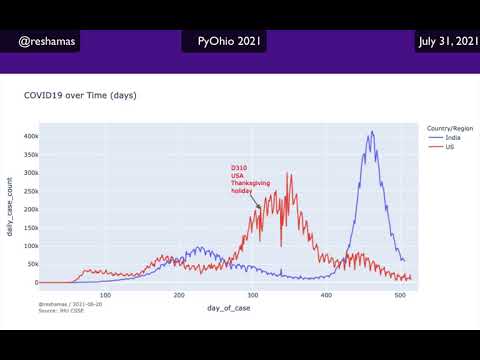
Plotly is a versatile python graphing library which lets us make interactive graphs. In this talk, I will show how to go from a typical static visualization to one enriched with annotations which will convey to your audience a more complete interpretation of your visualization.
Here are some sample plotly visualizations I have made, and in this talk, I will share how to create them.
Getting started annotating graphs.