rqt_plot: (matplot only) shows strange output after running for ~5 minutes (progressively gets worse) #48
Comments
|
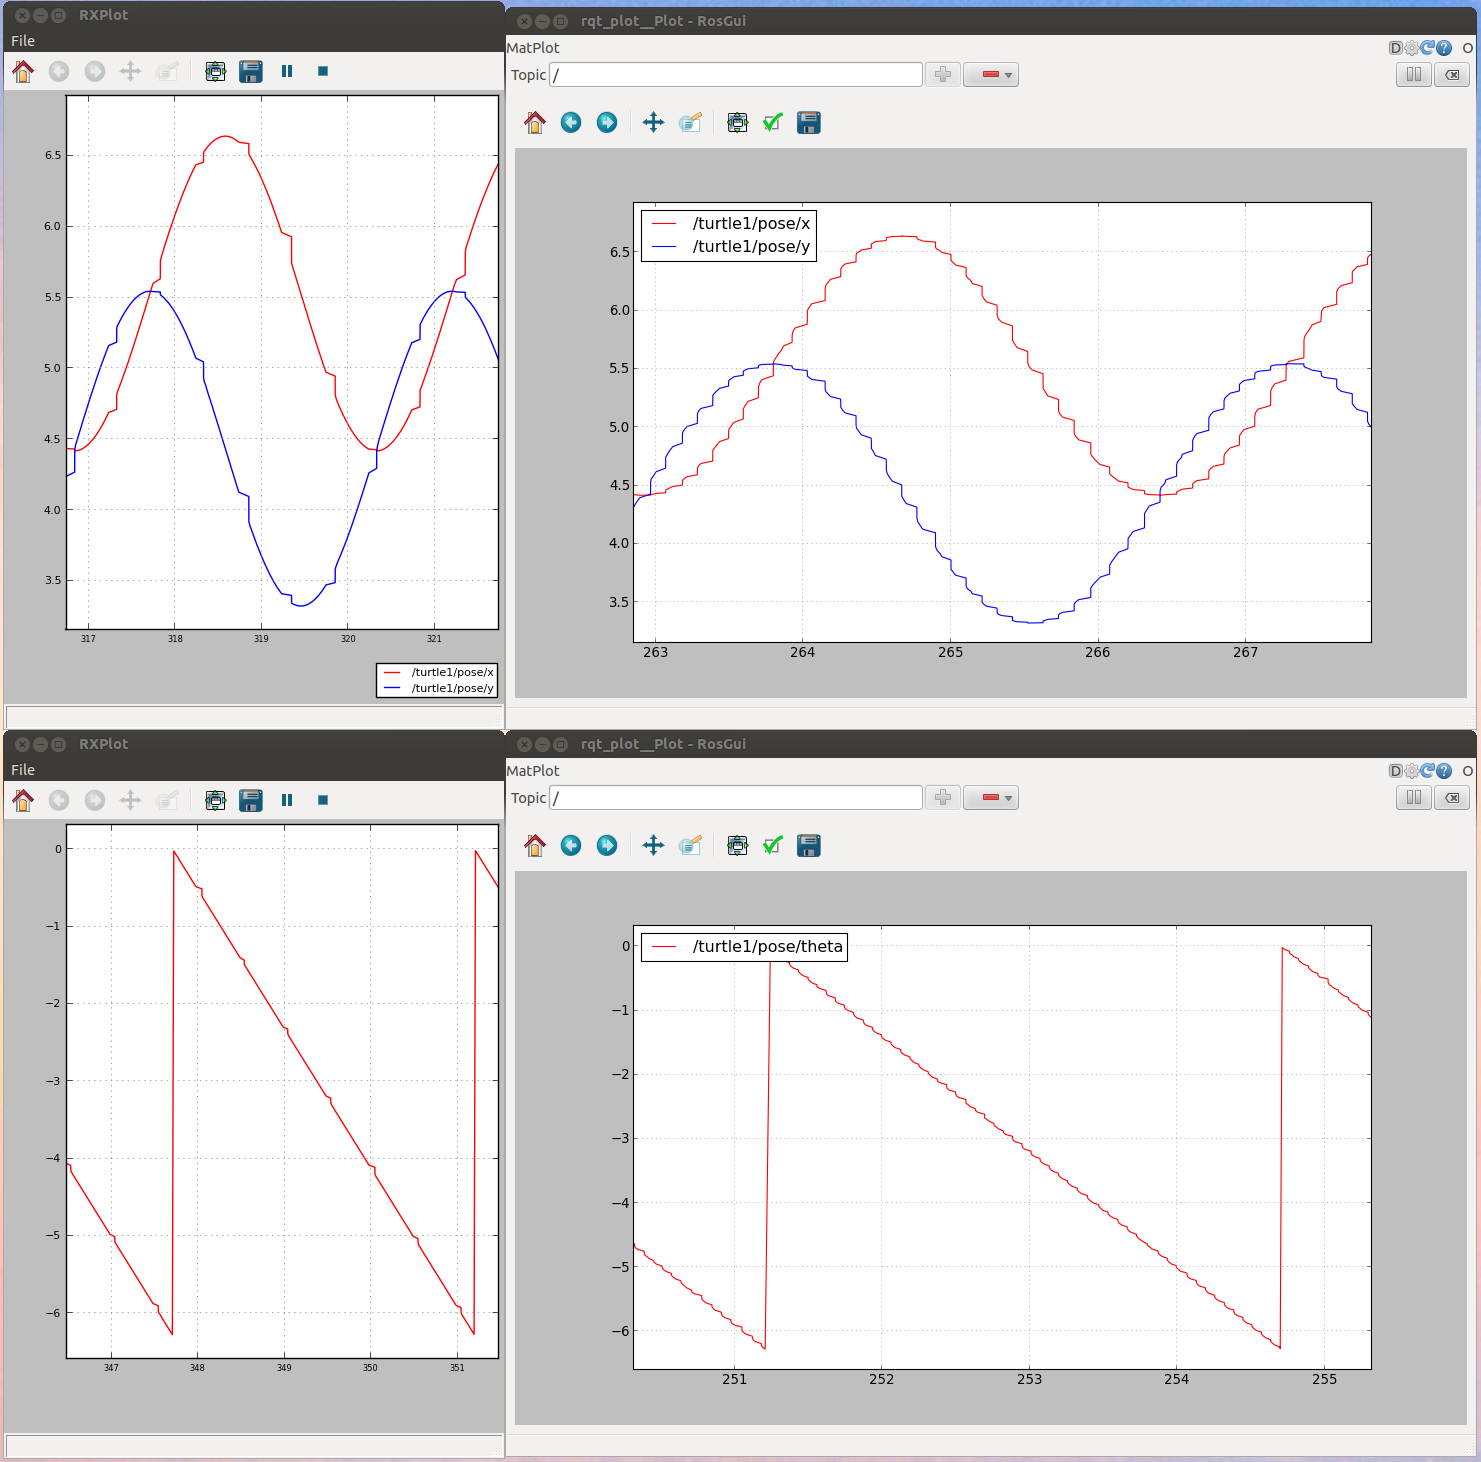
From the screenshots it looks like rxplot also has this problem (maybe not as strong), is that correct? |
|
Yes it happens on rxplot too but it does seem more pronounced on the rqt I will try to reproduce on the other plotters today. |
|
Tested QwtPlot and it doesn't seem to happen (so far I will continue running this to be sure) After fixing a bug in pyqtgraph in pyqtgraph/graphicsItems/PlotItem/PlotItem.py: It also doesn't seem to happen. Perhaps we should depend on one of the other packages and make it the default? |
|
Just to note it gets really bad and really slow after awhile of running. I talked with some people here and they mentioned this slowness has been an issue in rxplot for some time. |

|
I had a quick look at the MatPlot backend code which someone ported form rxplot and it looks like the calculation of the axes bounds might be the problem, as it calculates the min and max y values over the complete data sequence... |
|
I checked it out and this did not fix the problem and actually caused some http://www.ros.org/wiki/ROS/Tutorials/UnderstandingTopics This could probably be avoided if we ensured the currently view-able graph was considered in the bound limits. |
|
Also I have some new information on the original bug. If you pause the plot and then unpause it the time you had it paused will show up in the graph as a perfectly smooth graph and then the plotter will start to draw incorrectly again. |

|
an aside: What is preventing us from depending directly on one of the other 2 plotting libraries and using those as the default? |
…ange once when adding data instead of on draw (ros-visualization/rqt#48)
|
The problem is that the matplot function is taking longer and longer and therefore block reading the incoming data. This is also the reason why "pause" make the curves perfectly smooth again. I have update the code to not use collections for the data but simple list (which turns out to scale better), perform the calculation of the min/max y values when adding values (instead of repeatedly when drawing going over all/parts of the data). It scales much better now but the inherent problem is not fixed - the data will always accumulate over time. We could either limit the history or add a manual clean option if we want this to be fixed completely. |
|
migrated to ros-visualization/rqt_common_plugins#19 |
…ange once when adding data instead of on draw (ros-visualization/rqt#48)
…ange once when adding data instead of on draw (ros-visualization/rqt#48)
The issue:
steps to duplicate
execute the UnderstandingTopics tutorial (http://www.ros.org/wiki/ROS/Tutorials/UnderstandingTopics)
leave the rqt_plot open for an extended period of time.
You will see the following:
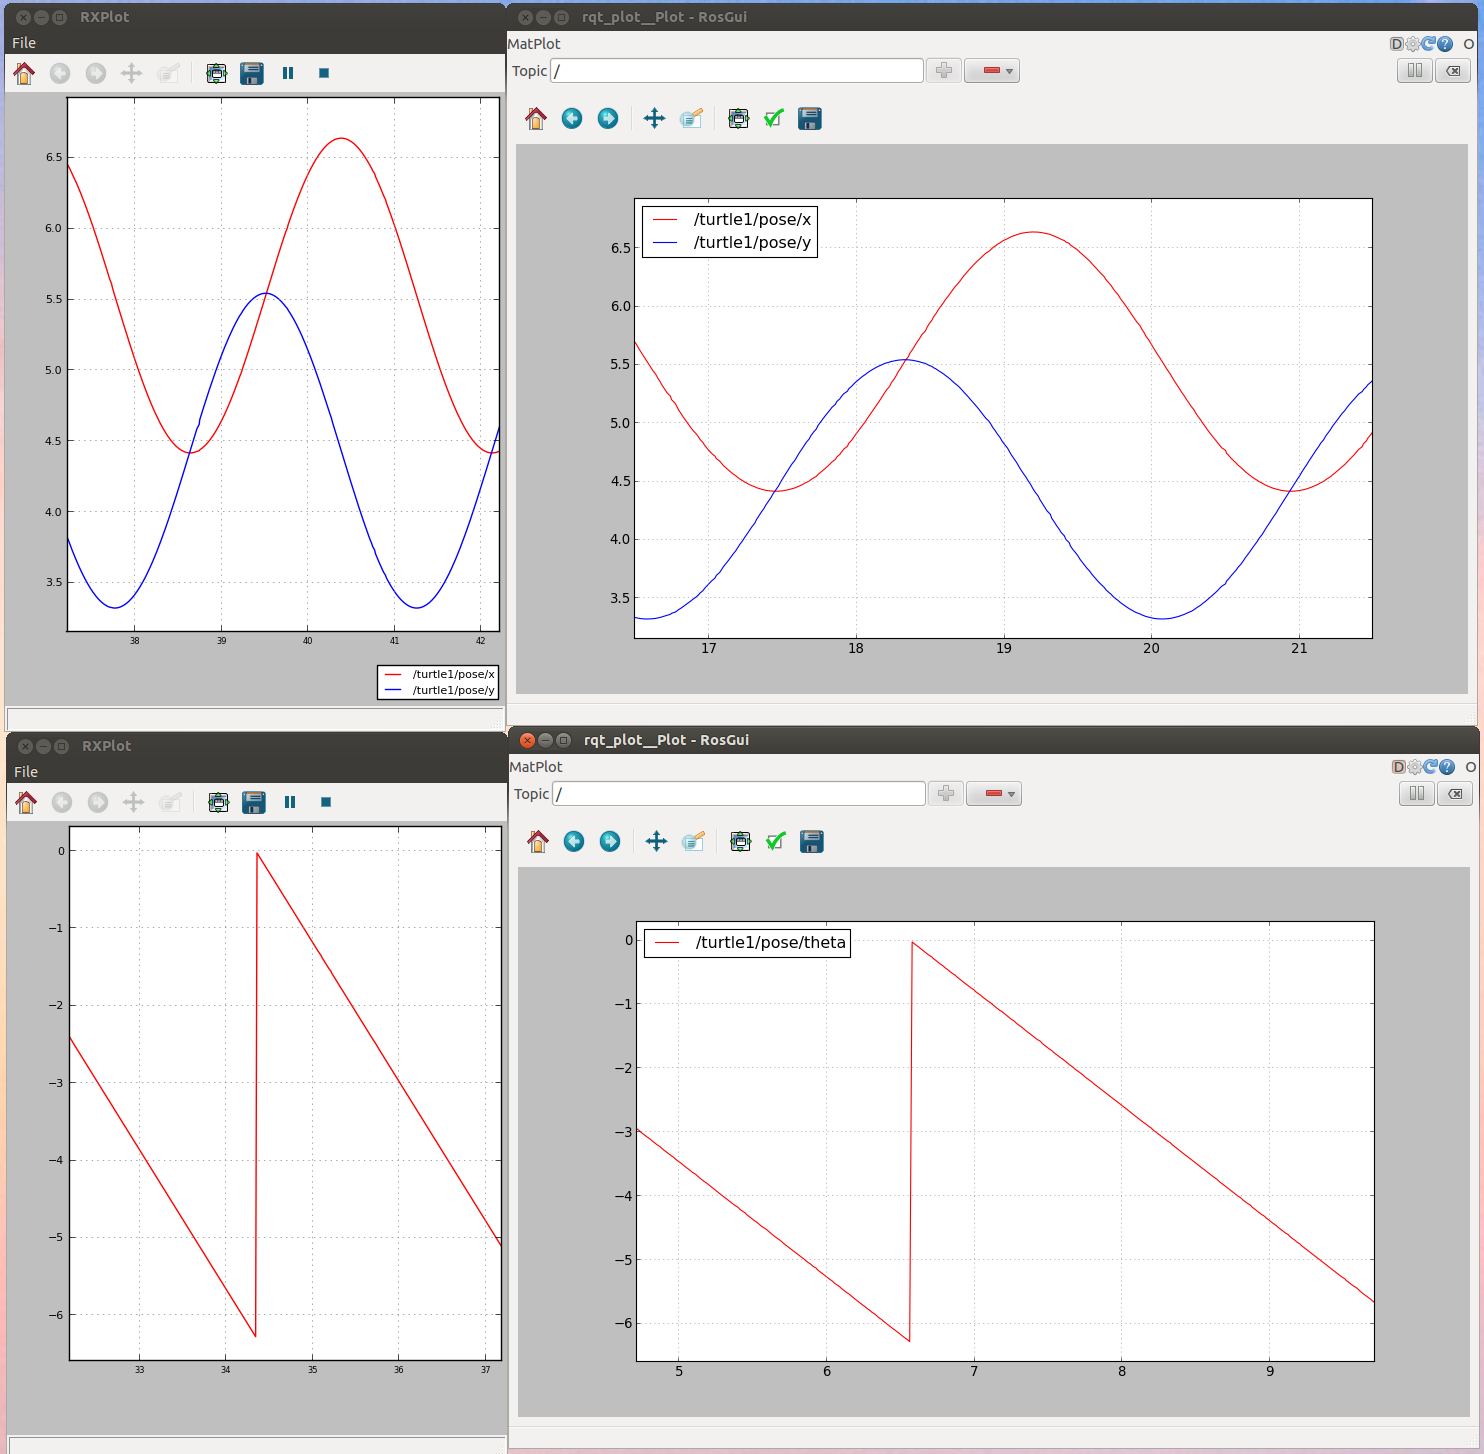
It should look like the following (it starts this way and progressively gets worse:
groovy
using rqt 1.5
The text was updated successfully, but these errors were encountered: