Datoviz is an open-source high-performance interactive scientific data visualization library leveraging the graphics processing unit (GPU) for speed, visual quality, and scalability. It supports both 2D and 3D rendering, as well as minimal graphical user interfaces (using the Dear ImGUI library).
Written in C, Datoviz has been designed from the ground up for performance. It provides native Python bindings (based on Cython). Bindings to other languages could be developed thanks to community efforts (Julia, R, MATLAB, Rust, C#, and so on). Datoviz uses the Vulkan graphics API created by the Khronos consortium, successor of OpenGL. Supporting other modern graphics API, such as WebGPU, would constitute interesting developments.
Datoviz is currently being developed mostly by Cyrille Rossant at the International Brain Laboratory, a consortium of neuroscience research labs around the world.
Datoviz is at an early stage of development. The library is quite usable but evolves quickly. Datoviz has been tested on Linux, macOS (Intel), and to a lesser extent, Windows. It should work on most computers, with or without a discrete GPU (but with up-to-date graphics drivers). Many more features will come later and the documentation will be improved. Contributions are highly welcome!
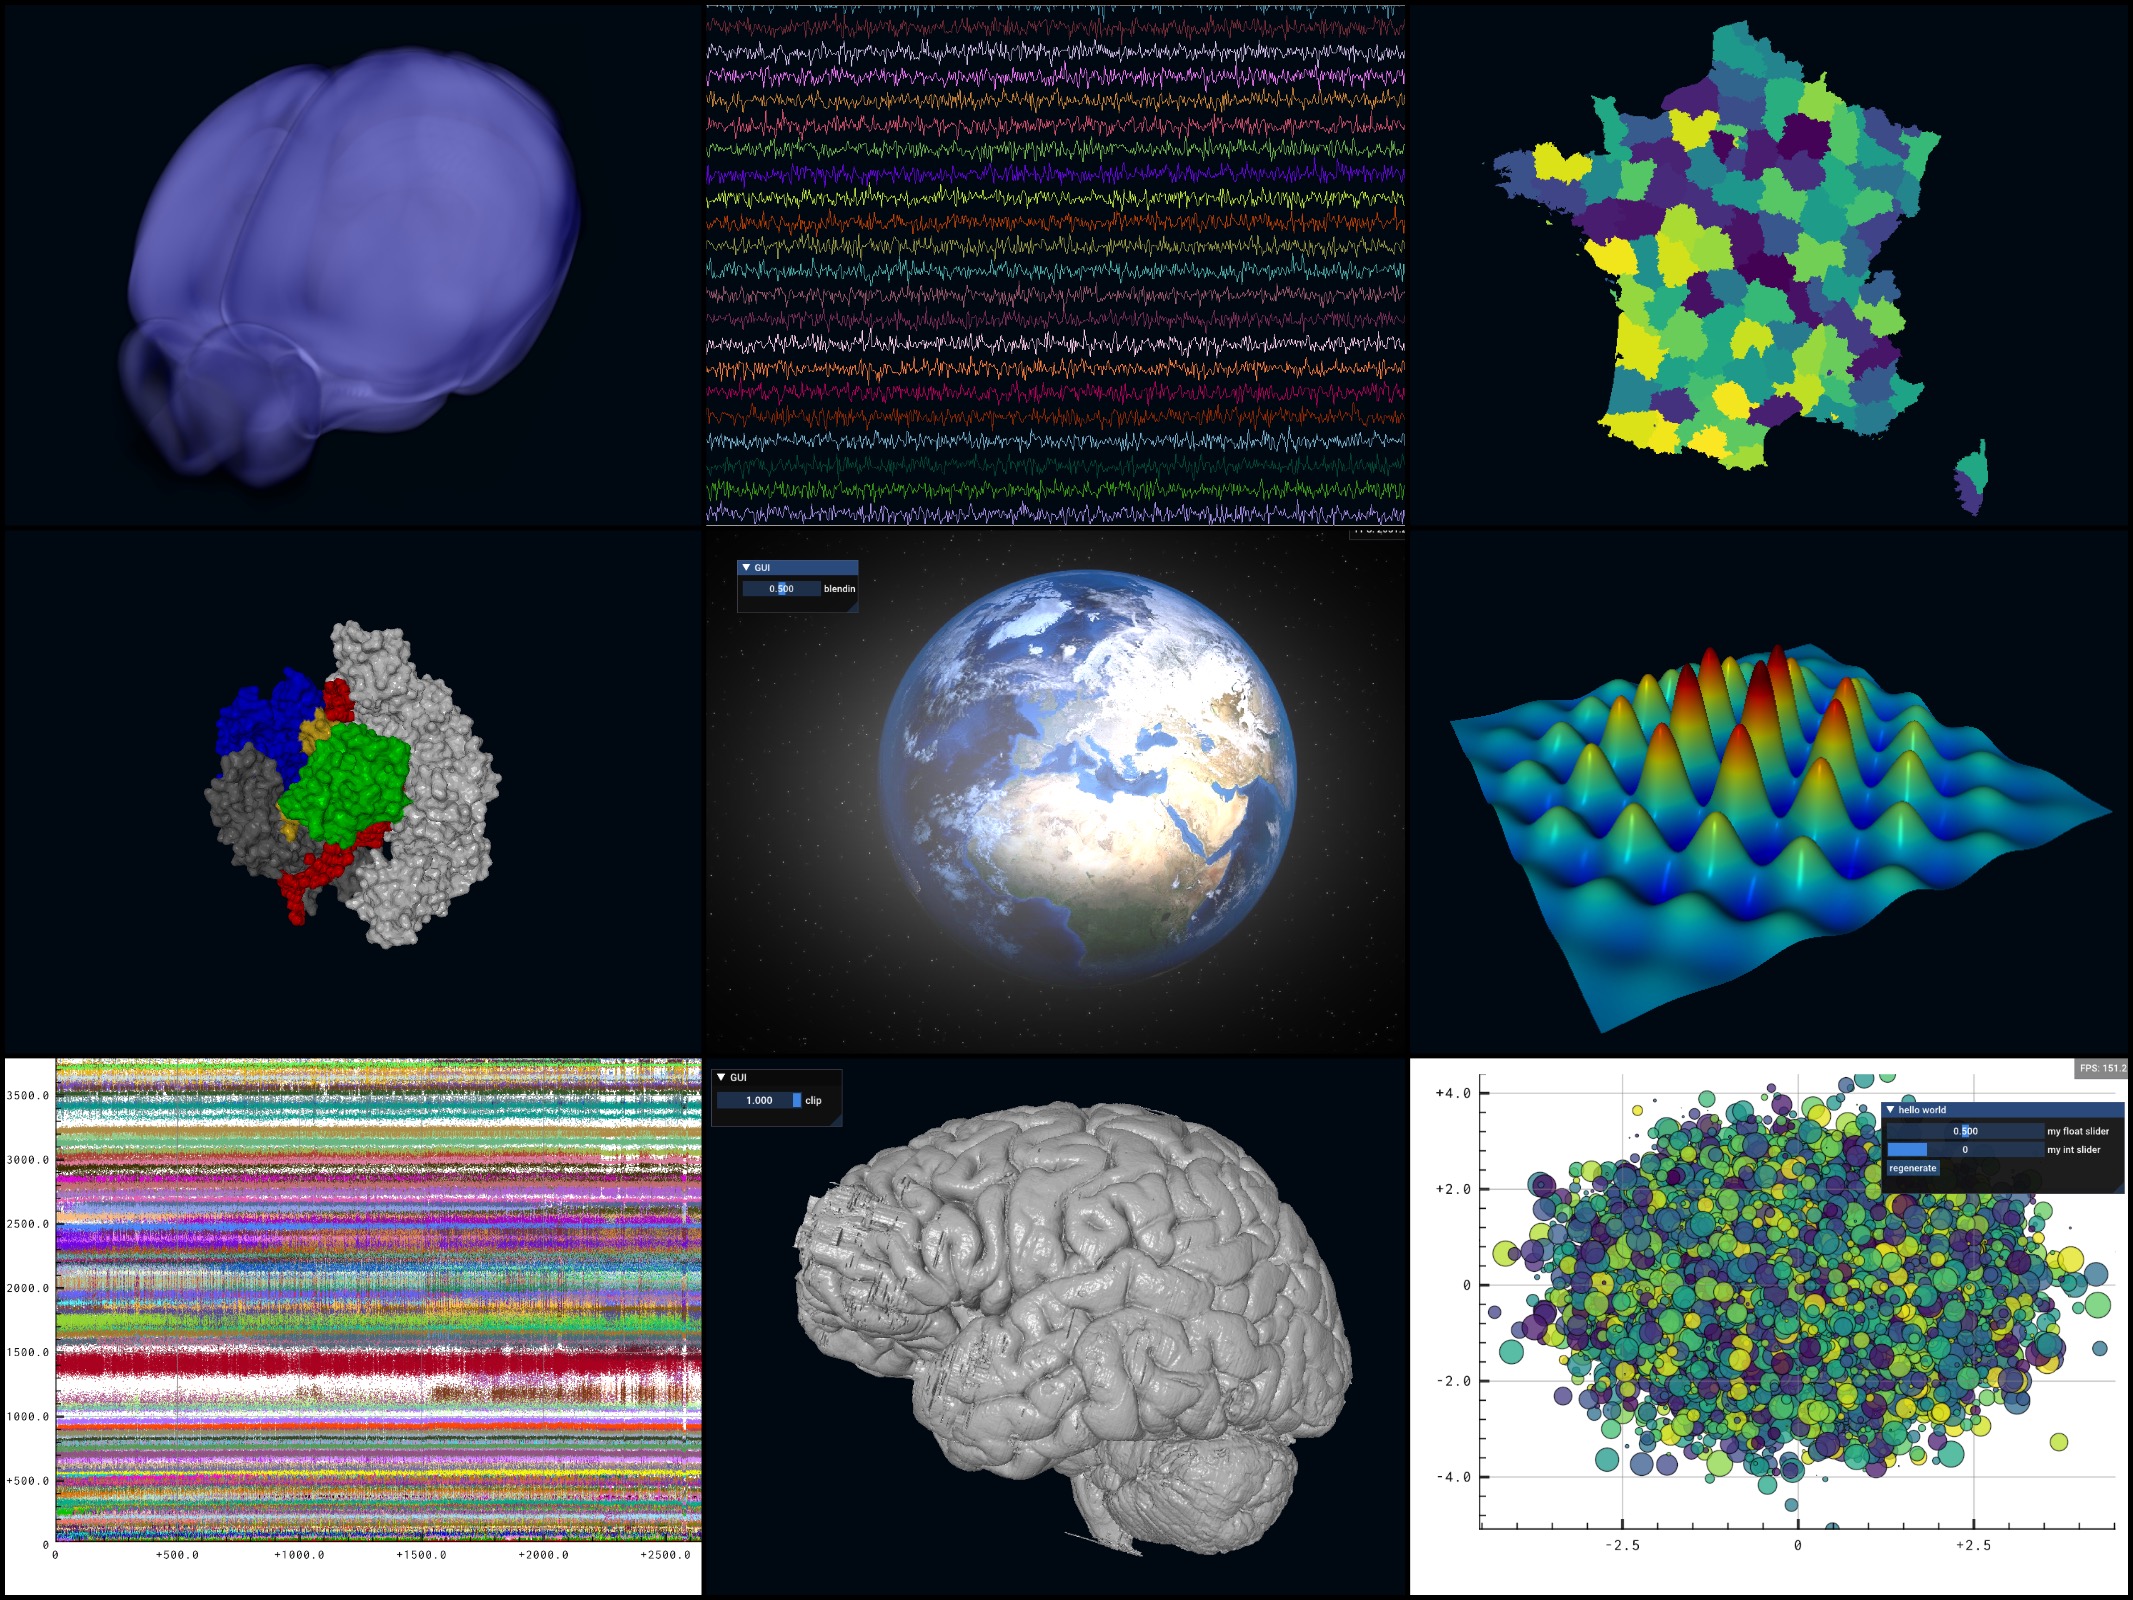 Credits: mouse brain volume: Allen SDK. France: Natural Earth. Molecule: Crystal structure of S. pyogenes Cas9 from PDB (thanks to Eric for conversion to OBJ mesh). Earth: Pixabay. Raster plot: IBL. 3D human brain: Anneke Alkemade et al. 2020, thanks to Pierre-Louis Bazin and Julia Huntenburg.
The documentation is divided into:
- Installation: install guide (no precompiled packages yet, coming soon),
- Tutorials: quickstart Python tutorial,
- Examples: gallery of screenshots and associated Python code,
- How to guides: advanced topics for expert users, explaining how to use C and Vulkan for making custom visuals and applications,
- Reference: comprehensive list of included colormaps, visuals, and graphics,
- C API reference: list of all publicly available C functions,
- Discussions: explanations, Vulkan crash course, and notes.
- scatter plot with 10M points: 250 FPS (
pointvisual) - high-resolution 3D mesh with 10M triangles and 5M vertices: 400 FPS
- 1000 signals with 30K points each (30M vertices): 200 FPS
GPU: 2019 NVIDIA GeForce RTX 2070 SUPER. Window size: 1024x768.
- High-quality antialiased 2D visuals: markers, paths, lines, text, polygons, and more (visuals originally implemented in Glumpy)
- 3D visuals: meshes, surfaces, volumes
- Mixing 2D and 3D plots seamlessly in the same window
- ~150 colormaps included (from matplotlib, colorcet, MATLAB)
- High-level interactivity: pan & zoom, mouse arcball, first-person cameras
- Axes: ticks, grids, labels
- Subplots organized in a grid layout
- DPI-aware: partial support for high-resolution monitors
- GUIs integrated via the Dear ImGUI C++ library (Qt or other backends not required)
- Custom visuals, with custom shaders and/or custom data transformations
- Mouse picking
- Initial support for multiple canvases
- Initial builtin support for screencasts and video recording with ffmpeg (optional dependency)
- Initial support for offscreen rendering and CPU emulation via swiftshader
Upcoming features:
- More visuals: arrows, triangulations, planar straight-line graphs (PSLG), histograms, areas, graphs...
- Further data transformations: logarithmic, polar, basic Earth coordinate systems for geographical data
- Colorbars
- 3D axes
- Better support of multiple GPUs
- Qt integration
- Continuous integration, more robust testing
Long-term future (or shorter if there are community contributions):
- Support for other languages (Julia, R, MATLAB, Rust...)
- Jupyter notebook integration
- Web integration via WebGPU?
- Remote desktop integration?
Datoviz is developed primarily by Cyrille Rossant at the International Brain Laboratory. The logo was graciously created by Chiara Zini.
Datoviz borrows heavily ideas and code from other projects.
VisPy is a Python scientific visualization library created in 2013 by Luke Campagnola (developer of pyqtgraph), Almar Klein (developer of visvis), Nicolas Rougier (developer of glumpy), and myself (Cyrille Rossant, developer of galry). We joined forces to create a single library unifying all of our approaches, which proved to be challenging. There is today a community of users and projects based on VisPy (napari), and the library is currently being maintained by David Hoese, Eric Larson, and others. VisPy recently received funding from the Chan Zuckerberg Initiative to improve the documentation and knowledge base.
VisPy is written entirely in Python and it is based on OpenGL, an almost 30 year old technology. Vulkan was first released in 2016 by the Khronos consortium and it can be seen, to some extent, as a successor to OpenGL. However, Vulkan is a lower-level library and it is harder to use. This is the price to pay to reach better GPU performance.
Datoviz may be seen as a ground-up reincarnation of VisPy, with two fundamental differences: it is written in C rather than Python, and it uses Vulkan rather than OpenGL.
- The main advantages of C compared to Python are: ability to bind to any other language beyond Python; performance; possibility to use the Vulkan C API directly rather than via a wrapper.
- The main advantages of Vulkan compared to OpenGL are: modern API, more adapted to today's hardware; performance. However, it is more complex and less user-friendly. Datoviz abstracts a lot of that complexity away.
Glumpy, developed by Nicolas Rougier, provides efficient implementations of high-quality 2D visuals on the GPU, using algorithms from the antigrain geometry library. The GPU code of most 2D visuals in Datoviz comes directly from Glumpy.
- LunarG Vulkan SDK (mandatory)
- GLFW (mandatory)
- ffmpeg (optional), for making live screencasts
- libpng (optional), for making PNG screenshots
- glslang (optional), for compiling GLSL shaders to SPIR-V on the fly
- earcut (included), developed by Mapbox, for polygon triangulations
- triangle (included), developed by Jonathan Richard Shewchuk, for Delaunay triangulations
- extended Wilkinson algorithm (included) for tick placement
- Dear ImGUI (included)
- antigrain geometry (GLSL implementation included)
- msdfgen: multi-channel signed distance field (to do: bundle as submodule?)
An upcoming version will also have the following dependencies:
- freetype (optional)
Datoviz is being developed at the International Brain Laboratory, with funding from the Simons Foundation, the Flatiron Institute, the Wellcome Trust, INCF.


Glossary:
*[Vulkan]: Low-level graphics API created by Khronos, and successor of OpenGL *[shaders]: code written in GLSL and executed on the GPU to customize the graphics pipeline *[GLSL]: OpenGL shading language, the C-like language used to write shaders