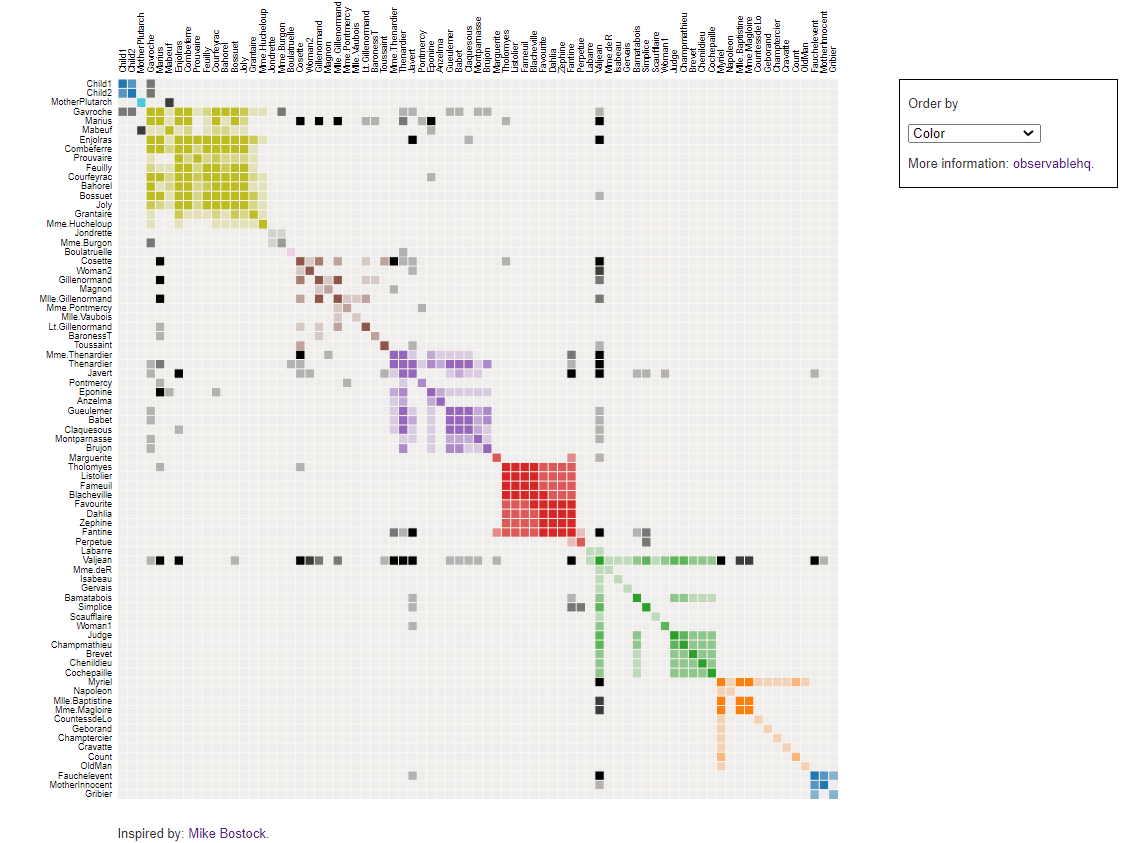
Build Interactive Matrix Chart of Les Miserables Characters using Flask and D3.js
In this Medium Article, I try to give you a recipe to design fancy visualization using D3.js without prior knowledge of javascript (or very light).
- Basic knowledge of HTML
- Intermediate knowledge of Python including Flask framework
- Find an example of visualization you want to design
This repository code should be used in the first step of analysis to duplicate the example found and render it using Python Flask.
- Copy Github repository in your local folder and create a local python environment
- Download libraries listed in requirements.txt
pip3 install -r requirements.txt
- Launch app.py
py app.py
You can now replace miserables.json with your dataset or follow the article instructions to use a dataset of e-commerce sales of perfume and cosmetics products.
Senior Supply Chain Engineer with an international experience working on Logistics and Transportation operations.
Have a look at my portfolio: Data Science for Supply Chain Portfolio
Data Science for Warehousing📦, Transportation 🚚 and Demand Forecasting 📈