ENH: Improve beta entropy when one argument is large #18714
Conversation
|
import numpy as np
import matplotlib.pyplot as plt
from scipy import stats
from scipy.special import psi
from scipy.special import gammaln
from mpmath import mp
mp.dps = 200

def asymptotic_one_large(a, b):
    s = a + b
    simple_terms = (
        gammaln(a) - (a -1)*psi(a) - 1/(2*b) + 1/(12*b) - b**-2./12 - 1/(12*s)
        + 1/s + s**-2./6
    )
    log_terms = s*np.log1p(a/b) + np.log(b) - 2*np.log(s)
    return simple_terms + log_terms


def beta_entropy_mpmath(a, b):
    a = mp.mpf(a)
    b = mp.mpf(b)
    entropy = mp.log(mp.beta(a, b)) - (a - 1) * mp.digamma(a) - (b - 1) * mp.digamma(b) + (a + b - 2) * mp.digamma(a + b)
    return float(entropy)

def show_multiple_plots():
    plt.figure(figsize=(13, 11))
    plt.subplots_adjust(hspace=0.5)

    n = 1
    for _a in (1.0, 2.0, 3.0, 4.0, 5.0, 6.0, 8.0, 10.0, 50.0, 100.0, 1000.0, 10000.0):
        a = np.array([_a for _ in range(50)], np.float64)
        b = np.logspace(2, 30)
        reference = np.array([beta_entropy_mpmath(_a, _b) for _a, _b in zip(a, b)], np.float64)
        regular = stats.beta(a, b).entropy()
        asymptotic_res = asymptotic_one_large(a, b)

        _x = np.log10(_a)
        digits = int(_x)
        d = int(_a / 10**digits) + 2
        ax = plt.subplot(4, 3, n)
        ax.loglog(b, np.abs((regular - reference) / reference), label="regular", ls='dashed')
        ax.loglog(b, np.abs((asymptotic_res - reference) / reference), label="asymptotic", ls='dotted')
        ax.set_title(f"Relative error: beta entropy for large b, a={_a}")
        ax.axvline(d*10**(7 + _x), c='k', label="Threshold")
        ax.legend(loc='upper left')
        ax.set_xlabel("$b$")
        ax.set_ylabel("$h$")
        n += 1
    plt.show()
I think the threshold could be improved because it does not seem easy to match it with increasing a. |

|
This looks good already but we might get more out of the expansions. To detect if we still have discontinuities (I don't expect so), could you create a 3D plot with:
I am a bit puzzled about the steep error increase between Please compare the relative error for the asymptotic formula using both variables and the asymptotic formula using only one variable. Maybe for |
scipy/stats/_continuous_distns.py
Outdated
| t2 = ( | ||
| - 1/(2*b) + 1/(12*b) - b ** -2.0/ 12 - 1/(12*sum_ab) | ||
| + 1/sum_ab + sum_ab**-2.0/6 |
There was a problem hiding this comment.
I would have expected also terms with the powers -4 and -6 here as the expansion is:

There was a problem hiding this comment.
I think for the last term in this expansion we should have - 1/(252*x**6) because simply 1/(252**6) will cause huge values when this is multiplied by a large value of b e.g. 1e50.
|
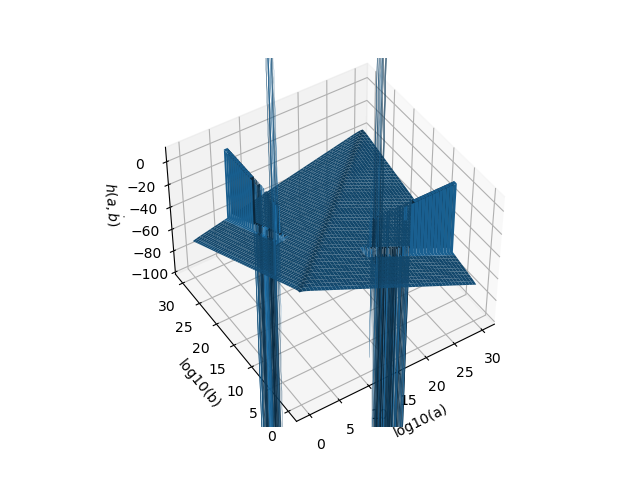
THere are still problems for specific parameter combinations:
import numpy as np
from scipy import stats
import matplotlib.pyplot as plt

a = np.logspace(0, 30, 1000)
b = a.copy()
A, B = np.meshgrid(a, b)

fig, ax = plt.subplots(subplot_kw={"projection": "3d"})
ax.set_xlabel("log10(a)")
ax.set_ylabel("log10(b)")
ax.set_zlabel("$h(a,\. b)$")
ax.set_zlim(-100, 10)

ax.plot_surface(np.log10(A), np.log10(B), stats.beta.entropy(A, B))

plt.show() |

Are these when a is moderately large the cases that we observed in the graphs above? |
You mean with the first expansion that we implemented when both are large right? |
|
How about adjusting the conditions to something like this def threshold_large(v):
if v == 1.0:
return 1000
j = np.log10(v)
digits = int(j)
d = int(v / 10 ** digits) + 2
return d*10**(7 + j)
if a >= 4.96e6 and b >= 4.96e6:
return asymptotic_ab_large(a, b)
elif a <= 4e6 and b - a >= 1e6 and b >= threshold_large(a):
return asymptotic_b_large(a, b)
elif b <= 4e6 and a - b >= 1e6 and a >= threshold_large(b):
return asymptotic_b_large(b, a)
else:
return regular(a, b) |
You could generate the 3D plot from above and check if the problems are gone to evaluate if it works better. |
|
@dschmitz89 How exactly do I generate this 3d plot with arrays because the conditions in the method are more applied to a scalar than to an array? |
I ran it directly from this branch, then the distribution infrastructure takes care of the necessary array broadcasting. |
|
With the new thresholds
|


There was a problem hiding this comment.
I think this should be good enough now. While the worst relative error is still on the order of 1e-10, there are no big visible oscillations anymore. Perfecting the expansions and thresholds more would require a lot of effort, so in my opinion this is more than enough now.
|
Before: After: import numpy as np
from mpmath import mp
mp.dps = 200
from scipy import stats
import matplotlib.pyplot as plt
@np.vectorize
def entropy_mpmath(a, b):
a = mp.mpf(np.float64(a))
b = mp.mpf(np.float64(b))
return (mp.log(mp.beta(a, b))
- (a - mp.one) * mp.digamma(a)
- (b - mp.one) * mp.digamma(b)
+ (a + b - 2) * mp.digamma(a + b))
log_az = np.arange(-50, 51)
log_bz = np.arange(-50, 51)
az = 10.**log_az
bz = 10.**log_bz
a, b = np.broadcast_arrays(az, bz[:, np.newaxis])
res = stats.beta.entropy(a=a, b=b).astype(np.float64)
ref = entropy_mpmath(a, b).astype(np.float64)
err = abs((res - ref)/ref)
err[err == 0] = 1e-16
log_err = np.log10(err)
plt.imshow(log_err)
n = len(log_az)
plt.xticks(np.arange(n)[::10], log_az[::10])
plt.yticks(np.arange(n)[::10], log_bz[::10])
plt.xlabel('log10(a)')
plt.ylabel('log10(b)')
plt.colorbar(label='log10(relative error)')
plt.clim(-16, 0)
plt.axis('equal')
plt.title('beta.entropy relative error')
plt.show()The problem areas that remain are where 
Code looks reasonable, but review is mostly by test. I confirmed that this does not seem to make the error worse in any regions, so this seems safe enough to merge based on tests. I'm running CI again, and if there are no failures from the new content, I'll merge. |


|
Thanks @mdhaber |
Reference issue
Towards: gh-18093
What does this implement/fix?
Additional information
CC: @dschmitz89 @mdhaber