Statistics General Concepts
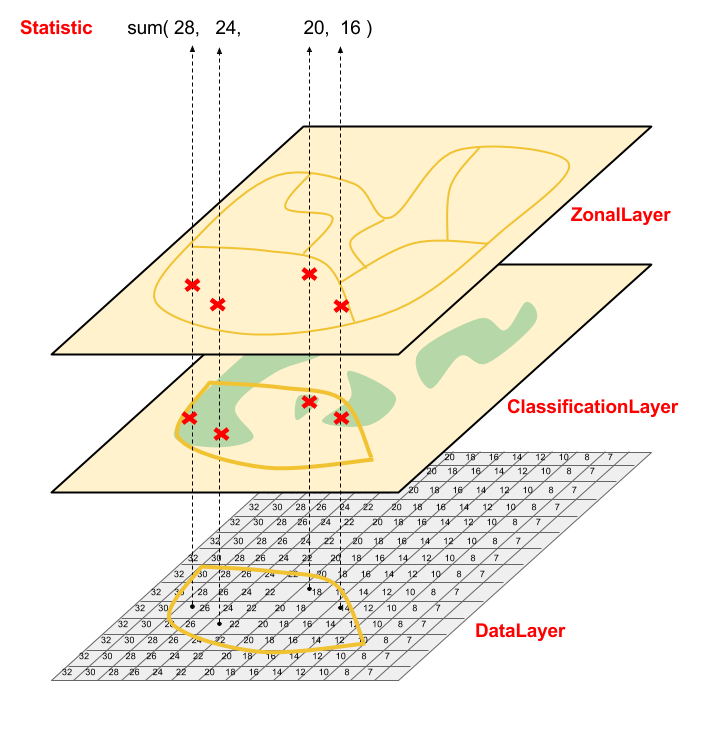
A visual representation of a quite common statistics process used in the SLMS platform.
The data layer holds the value in square kilometers of each pixel, a forest mask for the year x is used as a classification layer together with a zonal layer in order to get provinces-aggregated results. If this statistic is computed for n years charts will be produced showing the forest change along the years for each provinces.
The data layer contains the values that will be used for computing statistics. For instance, we may have an “area” raster where every pixel:
- holds the value of the area in sqkm of the area covered by the pixel itself
- holds the value of the density of inhabitants for area unit.
The example number 1 is the most common data layer used in the SLMS platform. Since the data are stored in EPSG:4326 we need to know, for each pixel, its value in square kilometer in order to calculate the forest/non-forest area having as classification layer a forest mask or Land Cover Classification
The SLMS platform provide a command-line utility to generate a EPSG:4326 data layer specifying a OGC Bounding box and the Raster resolution.
A set of different statistics can be computed on data layers:
- sum: sums the values in the data layer. For instance, in the “area” raster we may want to sum the area of various pixel to find out the extent of certain sub-areas.
- min, max: computes the minimum or maximum of the values encountered in the pixels of the data raster. We may use this in order to find out the most (or least) populated areas, when using the density layer.
- standard deviation: computes the stddev of the encountered values.
Statistics are more powerful when aggregated by subsets. We use classificators to aggregate them. For instances, we may aggregate statistics by province: it means that we may find, for every province, the maximum density of population. We may also have multiple classificators operating at once: using both provinces and forest type classificator, we may have the sqkm extension of every forest type for every province.
The classified statistic process takes a raster data layer in input and one or more raster layers as classificators. They have to have the same pixel dimensions and the same extents. It may have an input ROI.
The stats post-processing allows, only in the case a single statistic is requested, to pivot the values of the classes of one of the classificators.
Here’s a list of potential layers we may use as classificators:
- Land Cover Classification
- Land Cover Use
- Land Cover Change
- Forest Mask
- Forest classification
The zonal statistic process takes a zonal polygonal layer in input, one raster or punctual data layer and one raster classificator layer.
Here’s a list of potential layers we may use as classificators:
- administrative boundaries (provinces)
- UN-REDD projects
- forest type
- protected areas