System monitoring using the Ookla Speedtest API and Linux CLI tools
The Data Pipeline for this project is
- Airflow executes the python scripts for each every 5 minutes on a Linux machine
- Scripts connect to the Ookla servers or bash terminal, run the test, and store the data in a mysql database
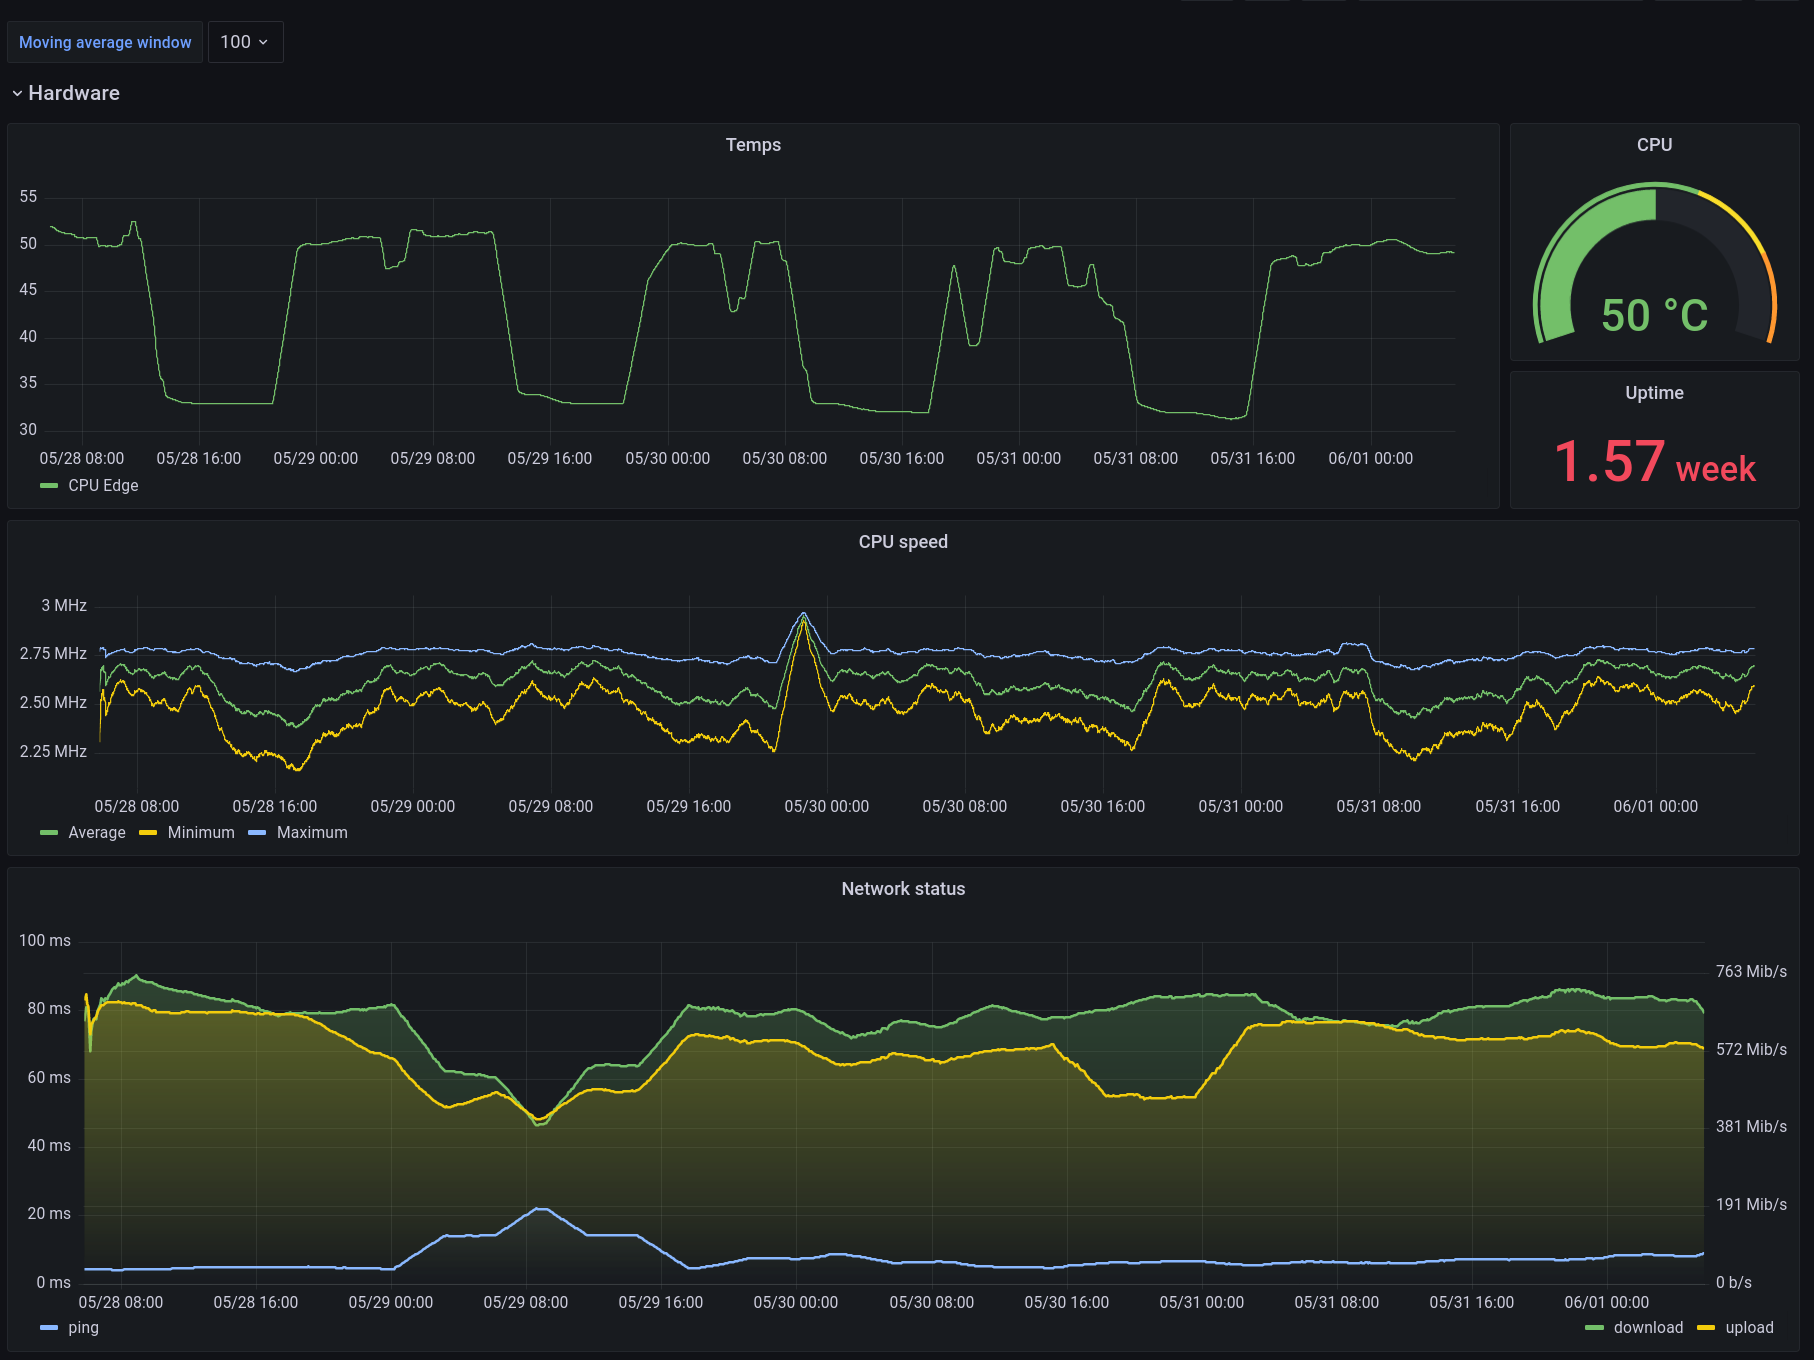
- Timeseries data is consumed by a grafana dashboard
We care about 3 things for this project when it comes to the database:
- The data types need to be able to store all possible values with no data loss.
- The data collection user can only add data.
- The data visualization user can only query data.
create database stats;
use stats;
Ookla gives us back ping values to the precision of microseconds (ex. 4.978 miliseconds) and we'd like to preserve that precision but if something is wrong and the value explodes to hundreds of seconds we don't care about the microseconds. This type of data is best represented by floating point numbers. Because these are defined by the system the server is running on and we don't need more than single-point precision the FLOAT data type is adequate.
Upload and download speeds are returned as a number of bits per second and mariadb offers us 8, 16, 24, 32, and 64 bit integers to store these values. The maximum bits per second each of these can store (unsigned) is as follows:
| bits | max speed |
|---|---|
| 8 | 256 bits/second |
| 16 | 64 kibibits/second |
| 24 | 16 mibibits/second |
| 32 | 4 gibibits/second |
| 64 | 16 exabits/second |
32bits is just barely enough to store a gigabit connection which is about the typical high end for home connection speeds. However, there are already businesses offering 10 gigabit to the home so the 64-bit BIGINT is the better choice.
Last up is the timeseries data which should be our primary key. We can use either TIMESTAMP or DATETIME. The difference is basically how to handle timezone conversions: automatically or manually. For this use case we don't have fluctuating timezones so it's simpler to not convert back and forth to UTC and just store the values as is using DATETIME.
create table speedtest (ping float, upload bigint, download bigint, testedon datetime default current_timestamp primary key);
speedy will be our user for adding data to the table and for security that should only happen on localhost. For adding data all this user needs is the ability to insert on our speedtest table.
create user 'speedy'@'localhost' identified by 'htI3V03xesIcATC8gsuTVd5eM5ImyddgxrvNw3bVjcat3QtK';
grant insert on speedtest to 'speedy'@'localhost';
Likewise we need a user to act as the bridge to the grafana dashboard and it should only be capable of querying data from local host.
create user 'grafana'@'localhost' identified by 'pH5sAVTXuA9XBOw0GZ7e7pDoVby9HB2KjKY0pdiKFLj5bDPj';
grant select on speedtest to 'grafana'@'localhost';