Grafana_displays_toplingdb_running_metrics configure_manually basis
preparation
- Use an executable of toplingdb by yourself; the current example is done using db_bench.
- Install prometheus
- Install grafana
- Basic understanding of the configuration file format. Toplingdb has a direct built-in and display interface for running status, which is set through a configuration file, and will not be introduced here.
Test environment introduction
- Test with docker
- The address of toplingdb is toplingdb_host:55125
- The address of prometheus is http://prometheus_host:55121
- The address of grafana is http://grafana_host:55122
toplingdb supports prometheus interface
- content of statistics The example is /statistics/stat-strings, corresponding to the content of "Statistics" in the configuration, there can be more than one, depending on the configuration file settings.
# list of Scrape configurations
scrape_configs:

  - job_name: 'stat-strings'
    metrics_path: '/statistics/stat-strings'
    params:
        metric: ['1']
        html: ['0']
    static_configs:
- targets: ['db_ip_port']- content of props There can be multiple different content (different db, different column_families), depending on the configuration file, an example of prometheus settings is as follows. There is only a default column_families of strings in subsequent run examples.
  - job_name: 'props-zsets-default'
    metrics_path: '/props/zsets/default'
    params:
        metric: ['1']
        html: ['0']
        noint: ['0']
    static_configs:
        - targets: ['db_ip_port']

  - job_name: 'props-zsets-data_cf'
    metrics_path: '/props/zsets/data_cf'
    params:
        metric: ['1']
        html: ['0']
        noint: ['0']
    static_configs:
        - targets: ['db_ip_port']

  - job_name: 'props-zsets-score_cf'
    metrics_path: '/props/zsets/score_cf'
    params:
        metric: ['1']
        html: ['0']
        noint: ['0']
    static_configs:
        - targets: ['db_ip_port']
Note: When the interface displays specific content, rocksdb-related statistical information will not be introduced here, please refer to relevant materials.
db_bench instruction: config.json content seen at "4 config.json content"
Note that the content of LD_LIBRARY_PATH here is changed to your own code location, and then it can be executed directly in the code directory. /data is the directory created by yourself to store data
export LD_LIBRARY_PATH=/code/toplingdb:/code/toplingdb/sideplugin/topling-zip/build/Linux-x86_64-g++-8.3-bmi2-1/lib_shared:/code/toplingdb/sideplugin/topling-zip/build/Linux-x86_64-g++-8.3-bmi2-1/rls/boost-shared/bin.v2/libs/fiber/build/gcc-8/release/threading-multi/visibility-hidden:/code/toplingdb/sideplugin/topling-zip/build/Linux-x86_64-g++-8.3-bmi2-1/rls/boost-shared/bin.v2/libs/filesystem/build/gcc-8/release/threading-multi/visibility-hidden:/code/toplingdb/sideplugin/topling-zip/build/Linux-x86_64-g++-8.3-bmi2-1/rls/boost-shared/bin.v2/libs/context/build/gcc-8/release/threading-multi/visibility-hidden:/code/toplingdb/sideplugin/topling-zip/build/Linux-x86_64-g++-8.3-bmi2-1/rls/boost-shared/bin.v2/libs/system/build/gcc-8/release/threading-multi/visibility-hidden:/code/toplingdb/sideplugin/topling-zip/build/Linux-x86_64-g++-8.3-bmi2-1/rls/boost-shared/stage/lib
cp sideplugin/rockside/src/topling/web/{style.css,index.html} /data/toplingdb/strings
./db_bench -json ./config.json -num 1000000000 -disable_wal=true -value_size 2000 -benchmarks=fillrandom,readrandom -batch_size=10toplingdb has many flexible settings. Not every indicator has corresponding content data under your settings. Some data indicators that do not need data can be ignored through this setting. Currently operating on statistics data.
- discard_tickers
Prometheus gauge or conter type data that needs to be ignored; - discard_histograms
Prometheus histogram type data that needs to be ignored;
For more details, please refer to the content of the last config.json
   "Statistics": {
      "stat-strings" : {
        "class": "default",
        "params": {
          "discard_tickers": [
            "# comment",
            "// comment: You can specify the prefix only, which must be bounded by . For example, the following two must be specified separately",
            "rocksdb.block.cache"
          ],
         "discard_histograms": [
            "# comment: ....",
            "rocksdb.blobdb",
            "rocksdb.bytes.compressed",
            "# comment end of array"
          ],
          "stats_level": "kAll",
          "//stats_level": "kExceptDetailedTimers"
        }
      }
},"/statistics/stat-strings" and "/props/strings/default" correspond to the requested url address. Data example:
$ curl -s "http://toplingdb_host:55125/statistics/stat-strings?html=0&metric=1" | head -5
engine:compaction:key:drop:new 426761
engine:number:keys:written 58279080
engine:bytes:written 117793676496
engine:no:file:opens 689
engine:db:mutex:wait:nanos 4462357547
$ curl -s "http://toplingdb_host:55125/props/strings/default?html=0&metric=1" | head -5
engine:num_immutable_mem_table 2
engine:num_immutable_mem_table_flushed 0
engine:mem_table_flush_pending 0
engine:compaction_pending 1
engine:background_errors 0
toplingdb_host:55125 is your listening port using the toplingdb program. Pay attention to setting two http request parameters: the "?html=0&metric=1" part in the data sample.
- metric: ['1']
- html: ['0']
# list of Scrape configuration
scrape_configs:
  - job_name: 'stat-strings'
    metrics_path: '/statistics/stat-strings'
    params:
        metric: ['1']
        html: ['0']
    static_configs:
        - targets: ['toplingdb_host:55125']

  - job_name: 'props-strings'
    metrics_path: '/props/strings/default'
    params:
        metric: ['1']
        html: ['0']
        noint: ['0']
    static_configs:
        - targets: ['toplingdb_host:55125']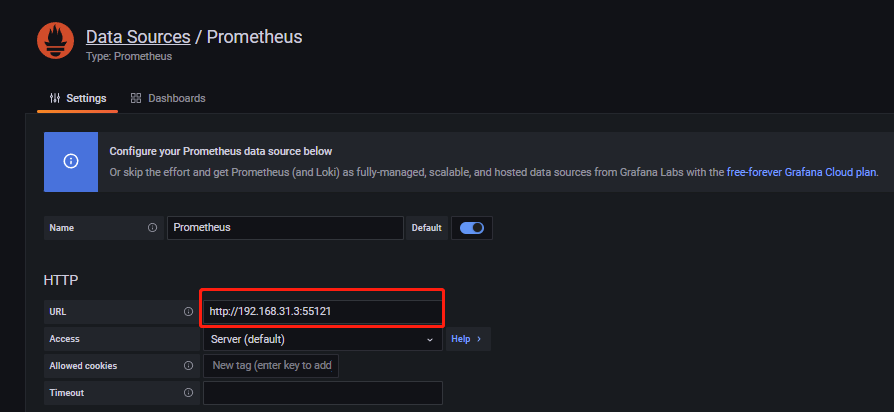
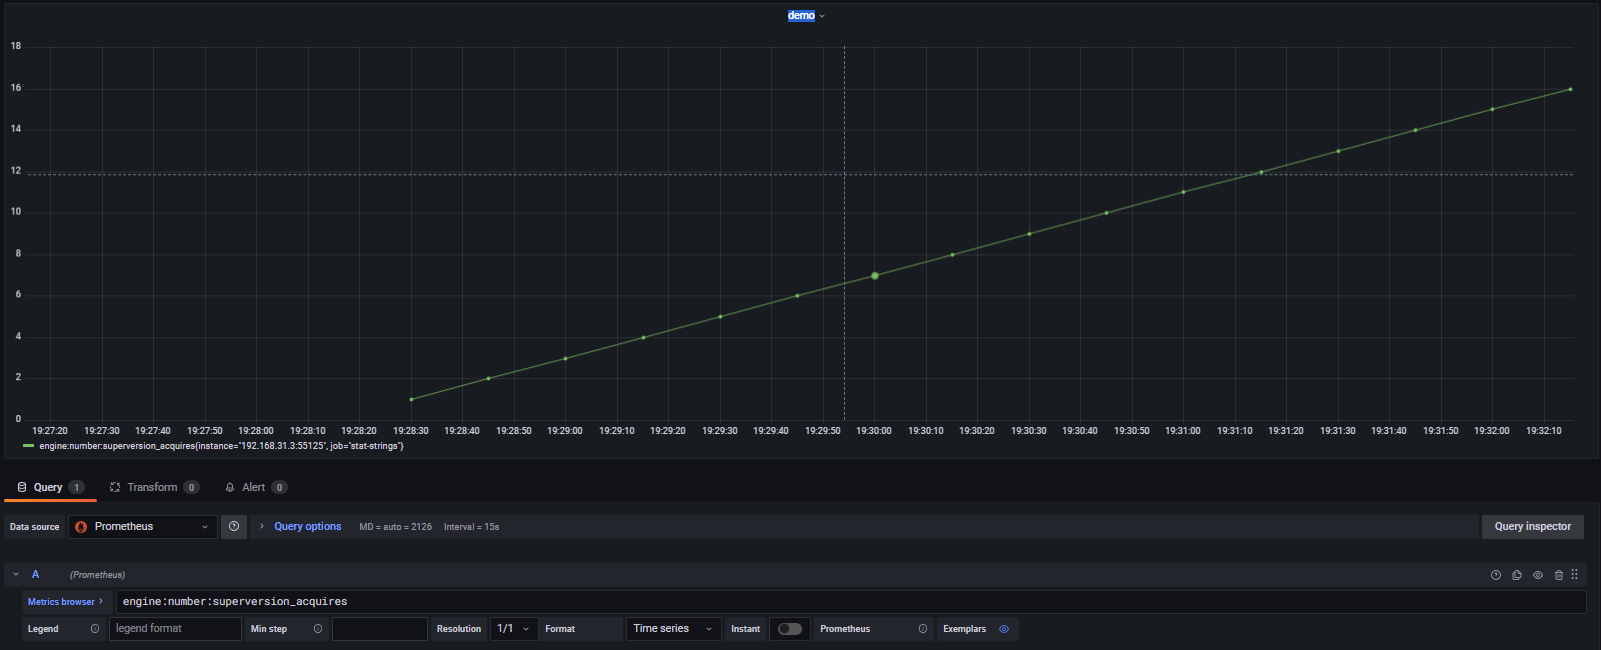
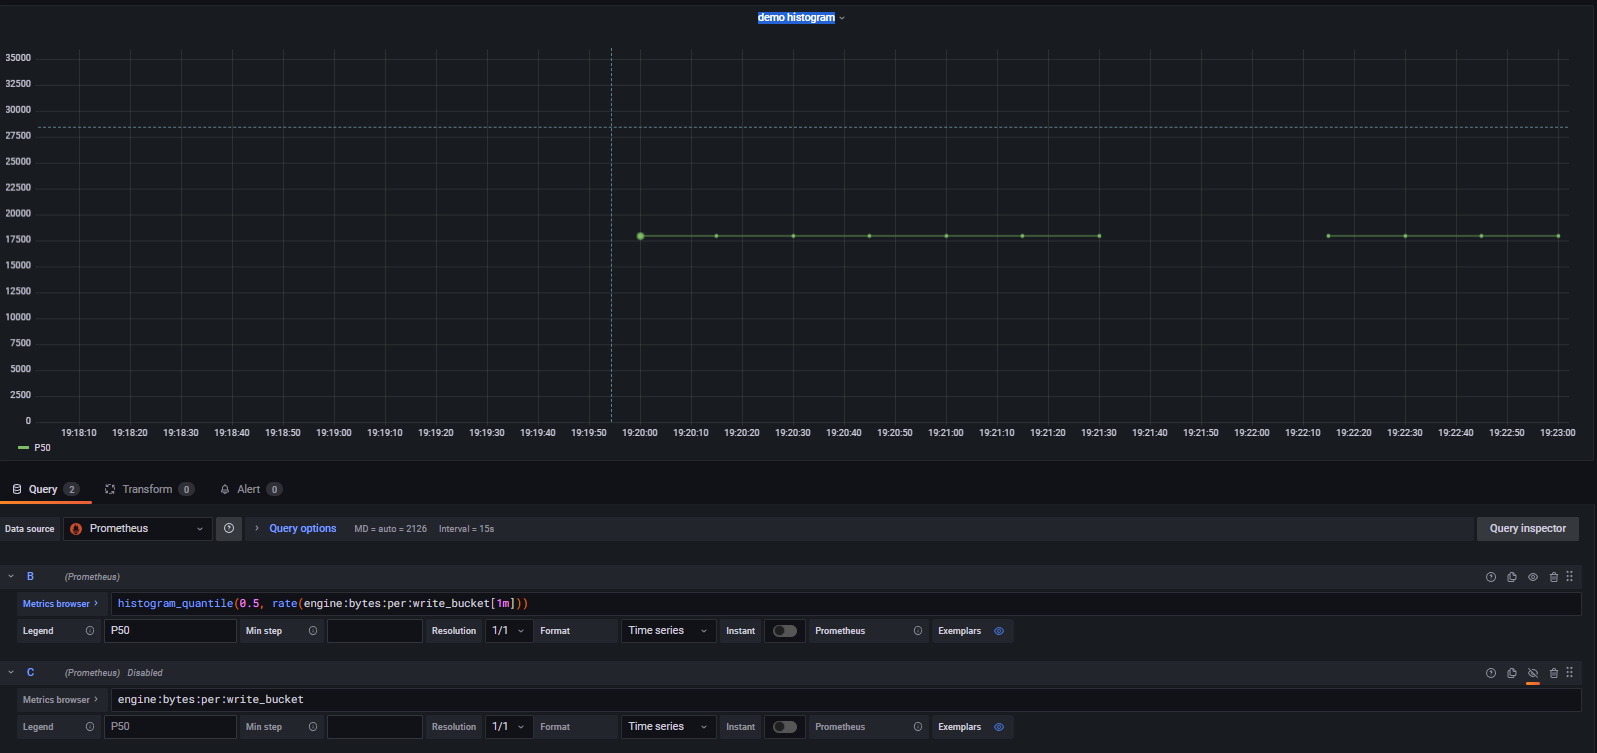
Create two dashboards to display prometheus gauge indicators, counter indicators and histogram indicators respectively. Other indicators can be added by yourself, and the indicator content can be viewed through the curl request of the data example or the direct webpage opening method. It is recommended to use the curl request to obtain and view.
engine:number:superversion_acquires
histogram_quantile(0.5, rate(engine:bytes:per:write_bucket[1m]))
Main configuration value: Note that the relevant variables can be set to this value
- /toplingdb/strings
- 10005 Here docker is used, 10005 is the internal port, and 55125 is mapped to the external.
Refer to sideplugin/rockside/sample-conf/lcompact_community.json and modify as follows
{
    "http": {
      "document_root": "/nvme-shared/toplingdb/strings",
      "listening_ports": "10005"
    },
    "setenv": {
      "DictZipBlobStore_zipThreads": 8,
      "StrSimpleEnvNameNotOverwrite": "StringValue",
      "IntSimpleEnvNameNotOverwrite": 16384,
      "OverwriteThisEnv": {
          "//comment": "overwrite is default to false",
          "overwrite": true,
          "value": "force overwrite this env by overwrite true"
      }
    },
    "Cache": {
      "clock-cache-default": {
        "class-needs-TBB": "ClockCache",
        "class": "LRUCache",
        "params": {
          "capacity": 0,
          "num_shard_bits": -1,
          "strict_capacity_limit": false,
          "metadata_charge_policy": "kFullChargeCacheMetadata"
        }
      },
      "lru_cache": {
        "class": "LRUCache",
        "params": {
          "capacity": "4G",
          "num_shard_bits": -1,
          "strict_capacity_limit": false,
          "high_pri_pool_ratio": 0.5,
          "use_adaptive_mutex": false,
          "metadata_charge_policy": "kFullChargeCacheMetadata"
        }
      }
    },
    "Statistics": {
      "stat-strings" : {
        "class": "default",
        "params": {
          "discard_tickers": [
            "# comment",
            "// comment: You can only specify the prefix, which must be bounded by '.'. For example, the following two must be specified separately",
            "rocksdb.block.cache",
            "rocksdb.block.cachecompressed",
            "# comment: The above two can also be summarized by the following",
            "rocksdb.block",
            "# Precisely specify",
            "rocksdb.memtable.payload.bytes.at.flush",
            "rocksdb.memtable.garbage.bytes.at.flush",
            "# pika do not use txn",
            "rocksdb.txn",
            "rocksdb.blobdb",
            "rocksdb.row.cache",
            "rocksdb.number.block",
            "rocksdb.bloom.filter",
            "rocksdb.persistent",
            "rocksdb.sim.block.cache"
          ],
          "discard_histograms": [
            "# comment: ....",
            "rocksdb.blobdb",
            "rocksdb.bytes.compressed",
            "rocksdb.bytes.decompressed",
            "rocksdb.num.index.and.filter.blocks.read.per.level",
            "rocksdb.num.data.blocks.read.per.level",
            "rocksdb.compression.times.nanos",
            "rocksdb.decompression.times.nanos",
            "rocksdb.read.block.get.micros",
            "rocksdb.write.raw.block.micros",
            "# comment end of array"
          ],
          "stats_level": "kAll",
          "//stats_level": "kExceptDetailedTimers"
        }
      }
    },
    "TableFactory": {
      "bb": {
        "class": "BlockBasedTable",
        "params": {
          "checksum": "kCRC32c",
          "block_size": "4K",
          "block_restart_interval": 16,
          "index_block_restart_interval": 1,
          "metadata_block_size": "4K",
          "enable_index_compression": true,
          "block_cache": "${lru_cache}",
          "block_cache_compressed": null,
          "persistent_cache": null,
          "filter_policy": null
        }
      },
      "dispatch": {
        "class": "DispatcherTable",
        "params": {
          "default": "bb",
          "readers": {
            "BlockBasedTable": "bb"
          },
          "level_writers": ["bb", "bb", "bb", "bb", "bb", "bb", "bb", "bb", "bb"]
        }
      }
    },
    "CFOptions": {
      "default": {
        "max_write_buffer_number": 4,
        "write_buffer_size": "128M",
        "target_file_size_base": "16M",
        "target_file_size_multiplier": 2,
        "table_factory": "dispatch",
        "compression_per_level": [
          "kNoCompression",
          "kNoCompression",
          "kNoCompression",
          "kZlibCompression",
          "kZlibCompression",
          "kZlibCompression",
          "kZlibCompression",
          "kZlibCompression"
        ],
        "level0_slowdown_writes_trigger": 20,
        "level0_stop_writes_trigger": 36,
        "//level0_file_num_compaction_trigger": -1,
        "ttl": 0
      }
    },
    "DBOptions": {
      "dbo": {
        "//bytes_per_sync": "2M",
        "create_if_missing": true,
        "create_missing_column_families": true,
        "//db_paths" : "/dev/shm/db_mcf",
        "max_background_compactions": 20,
        "max_subcompactions": 1,
        "max_level1_subcompactions": 7,
        "inplace_update_support": false,
        "WAL_size_limit_MB": 0,
        "statistics": "${stat-strings}",
        "allow_mmap_reads": true
      }
    },
    "databases": {
      "strings": {
        "method": "DB::Open",
        "params": {
          "db_options": "$dbo",
          "column_families": {
            "default": "$default"
          },
          "//comments": "//path is optional, if not defined, use name as path",
          "path": "/nvme-shared/toplingdb/strings/db_local_compact"
        }
      }
    },
    "open": "strings"
}