diff_expression
To detect differentially expressed transcripts, we run sophisticated statistical analysis methods integrated into the R Bioconductor suite, such as edgeR or DESeq2. These are both integrated into the Trinity analysis framework to simplify execution.
Try running edgeR using our counts matrix:
%  $TRINITY_HOME/Analysis/DifferentialExpression/run_DE_analysis.pl \
      --matrix Trinity_trans.counts.matrix \
      --samples_file samples.txt \
      --method edgeR \
      --output edgeR_trans
Examine the contents of the edgeR_trans/ directory.
% ls -ltr edgeR_trans/
.
-rw-rw-r-- 1 training training   1001 Oct  3 20:21 Trinity_trans.counts.matrix.GSNO_vs_ph8.GSNO.vs.ph8.EdgeR.Rscript
-rw-rw-r-- 1 training training 734806 Oct  3 20:21 Trinity_trans.counts.matrix.GSNO_vs_ph8.edgeR.DE_results
-rw-rw-r-- 1 training training 159075 Oct  3 20:22 Trinity_trans.counts.matrix.GSNO_vs_ph8.edgeR.DE_results.MA_n_Volcano.pdf
-rw-rw-r-- 1 training training   1005 Oct  3 20:22 Trinity_trans.counts.matrix.GSNO_vs_wt37.GSNO.vs.wt37.EdgeR.Rscript
-rw-rw-r-- 1 training training 736062 Oct  3 20:22 Trinity_trans.counts.matrix.GSNO_vs_wt37.edgeR.DE_results
-rw-rw-r-- 1 training training 162921 Oct  3 20:22 Trinity_trans.counts.matrix.GSNO_vs_wt37.edgeR.DE_results.MA_n_Volcano.pdf
-rw-rw-r-- 1 training training   1001 Oct  3 20:22 Trinity_trans.counts.matrix.ph8_vs_wt37.ph8.vs.wt37.EdgeR.Rscript
-rw-rw-r-- 1 training training 740971 Oct  3 20:22 Trinity_trans.counts.matrix.ph8_vs_wt37.edgeR.DE_results
-rw-rw-r-- 1 training training 163615 Oct  3 20:22 Trinity_trans.counts.matrix.ph8_vs_wt37.edgeR.DE_results.MA_n_Volcano.pdf
The files '*.DE_results' contain the output from running EdgeR to identify differentially expressed transcripts in each of the pairwise sample comparisons. Examine the format of one of the files, such as the results from comparing GSNO to wt37:
% head edgeR_trans/Trinity_trans.counts.matrix.GSNO_vs_wt37.edgeR.DE_results | column -t
.
                           logFC                    logCPM             PValue            FDR
TRINITY_DN5022_c0_g2_i1  9.49707206927776   10.8064019152136  2.76394324232293e-290  2.11773331226783e-286
TRINITY_DN1623_c0_g1_i1  7.07626413415546   10.7248178757945  1.72659888876553e-263  6.61460034286075e-260
TRINITY_DN5038_c0_g1_i1  8.2143888197428    12.590824463825   8.16475148164346e-260  2.08527752841174e-256
TRINITY_DN611_c0_g1_i1   6.99748245283561   10.3886702337903  2.35164882236904e-251  4.50458331924789e-248
TRINITY_DN1196_c0_g1_i1  7.66693385377398   9.62429477927643  3.14625702637954e-240  4.82132426722401e-237
TRINITY_DN235_c0_g1_i1   -6.84340232453515  9.31940620686212  1.2712197490933e-233   1.62334761959215e-230
TRINITY_DN6470_c0_g1_i1  -7.52247429960845  7.02692650884081  1.5022536219591e-222   1.64432389306437e-219
TRINITY_DN348_c0_g1_i1   -8.34481183802738  7.20863899236057  5.99388275515287e-216  5.74064120874766e-213
TRINITY_DN2419_c0_g1_i1  7.87366689800258   8.47510448730953  4.70441688285631e-213  4.00502690627167e-210
These data include the log fold change (logFC), log counts per million (logCPM), P- value from an exact test, and false discovery rate (FDR).
The EdgeR analysis above generated both MA and Volcano plots based on these data (eg. 'edgeR_trans/Trinity_trans.counts.matrix.GSNO_vs_wt37.edgeR.DE_results.MA_n_Volcano.pdf'). View these in your browser.
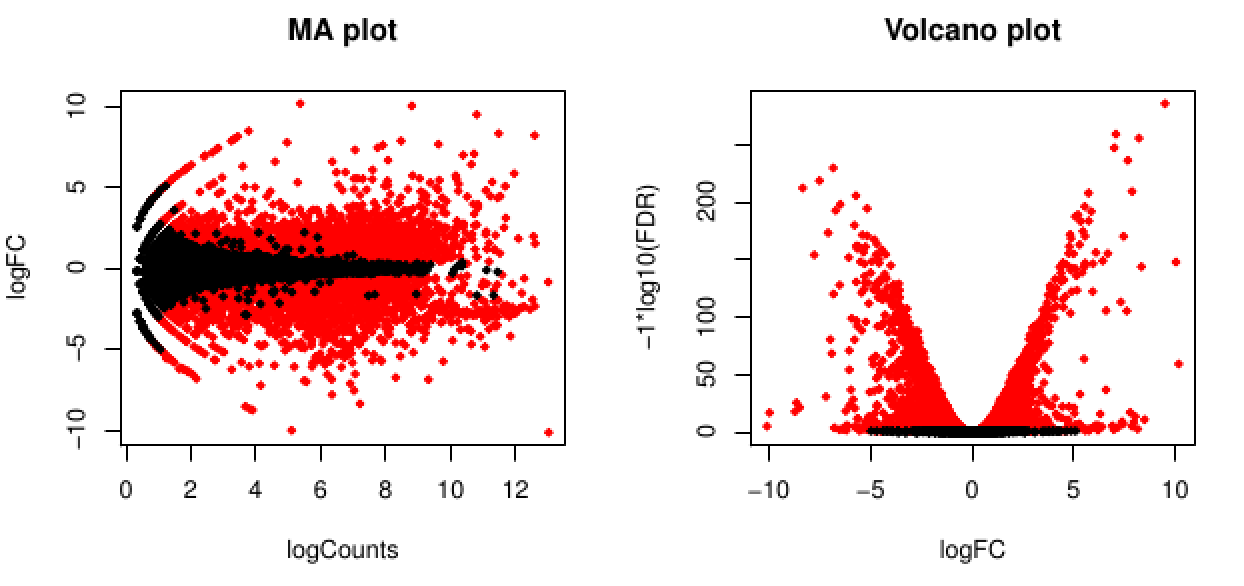
The red data points correspond to all those features that were identified as being significant with an FDR <= 0.05.
Trinity facilitates analysis of these data, including scripts for extracting transcripts that are above some statistical significance (FDR threshold) and fold-change in expression, and generating figures such as heatmaps and other useful plots, as described below.
Now let's perform the following operations from within the edgeR_trans/ directory. Enter the edgeR_trans/ dir like so:
% cd edgeR_trans/
Extract those differentially expressed (DE) transcripts that are at least 4-fold differentially expressed at a significance of <= 0.001 in any of the pairwise sample comparisons:
% $TRINITY_HOME/Analysis/DifferentialExpression/analyze_diff_expr.pl \
      --matrix ../Trinity_trans.TMM.EXPR.matrix \
      --samples ../samples.txt \
      -P 1e-3 -C 2
The above generates several output files with a prefix diffExpr.P1e-3_C2', indicating the parameters chosen for filtering, where P (FDR actually) is set to 0.001, and fold change (C) is set to 2^(2) or 4-fold. (These are default parameters for the above script).
Included among these files are: ‘diffExpr.P1e-3_C2.matrix’ : the subset of the FPKM matrix corresponding to the DE transcripts identified at this threshold. The number of DE transcripts identified at the specified thresholds can be obtained by examining the number of lines in this file.
% wc -l diffExpr.P1e-3_C2.matrix
.
2144 diffExpr.P1e-3_C2.matrix
Note, the number of lines in this file includes the top line with column names, so there are actually 2143 DE transcripts at this 4-fold and 1e-3 FDR threshold cutoff.
Also included among these files is a heatmap 'diffExpr.P1e-3_C2.matrix.log2.centered.genes_vs_samples_heatmap.pdf' as shown below, with transcripts clustered along the vertical axis and samples clustered along the horizontal axis.
View this heatmap from within your browser.
The expression values are plotted in log2 space and mean-centered (mean expression value for each feature is subtracted from each of its expression values in that row), and shows upregulated expression as yellow and downregulated expression as purple. The data used to generate this heatmap is in file 'diffExpr.P1e-3_C2.matrix.log2.centered.dat' (note the very similar name to the heatmap pdf file).
Using PtR, we can revise the heatmap view, adjusting the scaling to further brighten those features that are most highly differentially expressed:
% $TRINITY_HOME/Analysis/DifferentialExpression/PtR  \
     -m diffExpr.P1e-3_C2.matrix.log2.centered.dat \
     -s ../samples.txt \
     --gene_dist euclidean --sample_dist euclidean \
      --heatmap --heatmap_scale_limits "-4,4"
Examine which files were just generated via 'ls -ltr' and view the most recently generated heatmap pdf file: 'diffExpr.P1e-3_C2.matrix.log2.centered.dat.genes_vs_samples_heatmap.pdf' (view it)
Later we'll explore how we can identify the transcripts that cluster according to different expression profiles across these samples, and what biological functions they represent.
Now let's repeat the same operations to compute differentially expressed genes.
Change your directory back to your workspace:
% cd ~/workspace
and verify your location:
% pwd
.
/home/training/workspace
Now run the differential expression analysis at the gene level, using the 'gene' counts matrix as input.
%  $TRINITY_HOME/Analysis/DifferentialExpression/run_DE_analysis.pl \
      --matrix Trinity_genes.counts.matrix \
      --samples_file samples.txt \
      --method edgeR \
      --output edgeR_genes
Analyze the differential expression results for the genes similarly as you did earlier with the transcript-level data:
%   cd edgeR_genes/

%  $TRINITY_HOME/Analysis/DifferentialExpression/analyze_diff_expr.pl \
      --matrix ../Trinity_genes.TMM.EXPR.matrix \
      --samples ../samples.txt \
      -P 1e-3 -C 2
Feel free to examine the various files generated here and visualize the various pdf files as before (hint: go to your apache view and click on the new pdf files). Later, we'll be importing these data into our TrinotateWeb visualization tool for more interactive exploration.
At this point, you've completed all your identification of statistically significant differentially expressed transcripts and genes. In the next section, we'll study these data by exploring the potential biological functions of these transcripts.