Skip to content

A simple test with matplotlib to visualize a vector of weights of each region in Python

License

Notifications You must be signed in to change notification settings

whoisraibolt/Weights-of-Each-Region

Folders and files

NameName
Last commit message
Last commit date

Latest commit


History

5 Commits


Repository files navigation

Weights of Each Region

GitHub language count GitHub top language GitHub repo size GitHub

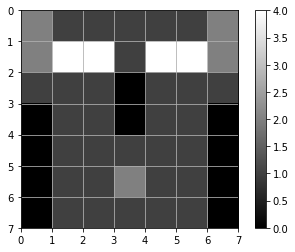
A simple test with matplotlib to visualize a vector of weights of each region in Python.

Overview

This Jupyter Notebook is just a silly test...

Plot Example Image

Dependencies

  • matplotlib
  • numpy

You can install missing dependencies with pip. And install TensorFlow via TensorFlow link.

Usage

  1. Install the dependencies;
  2. Run Jupyter Notebook in terminal to see the code in your browser.

License

Code released under the MIT license.

About

A simple test with matplotlib to visualize a vector of weights of each region in Python

Topics

Resources

License

Stars

Watchers

Forks

Releases

No releases published

Packages

No packages published