plot_scores
plot_scores create a histogram of the mean values per base of the quality scores from sequence data.
Plotting is done using GNUplot which allows for different types of output the default one being crufty ASCII graphics.
If plotting scores from sequences of variable length you can use the -c swith to co-plot the relative
count at each base position. This allow you to detect areas with a low relative count showing a high mean
score.
GNUplot must be installed for plot_scores to work. Read more here:
Also, the GNUplot gem for Ruby is required - run: gem install gnuplot
... | plot_scores [options]
[-?          | --help]               #  Print full usage description.
[-x          | --no_stream]          #  Do not emit records.
[-c          | --count]              #  Plot relative count.
[-o <file>   | --data_out=<file>]    #  Write result to file.
[-t <string> | --terminal=<string>]  #  Terminal for output: dumb|post|svg|x11|aqua|png|pdf  -  Default=dumb
[-T <string> | --title=<string>]     #  Set plot title                                       -  Default="Mean Quality Scores"
[-X <string> | --xlabel=<string>]    #  Set x-axis label                                     -  Default="Sequence position"
[-Y <string> | --ylabel=<string>]    #  Set y-axis label                                     -  Default="Mean score"
[-I <file!>  | --stream_in=<file!>]  #  Read input from stream file                          -  Default=STDIN
[-O <file>   | --stream_out=<file>]  #  Write output to stream file                          -  Default=STDOUT
[-v          | --verbose]            #  Verbose output.
Here we plot the mean quality scores from a 454 dataset:
read_sff -i GXS0P3T01.sff | plot_scores -x

                               Mean Quality Scores
      +           +          +           +          +           +
  40 ++-----------+----------+-----------+----------+-----------+----------++
      ******  *****                                      mean score ****** |
  35 +**************** *******                                             ++
      *************************                                            |
  30 +*************************   **                                       ++
      ******************************                                       |
  25 +******************************                                       ++
      ******************************                                       |
  20 +*******************************                                      ++
      *******************************  **                                  |
  15 +********************************************   *           *      ****+
      ********************************************************  *****  *****
  10 +**********************************************************************+
      **********************************************************************
   5 +**********************************************************************+
      **********************************************************************
   0 +**********************************************************************+
      +           +          +           +          +           +
      0          200        400         600        800         1000
                                Sequence position
To render X11 output (i.e. instant view) use -t x11:
read_sff -i GXS0P3T01.sff | plot_scores -t x11 -x
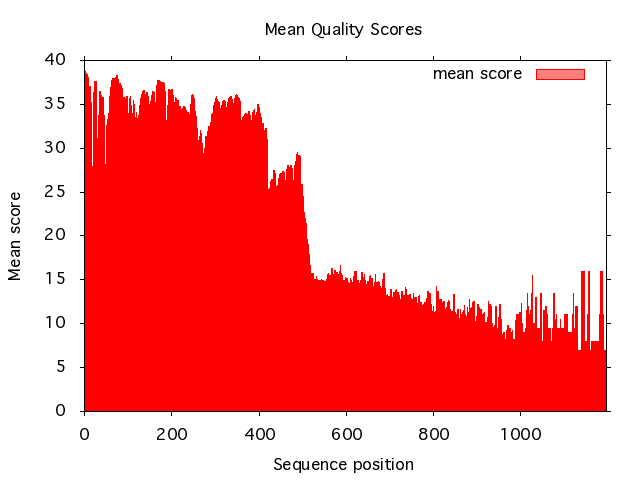
To generate a PNG image:
read_sff -i GXS0P3T01.sff | plot_scores -t png -o plot_scores.png -x
And the result will look like this:
To co-plot the relative count at each position use the -c switch:
read_sff -i GXS0P3T01.sff | plot_scores -c -t png -o plot_scores_count.png -x
And the result will look like this:

If you choose -t svg instead of -t png the output will be in SVG which is
neat since it can easily be modified using e.g. Inkscape to apply labels and such.
Read more about Inkscape here:
Martin Asser Hansen - Copyright (C) - All rights reserved.
April 2011
GNU General Public License version 2
http://www.gnu.org/copyleft/gpl.html
plot_scores is part of the Biopieces framework.