Quick-start: https://0hughman0.github.io/xl_link/quickstart.html
Installation: pip install xl_link
XLLink aims to provide a powerfull interface between Pandas DataFrames, and Excel spreadsheets.
XLLink tweaks the DataFrame.to_excel method to return its own XLMap object.
This XLMap stores all the information about the location of the written DataFrame within the spreadsheet.
By allowing you to use Pandas indexing methods, i.e. loc, iloc, at and iat. XLLink remains intuitive to use. But instead of returning a DataFrame, Series, or scalar, XLMap will instead return the XLRange, or XLCell corresponding to the location of the result within your spreadsheet.
Additionally XLMaps offer a wrapper around excel engines (currently supporting xlsxwriter and openpyxl) to make creating charts in excel far more intuitive. Providing a DataFrame.plot like interface for excel charts.
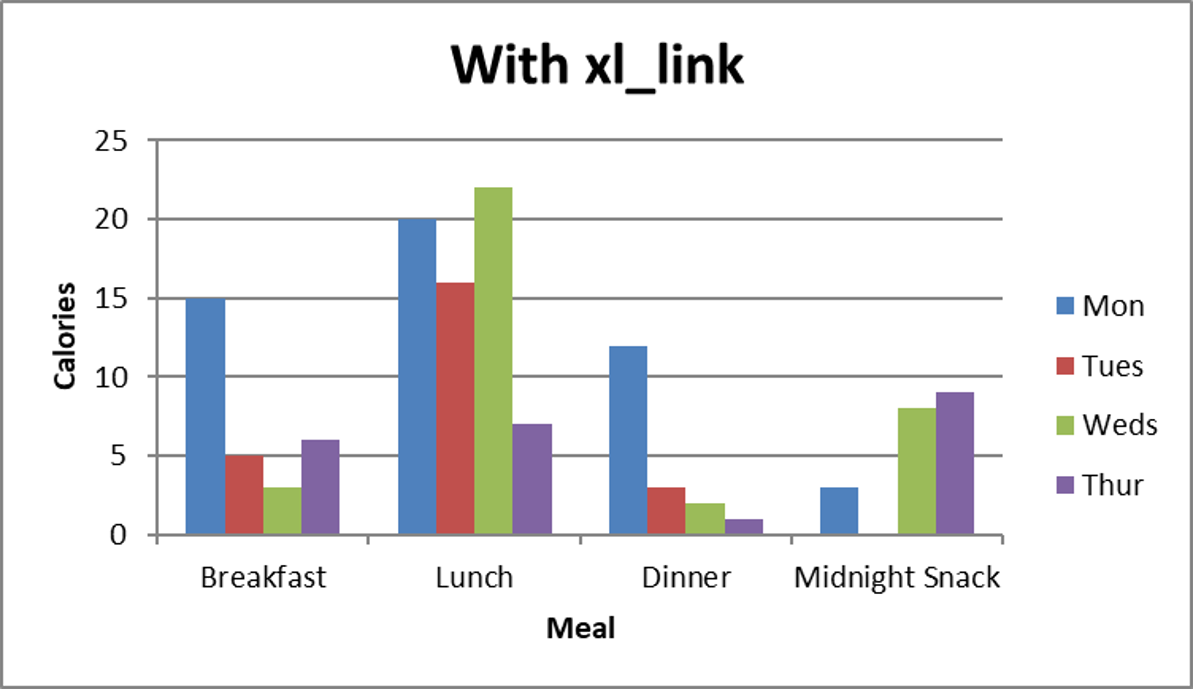
creating a complex chart is as easy as:
>>> f = XLDataFrame(index=('Breakfast', 'Lunch', 'Dinner', 'Midnight Snack'),
                    data={'Mon': (15, 20, 12, 3),
                          'Tues': (5, 16, 3, 0),
                          'Weds': (3, 22, 2, 8),
                          'Thur': (6, 7, 1, 9)})
>>> xlmap = f.to_excel('Chart.xlsx', sheet_name="XLLinked", engine='openpyxl')
>>> xl_linked_chart = xlmap.create_chart('bar', title="With xl_link", x_axis_name="Meal", y_axis_name="Calories", subtype='col')
>>> xlmap.sheet.add_chart(xl_linked_chart, 'F1')
>>> xlmap.writer.save()
Producing this chart:
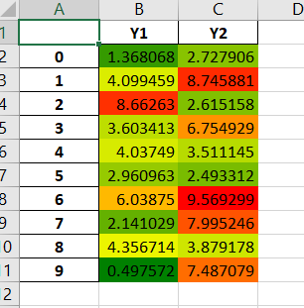
Applying conditional formatting to a table is as easy as:
>>> import numpy as np
>>> xy_data = XLDataFrame(data={'Y1': np.random.rand(10) * 10,
                                'Y2': np.random.rand(10) * 10})
>>> xlmap = xy_data.to_excel("ConditionalFormatting.xlsx", engine='xlsxwriter')
>>> xlmap.sheet.conditional_format(xlmap.data.range, # position of data within spreadsheet
                                   {'type': '3_color_scale',
                                    'min_type': 'num', 'min_value': xlmap.f.min().min(), 'min_color': 'green',
                                    'mid_type': 'num', 'mid_value': xlmap.f.mean().mean(), 'mid_color': 'yellow',
                                    'max_type': 'num', 'max_value': xlmap.f.max().max(), 'max_color': 'red'})
>>> xlmap.writer.save()
Check out the examples folder for more examples!
This package uses the utility functions from XlsxWriter under the BSD license found here: https://github.com/jmcnamara/XlsxWriter
pandas >= 0.19
Xlsxwriter >= 0.9
openpyxl >= 2.4
latest tested versions:
pandas==0.23.4
XlsxWriter==1.0.7 - (potential issue with stock chart, using openpyxl recommend if desired)
openpyxl==2.5.5