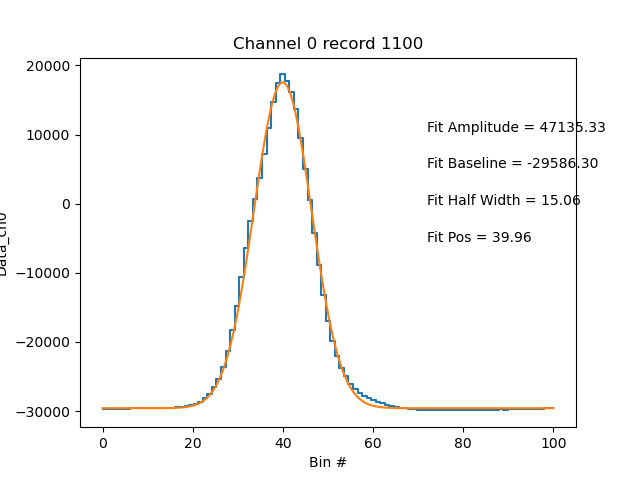
This is a python package for processing and visualizing SP2 data. It is based off of the IGOR code developed by Droplet Measurement Technologies. PySP2 currently supports processing all raw SP2 data (.sp2b, .hk, .ini) files into mass and number size distributions. It can plot individual waveforms as well as particle size distributions. Its file format is based off of the standard provided by the Atmospheric Community Toolkit which is based around xarray. PySP2 is currently used by the Department of Energy Atmospheric Radiation Measurment (ARM) Facility in order to process SP2 observations during field deployments such as TRACER and SAIL.
Documentation: https://arm-doe.github.io/PySP2/
Examples: https://arm-doe.github.io/PySP2/source/auto_examples/plot_read_sp2b.html
Python 3.7+

xarray

Atmospheric Community Toolkit

scipy

numpy

pandas
PySP2 is pip installable through:
pip install pysp2
In addition, PySP2 is available on conda-forge. Therefore, anyone with Anaconda can install PySP2 as such:
conda install -c conda-forge pysp2
For more information about how particle sizes are derived from SP2 signals using calibration, please consult the following references:
M. Irwin, Y. Kondo, N. Moteki & T. Miyakawa: Evaluation of a Heated-Inlet for Calibration of the SP2, Aerosol Science and Technology, 47:8, 895-905, DOI: 10.1080/02786826.2013.800187, 2013
Gysel, M., Laborde, M., Olfert, J. S., Subramanian, R., and Gröhn, A. J.: Effective density of Aquadag and fullerene soot black carbon reference materials used for SP2 calibration, Atmos. Meas. Tech., 4, 2851–2858, https://doi.org/10.5194/amt-4-2851-2011, 2011.

